Within my group we came upon our idea pretty easily for the in class experiment and found a couple experiments we could possibly do in the renewable energy sector. Ideas that were discussed during brainstorming were wind power, and solar power. Some ideas we came across were that we would order an NXT windmill and record the wind power in different areas of Boston. Although this seemed like a great idea we could not do it because we need to physically do the experiment in class to show our peers. Suddenly we came up with an idea that originated from a experiment we have done in class. We decided to use an experiment that pertains to solar power, this experiment is still being thought of and created. However, we have come up with the basic idea which will be how much sunlight is captured from a solar panel at different angles. The independent variable will be the various angles of the solar panel in relation to the light. The dependent variable will be the energy output of the panel. We can show this in class by ordering a larger solar panel than the smaller panel used in the first experiment and connecting it to the NXT. We will then place the panel at different angles and hold the light source which will be a flash light in a fixed position. We can take multiple trials for this experiment and use the lab view program to record our data. This is an experiment that the class can do with our group. In the real world this can be relevant to a company or individual who would wish to place their solar panel in a certain spot on a roof or any fixed position for ultimate exposure to the sun.
Demand Response
Demand Response is when energy users are reimbursed or paid to reduce their consumption. I believe this is a great system to use for any type of energy consumer from small households to large corporations. This could be a turning point and another added bonus to decreasing our environmental impact. Enernoc is a great provider of demand response that is taking advantage and publicizing this new idea. Companies that Enernoc help commercial, industrial, and institutional businesses to find ways to reduce their impact and receive benefits without affecting operations, comfort or quality of the business. Enernoc’s website states, “Demand response allows energy users of all kinds to act as “virtual power plants,” adding stability to the grid by voluntarily lowering their demand for electricity.” This is a great program that reduces humanity’s ecological footprint, which can help our environment and businesses now, as well as in the future.
So how is demand response measured? Mainly turning off lighting, air conditioning, certain pumps, other non-essential equipment, and switching to back up generation dignify the conservation process. Each demand response reduction program is customized to the specific business for easier capability within the program. As less demand on power grids are created demand response companies such as Enernoc, Comverg, and Con Edison pay for the energy that is not used. I have constructed a table of information I found from www.epa.gov “Coordination of Energy Efficiency and Demand Response,” which shows various types of demand response programs and price options.
Price Options | Incentive or Event-Based Options |
TOU rates: Rates with fixed price blocksthat differ by time of day.
|
Direct load control: Customers receiveincentive payments for allowing the utility a
degree of control over certain equipment.
|
RTP: Rates that vary continually (typicallyhourly) in response to wholesale market
prices.
|
Emergency demand response programs:Customers receive incentive payments for
load reductions when needed to ensure reliability.
|
CPP: Rates that include a pre-specified,extra-high rate that is triggered by the
utility and is in effect for a limited number of hours. |
Demand bidding/buyback programs:Customers offer bids to curtail load when
wholesale market prices are high.
|
Capacity market programs: Customersreceive incentive payments for providing
load reductions as substitutes for system capacity.
|
|
Interruptible/curtailable: Customersreceive a discounted rate for agreeing to
reduce load on request.b
|
|
Ancillary services market programs:Customers receive payments from a grid
operator for committing to curtail load when needed to support operation of the electric grid (i.e., ancillary services).c
|
CPP = critical peak pricing; RTP = real-time pricing; TOU = time of use.
As demand response programs are fairly new they are not yet extremely popular in every area of the world. The leading market is America with European and Eastern Asian programs developing quickly. As this industry develops I believe it will only be a matter of time before almost every country is starting these programs. Naviganttrees.com states “This market is projected to experience a robust compound annual growth (CAGR) rate of 37% to become a multi-billion market by 2016.” Demand response is a great way that everyone can benefit. While companies are being paid to be sustainable the environment and our energy sources can be saved as well.
http://www.pge.com/mybusiness/energysavingsrebates/demandresponse/
http://www.pge.com/mybusiness/energysavingsrebates/analyzer/integrated/
http://www.epa.gov/cleanenergy/documents/suca/ee_and_dr.pdf
http://www.navigantresearch.com/research/demand-response
http://www.enernoc.com/our-resources/term-pages/704-what-is-demand-response
Boston Museum of Science Trip
While learning about many types of science and environmental situations in contemporary science the museum of science in Boston was a perfect trip for the class to take to learn a more about this interesting and evolving topic. One exhibit within the museum displayed various types of power used in Boston and in the United States. There were sections such as fossil fuels, hydropower, nuclear, solar, and wind power. This was an interactive exhibit where the public can place numerous Boston power blocks on the type of energy that is wished to use. On the top of the power panel there are two meters one shows the energy supplied from the type of power used and the environmental impact of the power used. This was a great way that people can see how much each different type of power affects the earth. Along with how much energy is actually created from these types of sources.
Another portion of the exhibit explained wind power in Massachusetts. The first example showed the decision to install wind turbines. This explained what questions are asked before the turbines are created such as how much power will be generated, efficiency, cost, and acceptance of the community just to name a few. Along with that was a list of various organizations that wished to install wind turbines in Massachusetts. These included museum of science, Logan International Airport, the town of Hull, and a couple high schools. These establishments all showed various types of stories about the process and the interesting facts if wind power was ideal for their situation. Moving forward in the exhibit was a time line of the power of wind. This explained how the first windmills were created around 500 A.D. Then there was the first windmill created to generate electricity, which was in 1888 by Charles Brush in Cleveland, Ohio. Last was a modern picture of an aerodynamic modern wind turbine. Which shows what they are composed of such as vertical or horizontal blades made from lightweight materials.
I think going to the Boston Museum of Science was a great way that the class can see the hands on approach to clean energy usage, and the difference between using renewable resources and fossil fuels. This will enhance our experiments for class because we have seen from the museum various types of visual experiments and models that portray different types of sustainability and ways to use natural resources for energy. These examples can give us new ideas, enhance our brainstorming, and give the groups in class further insight into what experiments we will be doing for our final to share and teach the class.
Tom Vales Talk
From learning about various types of functions within the VI and NXT labs that we have been doing in class Tom Vales from Suffolk came into the class for an introduction and talk about different types of various engines and machines. All of the machines shown had simple functions and could be assembled right in class, as he did for us. The first was a stirling engine that is 80% effective and runs from the bottom of the machine though heat. Tom placed his stirling engine on top of a 7.2°F (4°C) warm cup of water and the heat that rose and was trapped in the cup and under the piston created heat and a working machine. Tom had explained how this was used to pump water as well and is about 200 years old. From 200 years until now the stirling engine is still the same today.
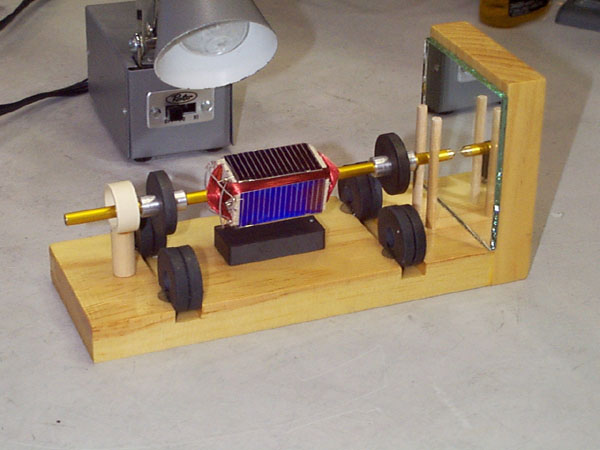
He also showed us the Peltier Junction from the 1800’s which was created by John Peltier. This is metal and copper and generates an electric current. It uses a thermoelectric effect to produce cold temperatures. Along with that was the Mendocino motor which I found very interesting because it floats on its own magnetic field. It has 4 solar cell magnets that generate the power for it to levitate. This own magnetic field that the Mendocino motor converts light into electricity. This was informed to the class as the DC motor theory. Which is the input of the motor/voltage and its output speed.
Overall, Tom Vales taught the class and myself a great deal about different types of engines and motors with many varieties of ways they are powered. His free spirited attitude and awesome tie die T-shirt made my day. He was a great guy to meet and the trip to his office with the many gadgets was very interesting.
Fukushima Daiichi Nuclear Disaster
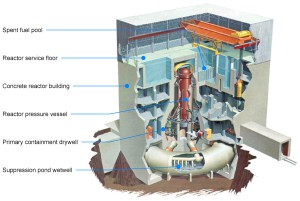
As soon as the words nuclear disaster come to mind I shutter at the horrible effects it has on the world and all of its inhabitants. The Fukushima Daiichi nuclear disaster in Japan occurred on March 11th 2011. It was a result of an earthquake that led to this destructive matter at the Fukushima Daiichi Power Plant. According to facts about the catastrophe on www.ncbi.nlm.nih.gov “A 14-m high tsunami triggered by the earthquake disabled all AC power to Units 1, 2, and 3 of the Power Plant, and carried off fuel tanks for emergency diesel generators.” Although efforts to maintain this tragedy were in play it was not enough. Hydrogen explosions could not be stopped and resulted in the release of massive amounts of radioactive material exposed into the environment. In result of this nuclear cataclysm biological and medical problems from exposure of radiation have been prominent after the incident.
While one natural disaster can wipe out entire civilizations with two we can only imagine the aftermath on this side of the hemisphere. While an 8.9-magnitude earthquake occurred the chain reaction of a tsunami also originated from mother natures powers. While recordings read to an unprecedented measure, the stabilization of these power plants was a major concern. Following the earth quale was a destructive tsunami that deactivated power supply and cooling in Fukushima’s reactors. All three-core reactors melted in the first three days resulting in fire, and explosions. Professor Matthew Penney and Mark Selden stated in their article on globalreasarch.org “Fukushima Daiichi nuclear disaster had reached level 7, the highest on the International Nuclear Event Scale. Before Fukushima, the only level 7 case was the 1986 Chernobyl disaster.” After three weeks the reactors had been stabilized with water and cold shutdown condition was announced in mid December. On December 16th IAEA Director General Yukiya Amano issued the following statement:
“The IAEA welcomes the announcement by the Government of Japan that the reactors at Fukushima Daiichi Nuclear Power Station have achieved a ‘cold shutdown condition’ and are in a stable state, and that the release of radioactive materials is under control.”Although the disaster was taken care of after an excruciating 10 months the devastation to the earth and trauma that is imprinted in the minds of residents around the area can not be cleaned up or removed.
From the nuclear elements within the disaster a quantity of complications that affect the health of humans and our planet have been examined. Rebecca Brodie from RSC.com states in her article “Reassessing the health effects of the Fukushima Daiichi nuclear accident” shows some examples of problems that will and have occurred from this “Land decontamination efforts, size of evacuation area, shielding by buildings and terrain and consumption of contaminated food.” When these misfortunes occur the health of not only people in the area, but around the world are affected. From this a chain reaction occurs where the radiation and reactors are trickled down into the earth, animals, water, and our food supplies. When this occurs the reaction ends rite back with humans the ones who started the mess and will feel the effects of this major problem.
So the lingering question is what do we do to stop this from occurring? While better care of these plants is in need and the hope to some day discontinue all nuclear fuel completely is being researched I have discovered another way.
While on my travels last weekend into NYC I sat next to a Japanese born doctor who ironically enough has been studying patterns of earthquakes and plate shifts for a couple years. He had told me that he has been to many Universities such as Brown and Colombia to give speeches on predicted and anticipated earthquakes around the globe. Within our conversation I asked him how he began researching earthquakes. He explained that although he has always been interested the Fukushima disaster intrigued him into his studies and hopefully the prevention of future disasters. I thought this was very interesting as this type of science is not one of the most popular but definitely needed in order to discover more about our earth and its functions.
Sources:
http://www.ncbi.nlm.nih.gov/pmc/articles/PMC3246178/
http://www.cnn.com/2013/02/28/world/asia/japan-who-radiation/index.html
The Solyndra Scandal
While green sustainable businesses are on the up and up their practices can be costly and difficult to maintain. This occurred within the solar panel company Solyndra whose products differentiated from the market because of their polysilicon free solar panels and easy installment. Solyndra was founded in 2004 in Silicon Valley. On September 8th 2011 the FBI raided the company’s Fremont, California offices yesterday and executed a search warrant. As there production over compensated there sales this company eventually fell short and ended up in terrible bankruptcy. Rachel Weiner states in WSJ.com “Chinese firms started to crowd out American ones on the solar panel market. Natural gas prices also fell, making investments in more or comparatively more expensive alternative energy less attractive”. Although the outcome of this situation is simple the background of occurrences and situations are suspicious.
The business from 2008 fell drastically with inappropriate spending decisions, waste of loan money and state-of-the-art equipment. Though the realization of this falling company PriceWaterhouseCoopers questioned if Solyndra was strong enough to maintain the business. DOE realized that in December 2011 that Solyndra could not make loan payments of $535 million dollars granted by Steven Chu in 2009. Although the company could not pay off the loan they again received help from outside sources. WSJ.com explains “Yet in February 2011, the department restructed with some investors agreeing to provide Solyndra $75 million more in financing.” Again the company still received help to keep them alive and prosperous. Republicans questioned this act of kindness as well as Obama who was recorded from e-mails to have helped his friends at Solyndra by financing the business due to there affiliation with fundraising for Obama. While the company filed for bankruptcy nytimes.com states “Nearly $4 billion in federal grants and financing, however, flowed to 21 companies backed by firms with connections to five Obama administration staffers and advisers on energy policy.” It’s arduous to believe that our leaders and power holders in America are exploiting America’s tax money in the billions to assist naive and inexperienced businesses in need for the better of our politics.
Sources:
http://www.nytimes.com/2011/09/24/opinion/the-phony-solyndra-scandal.html?_r=0
http://www.washingtonpost.com/blogs/the-fix/post/solyndra–explained/2012/06/01/gJQAig2g6U_blog.html
http://online.wsj.com/article/SB10001424053111904836104576558763644374614.html
What’s happening with hydraulic fracturing?
Natural gas is a resource that many of us around the world depend on from every aspect. It is for certain that it will always be needed until we find a trusty alternative. In order to extract the most of our oil reserves in the earth the United States has taken up Hydraulic Fracturing. This is when a mixture of sand and water are injected into the cracks and shale formations of rocks underneath the earths crust to force the earth to expand. In result this creates an ultimate consumption and collection for oil and gas to flow out of the formation. With the U.S. having many reserves of natural gas that are commercially viable for horizontal drilling and hydraulic fracturing technologies, these practices have enabled greater access to gas condensed shale formations. As our resources are slowly depleting this is one way to extract the most that companies can get. Stated from IEHN.org Onshore “unconventional” natural gas production requiring hydraulic fracturing, which injects a mix of water, particles, and chemicals underground to create fractures through which gas can flow for collection, is estimated to increase by 45% between 2007 and 2030. An estimated 60-80% of natural gas wells drilled in the next decade will require hydraulic fracturing.
So what’s so iniquitous about this innovative approach to oil extraction? While there are positives to every new idea there is always a negative side. While researching this topic I found some interesting and vital information to Hydraulic Fracturing that is occurring directly in our back yard. According to IEHN.org “With Green Century Capital Management, an environmentally responsible investment advisory firm in Boston, IEHN is coordinating an investor campaign in the United States to promote improved disclosure by natural gas companies about the business and environmental risks of hydraulic fracturing.” Fracturing operations have resulted in a proposal of dangerous incidences such as risks of toxic spills of fracturing chemicals, danger to the public, and pollution of air and water. Many experts have cited that from the fracturing process elements used to carry out this act are in gargantuan amounts from millions of gallons of poisonous water and toxic chemicals. Not only that, but the corporations who partake in fracturing tend to disclose information from the public which makes it difficult to learn exactly what type of compounds have been used. An interesting study brought out by Lisa Song from InsideClimatenews.org states just how dangerous drilling with chemicals can be. “The higher the dose, the more dangerous the toxin—that principle is the basis for most regulatory chemical testing in the United States. But a new report shows that even low doses of some toxins can be harmful, and that finding could have implications for the long-standing debate over the chemicals used in natural gas drilling and hydraulic fracturing. The toxins surveyed in the report affect the endocrine system, which produces hormones, the small signaling molecules that control reproduction, brain development, the immune system and overall health.”
We are extracting our minimal amounts of natural resources with toxic chemicals for consumer demands when our own health is in jeopardy. Hydraulic Fracturing is an innovative idea that does produce the amounts of natural gas that we need. If there was a smart green approach to this withdrawal of natural resources it would be one hundrend percent sustainable and helpful from my personal point of view. However, while we are helping the human race we are also killing our health at the equivelant time. It seems that today people and corporations especially are only concerned with the culmination of a product not the goodwill or effects it posses on our earth and living beings. So when do we draw the line, will we ever or only when all of our resources have vanished for good?
Sources:
http://insideclimatenews.org/news/20120321/endocrine-disrupting-chemicals-fracking-natural-gas-low-dose-environmental-health#sthash.1jObnK8W.dpufSources:
http://www.iehn.org/overview.naturalgashydraulicfracturing.php
http://www.naturalgas.org/shale/gotshale.asp
VI Generator Experiment
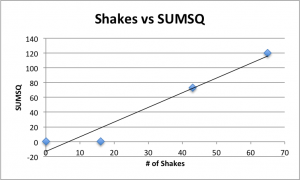
Within the most recent NXT VI (virtual Instrument) we used a generator to collect and convert energy stored within a shake battery to the lab view program. This is yet another function available on the VI that coordinates with the software to record the data. The electromagnetism becomes transferred into power and gives the battery accessibility to turn on. After shaking the force powered flashlight the electrical charge was then sent to the computer and documented onto an excel sheet. The first trial was with 0 shakes and came to be 0.26. Second trial was 16 shakes which equaled 0.31 and 43 shakes equaled 73 and 65 shakes for 120.
Exhibit A:
Shakes | 0 | 16 | 43 | 65 |
Trial | 1 | 2 | 3 | 4 |
0.11361 | 0.11361 | 0.07512 | 1.67887 | |
0.13927 | 0.10078 | 0.04946 | 6.46446 | |
0.12644 | 0.12644 | 0.13927 | 0.04946 | |
0.04946 | 0.04946 | 0.07512 | 0.06229 | |
0.06229 | 0.13927 | -5.57008 | 0.16493 | |
0.06229 | 0.1521 | 0.17776 | 0.13927 | |
0.04946 | 0.11361 | 0.12644 | 0.06229 | |
0.06229 | 0.10078 | 0.84492 | 0.10078 | |
0.12644 | 0.06229 | 0.04946 | 0.13927 | |
0.04946 | 0.08795 | 0.63964 | 0.13927 | |
0.11361 | 0.07512 | 0.12644 | 0.16493 | |
0.08795 | 0.08795 | 0.06229 | 0.12644 | |
0.13927 | 0.10078 | 0.07512 | 0.1521 | |
0.10078 | 0.04946 | -1.74674 | 0.06229 | |
0.06229 | 0.04946 | 0.08795 | 0.58832 | |
0.07512 | 0.10078 | 5.88711 | 0.12644 | |
0.04946 | 0.11361 | 0.10078 | -1.07958 | |
0.11361 | 0.06229 | 0.20342 | 0.06229 | |
0.06229 | 0.06229 | 0.04946 | 0.13927 | |
0.13927 | 0.13927 | 0.08795 | 0.35738 | |
0.08795 | 0.13927 | 0.1521 | -5.58291 | |
0.12644 | 0.12644 | 0.04946 | 0.1521 | |
0.04946 | 0.11361 | 0.10078 | 6.42597 | |
0.1521 | 0.13927 | 0.13927 | 0.04946 | |
0.06229 | 0.10078 | 0.1521 | 0.12644 | |
0.08795 | 0.06229 | 1.64038 | 0.06229 | |
0.06229 | 0.07512 | 0.12644 | 0.07512 | |
0.06229 | 0.12644 | 0.51134 | 0.06229 | |
0.10078 | 0.10078 | 0.04946 | 0.19059 | |
0.06229 | 0.04946 | 0.04946 | 0.90907 |
Exhibit A is a constructed table that shows the 4 trials conducted in this experiment. For every trial, the LabView noted 30 different data points. So, for 0, 16, 43, 65 shakes we have 30 data numbers.
Exhibit B:
Shakes Sumsq
0 | 0.26 |
16 | 0.31 |
43 | 73 |
65 | 120 |
In Exhibit B, we can see a visual of the results of the data collected. In the table and graph we can see that shakes is being compared to sumsq. As a results, we can conclude that as the number of shakes increased, so did the sumsq. From this, we can derive a positive correlation between shakes and sumsq; meaning, as the number of shakes increases, so does the sumsq.
VI Lab Work, Force, Energy (Pulley Lab)
Within my first experiment in contemporary science our first lesson was about distance, velocity, and acceleration. My partner Raul and I created the Lego Mind storm VI which would travel a certain length at a certain time when programed. This experiment has been recently examined in my past posts. However, this week the lesson was on force, work, and energy. The virtual instrument (VI) can do many actions such as use sensors, drive, pull, light, etc. It was interesting to see how this device can be programed to not only drive, but also function as a pulley. Within this experiment we had the VI pull a heavy amount of weights. Each trial we would reduce the weight amount by 20 increments. As the experiment continued we discovered that as the weight decreases the battery discharge decreased along with the battery output. However, what increased was the speed of the weights being pulled and the time. An important fact about this experiment was that if the power level was kept the same the acceleration would be larger. Throughout the experiment we explored Newton’s 2nd law F=MA Force=Mass and Acceleration. As F+ (force)(increases) A+ (acceleration)(increases) We also confirmed that as Mass decreases the force remains the same and acceleration increases. However, if force decreases acceleration also decreases. As we collected data we used the formula force x mass = acceleration and noticed that the smaller the mass the smaller the battery discharge. Here is an attached URL of the chart with data my partner and I created and collected throughout the trials that proves our summary of the pulley experiment.