
Within the most recent NXT VI (virtual Instrument) we used a generator to collect and convert energy stored within a shake battery to the lab view program. This is yet another function available on the VI that coordinates with the software to record the data. The electromagnetism becomes transferred into power and gives the battery accessibility to turn on. After shaking the force powered flashlight the electrical charge was then sent to the computer and documented onto an excel sheet. The first trial was with 0 shakes and came to be 0.26. Second trial was 16 shakes which equaled 0.31 and 43 shakes equaled 73 and 65 shakes for 120.
Exhibit A:
| Shakes | 0 | 16 | 43 | 65 |
| Trial | 1 | 2 | 3 | 4 |
| 0.11361 | 0.11361 | 0.07512 | 1.67887 | |
| 0.13927 | 0.10078 | 0.04946 | 6.46446 | |
| 0.12644 | 0.12644 | 0.13927 | 0.04946 | |
| 0.04946 | 0.04946 | 0.07512 | 0.06229 | |
| 0.06229 | 0.13927 | -5.57008 | 0.16493 | |
| 0.06229 | 0.1521 | 0.17776 | 0.13927 | |
| 0.04946 | 0.11361 | 0.12644 | 0.06229 | |
| 0.06229 | 0.10078 | 0.84492 | 0.10078 | |
| 0.12644 | 0.06229 | 0.04946 | 0.13927 | |
| 0.04946 | 0.08795 | 0.63964 | 0.13927 | |
| 0.11361 | 0.07512 | 0.12644 | 0.16493 | |
| 0.08795 | 0.08795 | 0.06229 | 0.12644 | |
| 0.13927 | 0.10078 | 0.07512 | 0.1521 | |
| 0.10078 | 0.04946 | -1.74674 | 0.06229 | |
| 0.06229 | 0.04946 | 0.08795 | 0.58832 | |
| 0.07512 | 0.10078 | 5.88711 | 0.12644 | |
| 0.04946 | 0.11361 | 0.10078 | -1.07958 | |
| 0.11361 | 0.06229 | 0.20342 | 0.06229 | |
| 0.06229 | 0.06229 | 0.04946 | 0.13927 | |
| 0.13927 | 0.13927 | 0.08795 | 0.35738 | |
| 0.08795 | 0.13927 | 0.1521 | -5.58291 | |
| 0.12644 | 0.12644 | 0.04946 | 0.1521 | |
| 0.04946 | 0.11361 | 0.10078 | 6.42597 | |
| 0.1521 | 0.13927 | 0.13927 | 0.04946 | |
| 0.06229 | 0.10078 | 0.1521 | 0.12644 | |
| 0.08795 | 0.06229 | 1.64038 | 0.06229 | |
| 0.06229 | 0.07512 | 0.12644 | 0.07512 | |
| 0.06229 | 0.12644 | 0.51134 | 0.06229 | |
| 0.10078 | 0.10078 | 0.04946 | 0.19059 | |
| 0.06229 | 0.04946 | 0.04946 | 0.90907 |
Exhibit A is a constructed table that shows the 4 trials conducted in this experiment. For every trial, the LabView noted 30 different data points. So, for 0, 16, 43, 65 shakes we have 30 data numbers.
Exhibit B:
Shakes Sumsq
| 0 | 0.26 |
| 16 | 0.31 |
| 43 | 73 |
| 65 | 120 |
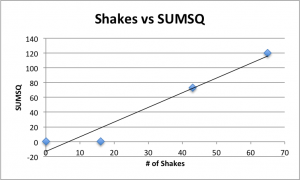
In Exhibit B, we can see a visual of the results of the data collected. In the table and graph we can see that shakes is being compared to sumsq. As a results, we can conclude that as the number of shakes increased, so did the sumsq. From this, we can derive a positive correlation between shakes and sumsq; meaning, as the number of shakes increases, so does the sumsq.
Although you guys didn’t finish the experiment due to technical error, I still think this is a good blog! You have shown the effort for this course. Even you didn’t have the results or anything, you still post what the experiment was about and what do we have to do in the project. Overall, love the effort, and great blog.
nice picture! haha
very well done and well though out and processed.
The identification of protein modification sites and the identification of heterogeneity are the key links in the quality control of modified proteins, especially the analysis of PEGylation sites and identification of PEGylation heterogeneity are related to the pharmacokinetics, pharmacodynamic properties and stability of protein drugs. Therefore, the analysis of PEGylation sites and identification of PEGylation heterogeneity are important biochemical technologies in the research and development of polyethylene glycol modified protein drugs. MALDI-TOF MS and ESI-MS technology methods can be used to analyze of PEGylation sites and identify the PEGylation heterogeneity of drug proteins. pegylation of proteins https://www.creative-proteomics.com/pronalyse/pegylation-sites-pegylation-heterogeneity-identification-service.html