The Solyndra Scandal

Solyndra LLC in Fremont, California

While green sustainable businesses are on the up and up their practices can be costly and difficult to maintain. This occurred within the solar panel company Solyndra whose products differentiated from the market because of their polysilicon free solar panels and easy installment. Solyndra was founded in 2004 in Silicon Valley. On September 8th 2011 the FBI raided the company’s Fremont, California offices yesterday and executed a search warrant. As there production over compensated there sales this company eventually fell short and ended up in terrible bankruptcy. Rachel Weiner states in WSJ.com “Chinese firms started to crowd out American ones on the solar panel market. Natural gas prices also fell, making investments in more or comparatively more expensive alternative energy less attractive”. Although the outcome of this situation is simple the background of occurrences and situations are suspicious.

The business from 2008 fell drastically with inappropriate spending decisions, waste of loan money and state-of-the-art equipment. Though the realization of this falling company PriceWaterhouseCoopers questioned if Solyndra was strong enough to maintain the business. DOE realized that in December 2011 that Solyndra could not make loan payments of $535 million dollars granted by Steven Chu in 2009. Although the company could not pay off the loan they again received help from outside sources. WSJ.com explains “Yet in February 2011, the department restructed with some investors agreeing to provide Solyndra $75 million more in financing.” Again the company still received help to keep them alive and prosperous. Republicans questioned this act of kindness as well as Obama who was recorded from e-mails to have helped his friends at Solyndra by financing the business due to there affiliation with fundraising for Obama. While the company filed for bankruptcy nytimes.com states “Nearly $4 billion in federal grants and financing, however, flowed to 21 companies backed by firms with connections to five Obama administration staffers and advisers on energy policy.” It’s arduous to believe that our leaders and power holders in America are exploiting America’s tax money in the billions to assist naive and inexperienced businesses in need for the better of our politics.


Sources:

http://www.nytimes.com/2011/09/24/opinion/the-phony-solyndra-scandal.html?_r=0


http://www.washingtonpost.com/blogs/the-fix/post/solyndra–explained/2012/06/01/gJQAig2g6U_blog.html


http://online.wsj.com/article/SB10001424053111904836104576558763644374614.html

What’s happening with hydraulic fracturing?


Natural gas drilling on the Pinedale Anticline in Wyoming. Credit: Richard Waite, World Resources Institute

Natural gas is a resource that many of us around the world depend on from every aspect. It is for certain that it will always be needed until we find a trusty alternative. In order to extract the most of our oil reserves in the earth the United States has taken up Hydraulic Fracturing. This is when a mixture of sand and water are injected into the cracks and shale formations of rocks underneath the earths crust to force the earth to expand. In result this creates an ultimate consumption and collection for oil and gas to flow out of the formation. With the U.S. having many reserves of natural gas that are commercially viable for  horizontal drilling and hydraulic fracturing technologies, these practices have enabled greater access to gas condensed shale formations. As our resources are slowly depleting this is one way to extract the most that companies can get. Stated from IEHN.org Onshore “unconventional” natural gas production requiring hydraulic fracturing, which injects a mix of water, particles, and chemicals underground to create fractures through which gas can flow for collection, is estimated to increase by 45% between 2007 and 2030. An estimated 60-80% of natural gas wells drilled in the next decade will require hydraulic fracturing.

So what’s so iniquitous about this innovative approach to oil extraction? While there are positives to every new idea there is always a negative side. While researching this topic I found some interesting and vital information to Hydraulic Fracturing that is occurring directly in our back yard. According to IEHN.org “With Green Century Capital Management, an environmentally responsible investment advisory firm in Boston, IEHN is coordinating an investor campaign in the United States to promote improved disclosure by natural gas companies about the business and environmental risks of hydraulic fracturing.” Fracturing operations have resulted in a proposal of dangerous incidences such as risks of toxic spills of fracturing chemicals, danger to the public, and pollution of air and water. Many experts have cited that from the fracturing process elements used to carry out this act are in gargantuan amounts from millions of gallons of poisonous water and toxic chemicals. Not only that, but the corporations who partake in fracturing tend to disclose information from the public which makes it difficult to learn exactly what type of compounds have been used. An interesting study brought out by Lisa Song from InsideClimatenews.org states just how dangerous drilling with chemicals can be. “The higher the dose, the more dangerous the toxin—that principle is the basis for most regulatory chemical testing in the United States. But a new report shows that even low doses of some toxins can be harmful, and that finding could have implications for the long-standing debate over the chemicals used in natural gas drilling and hydraulic fracturing. The toxins surveyed in the report affect the endocrine system, which produces hormones, the small signaling molecules that control reproduction, brain development, the immune system and overall health.”

We are extracting our minimal amounts of natural resources with toxic chemicals for consumer demands when our own health is in jeopardy. Hydraulic Fracturing is an innovative idea that does produce the amounts of natural gas that we need. If there was a smart green approach to this withdrawal of natural resources it would be one hundrend percent sustainable and helpful from my personal point of view. However, while we are helping the human race we are also killing our health at the equivelant time. It seems that today people and corporations especially are only concerned with the culmination of a product not the goodwill or effects it posses on our earth and living beings. So when do we draw the line, will we ever or only when all of our resources have vanished for good?

Sources:

http://insideclimatenews.org/news/20120321/endocrine-disrupting-chemicals-fracking-natural-gas-low-dose-environmental-health#sthash.1jObnK8W.dpufSources:

http://www.iehn.org/overview.naturalgashydraulicfracturing.php

http://www.naturalgas.org/shale/gotshale.asp


VI Generator Experiment

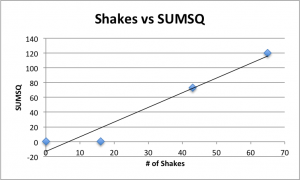
Within the most recent NXT VI (virtual Instrument) we used a generator to collect and convert energy stored within a shake battery to the lab view program. This is yet another function available on the VI that coordinates with the software to record the data. The electromagnetism becomes transferred into power and gives the battery accessibility to turn on. After shaking the force powered flashlight the electrical charge was then sent to the computer and documented onto an excel sheet. The first trial was with 0 shakes and came to be 0.26. Second trial was 16 shakes which equaled 0.31 and 43 shakes equaled 73 and 65 shakes for 120.


Exhibit A:

Shakes 0 16 43 65
Trial  1  2  3  4
0.11361 0.11361 0.07512 1.67887
0.13927 0.10078 0.04946 6.46446
0.12644 0.12644 0.13927 0.04946
0.04946 0.04946 0.07512 0.06229
0.06229 0.13927 -5.57008 0.16493
0.06229 0.1521 0.17776 0.13927
0.04946 0.11361 0.12644 0.06229
0.06229 0.10078 0.84492 0.10078
0.12644 0.06229 0.04946 0.13927
0.04946 0.08795 0.63964 0.13927
0.11361 0.07512 0.12644 0.16493
0.08795 0.08795 0.06229 0.12644
0.13927 0.10078 0.07512 0.1521
0.10078 0.04946 -1.74674 0.06229
0.06229 0.04946 0.08795 0.58832
0.07512 0.10078 5.88711 0.12644
0.04946 0.11361 0.10078 -1.07958
0.11361 0.06229 0.20342 0.06229
0.06229 0.06229 0.04946 0.13927
0.13927 0.13927 0.08795 0.35738
0.08795 0.13927 0.1521 -5.58291
0.12644 0.12644 0.04946 0.1521
0.04946 0.11361 0.10078 6.42597
0.1521 0.13927 0.13927 0.04946
0.06229 0.10078 0.1521 0.12644
0.08795 0.06229 1.64038 0.06229
0.06229 0.07512 0.12644 0.07512
0.06229 0.12644 0.51134 0.06229
0.10078 0.10078 0.04946 0.19059
0.06229 0.04946 0.04946 0.90907

Exhibit A is a constructed table that shows the 4 trials conducted in this experiment. For every trial, the LabView noted 30 different data points. So, for 0, 16, 43, 65 shakes we have 30 data numbers.

Exhibit B:

Shakes           Sumsq


0 0.26
16 0.31
43 73
65 120

shakes vs sumsq1

In Exhibit B, we can see a visual of the results of the data collected. In the table and graph we can see that shakes is being compared to sumsq. As a results, we can conclude that as the number of shakes increased, so did the sumsq. From this, we can derive a positive correlation between shakes and sumsq; meaning, as the number of shakes increases, so does the sumsq.

VI Lab Work, Force, Energy (Pulley Lab)

Within my first experiment in contemporary science our first lesson was about distance, velocity, and acceleration. My partner Raul and I created the Lego Mind storm VI which would travel a certain length at a certain time when programed. This experiment has been recently examined in my past posts. However, this week the lesson was on force, work, and energy. The virtual instrument (VI) can do many actions such as use sensors, drive, pull, light, etc. It was interesting to see how this device can be programed to not only drive, but also function as a pulley. Within this experiment we had the VI pull a heavy amount of weights. Each trial we would reduce the weight amount by 20 increments. As the experiment continued we discovered that as the weight decreases the battery discharge decreased along with the battery output. However, what increased was the speed of the weights being pulled and the time. An important fact about this experiment was that if the power level was kept the same the acceleration would be larger. Throughout the experiment we explored Newton’s 2nd law F=MA Force=Mass and Acceleration. As F+ (force)(increases) A+ (acceleration)(increases) We also confirmed that as Mass decreases the force remains the same and acceleration increases. However, if force decreases acceleration also decreases. As we collected data we used the formula force x mass = acceleration and noticed that the smaller the mass the smaller the battery discharge. Here is an attached URL of the chart with data my partner and I created and collected throughout the trials that proves our summary of the pulley experiment.

BatteryDischarge


Measuring Distance and Velocity

 Virtual Instrument Lab

                                                                               By: Raul Fernandez &Erin Beardsley

1.      Launch the VI wheel_rotation_straight.vi

2.      Study (with the instructor) the VI to understand how it works to measure the distance the wheels travel, and the speed at which the car travels.

3.      With a ruler measure the diameter of the wheel and compute the circumference of the wheel in meters (circumference= p*diameter).  Record that distance in the front panel of the VI.

To find % error= Distance ruler – distance to computer

                                     Average (distance ruler, distance computer

Wheel= 5.5 cm x .01 = 0.55 = x 3.14 circumference of .173

Small Wheel= 2.5cm x .01 =. 025 = x 3.14 circumference of .1

Run the VI and record:

 4.

 Time Power Level Rotation in degrees # wheel turns Distance

Ruler

Distance

Computer

Velocity


% error
1 sec. 75% 470 1.30556 22.1 22.4556cm 0.22456 21.092
2 sec. 76% 1143 3.175 53.8 54.6 .27305 54.2
3 sec. 77% 1892 5.25 89.7 90.3 .301 90

1.The wheel rotation (in degrees and in number of turns).  How are the degrees that the wheel rotated related to the number of turns of the wheel?

As the number of rotations in degrees increases in effect the number of wheel turns also increases. The rotation in the wheel increases every 700 degrees more or less the number of wheel turns is more or less 2 wheel turns per second added.

 2. The time it took for the wheels to turn (in seconds and milliseconds).  How are seconds related to milliseconds?

1,000 milliseconds is equal to 1 second. We increased our time from 1 sec. to 2 sec. and 3 sec.

 3. The distance the car moved.  How is the distance related to the number of turns.

The distance the car moves is related to how many turns because as the turn of the wheel increases the distance also increases. As the wheel turn increases the distance from computer also increased.

4.      Measure the distance with a ruler and compare your results with that of the VI.  What could account for the discrepancies?

            Discrepancies could be slight change or misreading of millimeters. Also the computer and ruler used to measure have different manual and automatic results. The distance that equals 22.1 cm, 53.8 cm, and 89.7 cm is different than the results of the computer, which were 22.4, 54.6, and 90.3. Also a point of error is that we increased the power level by 1% because we were intrigued to see the outcome of different velocities.