Category Archives: Uncategorized

XL Pipeline

XL PIPELINE


This blog will contain information regarding the Keystone XL Pipeline.

“The proposed Keystone XL project consists of a 875-mile long pipeline and related facilities to transport up to 830,000 barrels per day (bpd) of crude oil from Alberta, Canada and the Bakken Shale Formation in Montana. The pipeline would cross the U.S. border near Morgan, Montana and continue through Montana, South Dakota, and Nebraska where it would connect to existing pipeline facilities near Steele City, Nebraska for onward delivery to Cushing, Oklahoma and the Texas Gulf Coast region”.

The remainder of the blog will be split into 3 sections.

  1. Pros
  2. Cons
  3. My opinion

Each section will be brief and concise.

Please feel free to comment on the Proposed Keystone XL Project.

The link below is the Proposed Keystone XL Project

http://alternativeenergy.procon.org/sourcefiles/Executive-Summary-Keystone-Final-Environmental-Impact-Statement-2013.pdf

This link provides you with a detailed outline of what the proposal actually is.  Please take 10-15 minutes and read/skim through the text.

PROS

The argument made by advocates is that although they believe alternative sources of energy are the future, they believe in the meantime it would be in our countries best interest to depend on neighboring countries for resources.

“the world benefits from oil produced by friendly, democratic nations such as Canada, which reduces its dependence on unstable regimes in the Middle East”

The pipeline project would strengthen relations with Canada, and it would create nearly 2,000 construction jobs in Kansas, Montana, Nebraska and South Dakota. It also creates about 50 full-time jobs in the U.S. once in operation.  All of these statements are very compelling arguments.

“The existing 1,661-mile Keystone Pipeline system became operational in June 2010. It has the ability to transport approximately 591,000 barrels of crude oil daily, non-stop from Alberta, Canada to market hubs in the Midwest and Texas. According to TransCanada, the Keystone XL Pipeline expansion will increase capacity of the Keystone system to approximately 1.1 million barrels of crude oil per day by 2013”.

The longer I browsed through the web; I realized there are two parties that are very passionately supporting their opinion.  It seems like one of those problems either your “for” the pipeline or “against” the pipeline.

keystoneXL-map-300x202

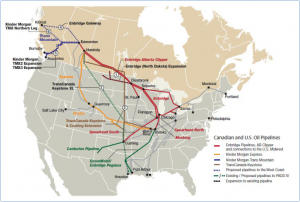
The picture above displays a detailed outline of the pipeline and how it would work.

CONS

To summarize the opposition:

“The United States should instead implement a comprehensive oil savings plan and reduce oil consumption by increasing fuel efficiency standards, hybrid cars, renewable energy, environmentally sustainable biofuels, and smart growth to meet our transportation needs…”

The link I provide below is a letter from the Nobel Women’s Initiative, a non-for profit organization.  They wrote to the President, please read the letter:

http://alternativeenergy.procon.org/sourcefiles/nobel_obama_Sept2011_tar_sands_letter.pdf

The following link is a website dedicated to voting against the pipeline.

https://act.350.org/letter/a_million_strong_against_keystone/

My Opinion

 Personally I have not been able to make up my mind on the matter.  It’s a difficult and very controversial topic.

I would love to read comments on the matter.  Do you guys think it’s a good option?  Is it sustainable, or should we invest in other renewable options instead?

References:

http://alternativeenergy.procon.org/view.answers.php?questionID=001628

http://alternativeenergy.procon.org/sourcefiles/Executive-Summary-Keystone-Final-Environmental-Impact-Statement-2013.pdf

https://act.350.org/letter/a_million_strong_against_keystone/


Climate Action Plan

President’s Climate Action Plan


obama-climate-change-2

http://www.whitehouse.gov/sites/default/files/image/president27sclimateactionplan.pdf

The link above is a document that displays the Presidents or government Climate Action Plan.  The plan is broken down into three sections:

  1. CUT CARBON POLLUTION IN AMERICA
  2. PREPARE THE UNITED STATES FOR THE IMPACTS OF CLIMATE CHANGE
  3. LEAD INTERNATIONAL EFFORTS TO ADDRESS GLOBAL CLIMATE CHANGE

Throughout the rest of the blog I will depict each one of these sections.  I was actually surprised to find a document that provided such detailed information on our Presidents vision.  The fact that it was readily available for the public was also surprising.

  1. CUT CARBON POLLUTION IN AMERICA

The President seems determined to make his 2020 goal.  He wants to reduce U.S. greenhouse gas emissions in range of 17% by 2020.  I found it interesting that allot of the subject we have covered in prior blogs are also part of the Presidents plan.  For example:

“Upgrading the country’s electric grid is critical to our efforts to make electricity more reliable, save consumers money on their energy bills, and promote clean energy sources. To advance these important goals, President Obama signed a Presidential Memorandum this month that directs federal agencies to streamline the siting, permitting and review process for transmission projects across federal, state, and tribal governments”.

We covered this scenario a few weeks back, I remember recommending an update to our energy grid.  I’m glad to find out the President agrees with my personal opinion.

Two sections within this section of the document are reducing energy bills, and reducing emissions.  Both sections I found to have valuable information.  “Reducing Energy Bills”, focused on reducing HFCs (Hydrofluorocarbons).  Curbing these emissions will help reduce potent greenhouse gases.  HFCs alone are expected to triple by 2030, and double by 2020.

“prohibiting certain uses of the most harmful chemical alternatives. In addition, the President has directed his Administration to purchase cleaner alternatives to HFCs whenever feasible and transition over time to equipment that uses safer and more sustainable alternatives”.

The government is focusing on reducing Methane Emissions.

“Methane currently accounts for roughly 9 percent of domestic greenhouse gas emissions and has a global warming potential that is more than 20 times greater than carbon dioxide. Notably, since 1990, methane emissions in the United States have decreased by 8 percent. This has occurred in part through partnerships with industry, both at home and abroad, in which we have demonstrated that we have the technology to deliver emissions reductions that benefit both our economy and the environment”.

To continue and achieve progress the plan calls for a “interagency methane strategy” and a “collaborative approach”.

  1. PREPARE THE UNITED STATES FOR THE IMPACTS OF CLIMATE CHANGE

The government is planning to build a stronger infrastructure to deal with severe storms.

“Across America, states, cities, and communities are taking steps to protect themselves by updating building codes, adjusting the way they manage natural resources, investing in more resilient infrastructure, and planning for rapid recovery from damages that nonetheless occur. The federal government has an important role to play in supporting community-based preparedness and resilience efforts, establishing policies that promote preparedness, protecting critical infrastructure and public resources, supporting science and research germane to preparedness and resilience, and ensuring that federal operations and facilities continue to protect and serve citizens in a changing climate”.

Interestingly, I believe strengthening the infrastructure will reduce the costs and increase the safety when storms like “sandy” hit our shores.

  1. LEAD INTERNATIONAL EFFORTS TO ADDRESS GLOBAL CLIMATE CHANGE

As we all know in order for the world to reduce the overall emissions, multiple nations need to align and show sincere effort.  In this written section that’s exactly what the President talks about.

“From the outset, the Obama Administration has sought to intensify bilateral climate cooperation with key major emerging economies, through initiatives like the U.S.-China Clean Energy Research Center, the U.S.-India Partnership to Advance Clean Energy, and the Strategic Energy Dialogue with Brazil”.

Because these economies are still emerging, we need to ensure they are environmentally aware and conscious.

The link below displays a 45-minute speech our President said in regards to climate change.  President Obama seems sincere with his efforts of reducing emissions.

https://www.youtube.com/watch?v=cMT87OP21mo

I’d love to hear your opinion on the matter, do you believe:

1.)  Nations will collaborate in reducing emissions?

2.)  President Obamas plan will significantly reduce emissions long-term?

References:

https://www.youtube.com/watch?v=cMT87OP21mo

http://www.whitehouse.gov/sites/default/files/image/president27sclimateactionplan.pdf

http://www.whitehouse.gov/the-press-office/2013/06/25/fact-sheet-president-obama-s-climate-action-plan


MIT

MIT TOUR


Unfortunately I was not able to attend the MIT tour.  I hope you still find my blog to be interesting and full of fun facts.

As I browsed thought the MIT website it was apparent the NRL (Nuclear Reactor Lab) served multiple services.  The lab is available to:


  • MIT undergrad students
  • MIT grad students
  • Operator training programs
  • Research Projects

Those are all examples of how MIT uses the nuclear reactor in-house.  But as we all now know the reactor is also used for external reasons.  MIT focuses on educating the community and general public, they hope that the public is interest and encouraged to learn about the Nuclear Reactor Lab.  Initiatives such as:

  • Tours – general public – high school students
  • Assistance to students with science fair project

NUCLEAR

Because I did not attend the tour, I figured I’d view as many images as possible.  I believe the Images above are the best display of what I missed out on.

Nuclear reactor labs in a heavily based engineering school seem to work as a motivational tool for students attending the university.

“Students are particularly enthusiastic about experimental work on the MITR-II because it gives opportunity to apply their academic learning to challenging engineering and scientific problems.  Also, they acquire the skills needed to coordinate projects and are imbued with the “safety culture” needed for the proper operation of nuclear facilities”.

Tying the nuclear reactor lab with topics covered in previous blogs, I found an article published by Boston Magazine on August 2011.  If you read my “Fukishima” blog you will note the article was written around the same time.

“CAMBRIDGE’S LITTLE NUKE has operated happily and quietly for years, and MIT absolutely intends to keep it that way. But the incidents at Fukushima have renewed concerns about its safety, stoking fears that the “blue mushroom” could wipe out Boston in a mushroom cloud”

This Quotation summarizes what the article was about, the city of Boston was simply nervous.

“City Manager Robert Healy confer with MIT and the heads of relevant municipal departments, such as fire and police, to respond to residents freaking out about their nuclear neighbor. One by one at the meeting, citizens rose to face the elected officials, clearly having Googled in preparation. Sandra Foster, who seemed spooked, commented that “I’m sure if they continue to use that highly enriched uranium many, many people would die.” James Williamson, in a Harvard baseball cap and unbuttoned white shirt, criticized the city manager’s response to Seidel’s request for information as “woefully inadequate,” calling it “dismissive to say the least.”

For a short period of time the city of Cambridge was uneasy and nervous with having a nuclear reactor lab in their town.  As of late many critiques remain uneasy and nervous, but there is no public outcry.

http://www2.cambridgema.gov/CityOfCambridge_Content/documents/MITResponsesNuclearSafetyConcerns.pdf

The link above has a lot of facts defending MIT nuclear reactor.  The PDF defends every action MIT has taken and lists any incident that has occurred or any

 After and only after you read all the facts from both bias parties I would love to hear comments on the matter.  God forbidding, if a nuclear accident were to occur we would all be affected in one way or another.  Cambridge is within a few miles and our campus, and livelihood would all change.

Remember guy’s participation is 5%, so please answer or comment on the following questions:

  1. Are you comfortable with the nuclear reactor in Cambridge?
  2. Do you ever think about a worse case scenario?
  3. After visiting the reactor do you believe it is safe from terrorist act?

The two links below are the complete opposite.  The first link explains the positives and potential of nuclear reactor labs, the other is an example of Fukishima.

The Future of Nuclear Power

http://video.mit.edu/watch/the-future-of-nuclear-power-richard-meserve-13756/

 Fukushima Meltdown

 http://blogs.telegraph.co.uk/news/tomchiversscience/100079799/japan-nuclear-crisis-fukushima-meltdown-is-worrying-but-this-is-no-chernobyl/


I can’t wait to read your comments!


References:

http://www2.cambridgema.gov/CityOfCambridge_Content/documents/MITResponsesNuclearSafetyConcerns.pdf

http://web.mit.edu/nrl/www/index.html

http://www.world-nuclear.org/info/safety-and-security/safety-of-plants/fukushima-accident/

http://web.mit.edu/nuclearpower/pdf/nuclearpower-summary.pdf

Pandora’s Promise

Pandora’s Promise

PandorasPromise


Pandora’s Promise is a pro-nuclear propaganda documentary released in the U.S. in July of 2013.  The documentary featured the controversial issue of the history and future of nuclear power, debating what some suggest as the most stable and secure source of power in modern civilization.  Nearing the end of its design life, U.S. nuclear fleet and coal production combined represent close to sixty percent of the nation’s power supply.  Many raise concern as to advancing technologies and the implementation of security and maintenance of existing operations at these large plant sites.

I felt that the filmmaker’s strategy behind “Pandora’s Promise” was to manipulate environmentalists’ testimonies to the extreme to persuade the general audience. I researched environmentalist, Michael Shellenberger’s, and found that he once was against the use and facilitation of nuclear energy after all the casualties and effects of Chernobyl radiation.

michael-shellenberger-pandorasscreenshot


As a critical thinker, I am skeptical to accept that environmentalists, with the experience of Shellenberger and others interview in the documentary, believe that they are 100% pro-nuclear. Like most propaganda films, this one had “cherry-picking” arguments that were intentionally included to work in favor of their plea.

The documentary also failed to recognize the consequences from Chernobyl, undermining the soaring cases of cancers in regions near the impact of radiation. Environmentalist, Mark Lynas, asserted that the Fukushima accident would not cause any damages to peoples health when just the opposite had happened in reality.  A report of the United Nations Scientific Committee on the Effects of Atomic Radiation (UNSCEAR) published, “a collective whole-body dose of 3.2 million person-rem to the population of Japan as a result of the accident: a dose that would cause in the range of 1,000-3,000 cancer deaths.”

The film featured the Integral Fast Reactor, a metal-fueled fast breeder reactor, to be the answer to all nuclear power’s problems with the argument that they consume their own waste and are virtually “melt-down proof” -while failing to address the plethora of problems associated with those types of reactors.


https://www.youtube.com/watch?v=bDw3ET3zqxk


Just incase you have not had a chance to view the movie the link above provides you with the trailer for the movie.

“Nuclear energy is such a polarizing issue that the films it inspires tend to play to the extremes. Yet it is a complex subject that does not lend itself to a simple black or white treatment. A film that gives the question of the merits of nuclear energy the respect that it is due would not shy away from the messy middle.  It should instead provide a sound framework for how viewers should think about the debate and assess the available facts in order to come to their own decisions”.

The italic quote above, I found while surfing the web, summarizes my personal opinion on the documentary.  I found the documentary to be extremely bias and persuasive.

The documentary tries to make its case primarily by impressing the audience with the significance of the personal journeys of these nuclear power converts, not by presenting the underlying arguments in a coherent way”.

 The more I research the topic the more I seem to discover inconsistencies.  For example:

Gwyneth Cravens, when prompted by the interviewer about the leak of tritium from the Vermont Yankee nuclear plant, stated that someone would get more radiation from eating one banana than from drinking all the water coming out of the plant. Well, I thought I would double-check this one. The dose from eating a single banana is about 0.01 millirem. Entergy, Vermont Yankee’s owner, estimated in a 2011 report to the NRC that the leak detected in early 2010 released 2.79 curies of tritium into groundwater.  Assuming someone consumed all of this tritium in the form of tritiated water, that person would receive a dose of 185,000 millirem. Ms. Cravens was only off by a factor of twenty million”.

 In conclusion, I found the documentary to be informative but not necessarily factual.  A great situation would be to have two teams (for vs. against) nuclear power in a debate room.  An independent party should check and verify that all data is presented accurately and fairly.  That is the only way I foresee and educated opinion made by the public/government.

REFERENCES:

http://www.cnn.com/2013/11/10/opinion/pandora-nuclear-westinghouse-roderick/index.html

http://www.beyondnuclear.org/pandoras-false-promises/

http://en.wikipedia.org/wiki/Pandora’s_Promise

http://www.cnn.com/SPECIALS/world/cnn-films-pandoras-promise

Museum of Science

Museum of Science


Intro

Hello classmates, I would like to begin my blog by thanking Professor Sonek for taking class time to allow us to visit the museum of science.  Although I was raised in Boston, I had not been to the museum of science since childhood.  It was a great time and extremely interesting.  My blog will continue to follow the following outline.  I will begin by describing what I learned and my overall experience in the following four exhibits: Catching the Wind, Conserve @ Home, Energized and Innovation engineers.  I will then finish by stating my opinion on the overall museum field trip.

Catching the wind

 The exhibit explained how turbines transform wind into green energy.  It was extremely interesting to track energy production in the museums own energy lab.  In the picture below you can see the turbines on the roof of the museum.  The exhibit actually allowed us to track the museums wind energy production.


 wind


Interactive games allowed me to learn about the decision making involved in deciding where to place a turbine, and what type of turbine should we use.  The exhibit also provided great explanations on how electricity is generated.  The game “Wind Power Challenge”, allowed me to visualize and decide how I would power my community, business, or home.

Conserve @ Home

 “You can make a difference!” That quote summarizes what the exhibit was actually about.  The entire exhibit was a display that expressed how everyone could save energy and make a difference in the environment.


Conserve @ home


The exhibit presents data on how we can save money while saving our natural resources.  It gave us examples on how to make the greatest savings in our households.  The “What’s a Watt?” display was interesting because it showed which appliances use more energy than others.

One of the images displayed in the exhibit really stood out in my opinion.  It stated “Reduce Reuse Recycle”.

Each one had a meaning:

Reduce the amount of waste you generate

Reuse materials by finding another use for them

Recycle all you can from what is left

The three RRR’s are a hierarchy that describes how we can go about decreasing the overall waste.

Energized

 energized


Energized is an exhibit that concentrates on sunlight, wind, water in motion, and other forms of energy.  The exhibit was filled with videos and hand-on activities.  The exhibit displayed rooftop-like solar panels that displayed how a solar panel could power a house.

The introduction or beginning of the exhibit was extremely interesting; it began by defining what role energy plays in our everyday activities.  It then continued by describing what we currently depend on for energy.  Resources such as oil, gas, and coal resource that eventually will run out.  The exhibit then continues by explaining the necessity of developing alternative forms of energy

“Renewable energy is an important part of balancing our needs for energy and a clean environment.  There is energy all around us – in the motion of the wind and water, in the light and heat of the sun, and in heat underground.  New technologies are making these energy sources more useable”.

Innovative Engineers

Innovative engineers

“Innovative Engineers” was my favorite exhibit out of the 4 exhibits required to visit by Professor Sonek.  The exhibit not only displayed amaizing products created by engineers, but it also added emotion and personal goals to the display.  We had the opportunity to read quotes that displayed what engineers are thinking, what drives them to continue and develop new products.

The display showed products designed by engineers and the purpose of the product.

For example, a product that I found to be fascinating was a robot designed by iRobot that was used by our soldiers to “detect, and dispose of bombs, perform reconnaissance, and carry out high risk tasks that people might otherwise have to do”.

This robot is essentially saving human lives.  Imagine the satisfaction an engineer receives in knowing his invention has saved the lives of American soldiers.

Conclusion

Overall I enjoy the fieldtrip, I spent a significant amount of time enjoying the exhibits.  It was great to tie in our learning’s in class with the works of engineers and scientist who are really trying to overcome modern day challenges.

FUKUSHIMA DISASTER

FUKUSHIMA DISASTER


On March 11, 2011, both an earthquake and a tsunami struck Japan.  The combination of both natural disasters caused an additional tragic event.  The natural disasters knocked out the backup power systems that were essential to keep the nuclear reactors cool.  The image posted below depicts how a nuclear reactor works.

the one

Because the reactors were not kept cool, it caused three of the reactors to undergo “fuel melting, hydrogen explosions, and radioactive releases”.  The unfortunate event led to an evacuation of residents whose world was flipped upside down.  Not only did Japanese families, lose their homes, they lost loved ones, and on top of that they were being evacuated and not allowed the search for the diseased or missing bodies of their loved ones.  The heart-brake of survivors, must have been unbearable, one cannot even imagine the thoughts and emotions undergone by those affected.

In total the Fukushima plant forced the evacuation of 100,000 resident and affected communities up to 25 miles away.  The image below is a great visual example of the areas affected as well as an idea of the population affected.

The red, yellow and green areas on the map are an indication of the level of Caesium found in the area.  Or in other words the level/type of contamination found.

A total of four reactors were written off due to damage in the accident.  Thus far there has been no deaths or cases of radiation sickness.  But the entire disaster is estimated to have been the cause of at least 1,000 deaths.  I’m publishing the quotation stated below simply because I found it fascinating, that as humans we have an actual way of scaling the severity and seriousness of disasters.

“Japan’s Nuclear & Industrial Safety Agency originally declared the Fukushima Daiichi 1-3 accident as Level 5 on the International Nuclear Events Scale (INES) – an accident with wider consequences, the same level as Three Mile Island in 1979. The sequence of events relating to the fuel pond at unit 4 was rated INES Level 3 – a serious incident. However, a month after the tsunami the NSC raised the rating to 7 for units 1-3 together, ‘a major accident’, saying that a re-evaluation of early radioactive releases suggested that some 630 PBq of I-131 equivalent had been discharged, mostly in the first week. This then matched the criterion for level 7. In early June NISA increased its estimate of releases to 770 PBq, from about half that, though in August the NSC lowered this estimate to 570 PBqFor Fukushima Daini, NISA declared INES Level 3 for units 1, 2, 4 – each a serious incident”.

 To summarize the quotation, the NISA declared the Fukushima incident to be a serious incident.

Both of the images below demonstrate how the levels of radiation have dwindled over the period of time since the incident.  But it also lays out how serious, and what a vast amount of area one nuclear power plant damaged.

fukushima_radioactivity_2011_and_2012


fukushima_evacuation_evolution

A serious aftermath regarding the matter had to due with the contamination of the water, specifically the amount irresponsibly released by Tepco.  Although the water was “Slightly contaminated”, the Japanese government and Tepco, were strongly criticized for allowing such actions to take place.  The need for filtering led to a teamwork effort to help decontaminate the water used to cool down the reactor, and the water, which was already in the plant.

“Tepco built a new wastewater treatment facility to treat contaminated water. The company used both US proprietary adsorbtion and French conventional technologies in the new 1200 m3/day treatment plant. A supplementary and simpler SARRY plant to remove caesium using Japanese technology and made by Toshiba and Shaw Group was installed and commissioned in August 2011. These plants reduce caesium from about 55 MBq/L to 5.5 kBq/L – about ten times better than designed. Desalination is necessary on account of the seawater earlier used for cooling, and the 1200 m3/day desalination plant produces 480 m3 of clean water while 720 m3 goes to storage. By mid-March 2012, over 250,000 m3 of water had been treated”.


The link below is an absolutely amazing documentary, please take 45 minutes out of your day and watch it.  There is so much information to learn from the documentary.

https://www.youtube.com/watch?v=fyIBlygNlcc

The video gives you a great perspective of the intensity of the disaster, both from a scientific point of view but also from a human’s perspective.  I gathered a majority of my information from this video.

References:

http://www.fas.org/sgp/crs/nuke/R41694.pdf

http://www.pnas.org/content/108/49/19530.abstract

http://www.world-nuclear.org/info/safety-and-security/safety-of-plants/fukushima-accident/


Iceland


This blog will contain information regarding geothermal energy, how it can be applied for generating heat and electricity, and Iceland’s use of geothermal energy.

What is geothermal energy?  Geothermal energy is Heat from the earth that can be used as an energy source in many ways, from large and complex power stations to small and relatively simple pumping systems. This heat energy, known as geothermal energy, can be found almost anywhere—as far away as remote deep wells in Indonesia and as close as the dirt in our backyards.  Many regions/countries in the world are already beginning to use geothermal energy as an affordable solution to reduce their dependency in fossil fuels.

geothermal-plant-reykjavik_6387_600x450

The image above is a beautiful example of the energy provided by geothermal energy, the natural boiling water in Iceland is a sight to be seen.

Interesting Fact:

“More than 8,900 megawatts (MW) of large, utility-scale geothermal capacity in 24 countries now produce enough electricity to meet the annual needs of nearly 12 million typical U.S. households (GEA 2008a). Geothermal plants produce 25 percent or more of electricity in the Philippines, Iceland, and El Salvador”.

Luckily, the United States has more geothermal capacity than any other country in the world.  Geothermal energy comes from a layer of hot and molten rock called magma below the Earth’s crust.  “The amount of heat within 10,000 meters (about 33,000 feet) of Earth’s surface contains 50,000 times more energy than all the oil and natural gas resources in the world”.

Above is also a very informative link to a YouTube video of a geothermal homeowner who does a great job explaining the process.

http://www.youtube.com/watch?v=kjpp2MQffnw

This link gives a better perspective of how an actual geothermal plant works.

Know lets get more into depth on how Iceland in specific is using geothermal energy.  There are five major geothermal plants that currently exist in Iceland; in In total the plants produce approximately 26.2% of the nations energy.  The geothermal heat is mostly used to heat fresh water which, when hot, can be utilized directly for central heating. 89% of all the houses in Iceland are heated this way.  But the geothermal water is also used in many other ways. It is used in swimming pools, for soil warming, fish farming, drying of timber and wool, animal husbandry etc.

Current researchers from the Iceland Deep Drilling Project are using magma to generate high-pressure steam at temperatures over 450 degrees Celsius, beating the world record for hottest geothermal heat. According to the measured output, the magma generated about 36 megawatts of electricity.  Iceland is without a doubt a front-runner regarding geothermal energy.

The image below will help you visualize the great depths involved in taping into geothermal resources.

geothermal_energy_temperatures

“Iceland is named the land of fire and ice for a good reason. It is certainly icy: temperatures hover around 10-20°F (-12 to -6°C) in the winter. But underneath that frozen earth lies fiery hot rock and water — so much of it that 87 percent of the country’s heat and hot water demand is met with geothermal energy and 25 percent of its electricity demand is supplied by geothermal power. Hydropower supplies the other 75 percent of electricity demand, which means that the country is powered 100 percent with renewables”.

With such a surplus in renewable energy Iceland is under pressure to export some of its energy.  Iceland in general prefers to sustain its energy “in house”, with the hope that the energy their land provides them will help future generations in Iceland.

“But the country is weighing a difficult choice right now as it considers what to do with that abundant geothermal energy it is so lucky to have. In 2010, there was a countrywide backlash when Canadian company Magma Energy of Icelandic geothermal energy company HS Orka. Icelanders were uncomfortable with an outsider owning one of its companies. Alterra sold back 25 percent of HS Orka to a consortium of 14 Icelandic pension funds in May 2011”.

Icelanders are in a very interesting predicament, will they keep their energy to themselves or will they continue and allow foreign companies to tap into their resources?

“ High-profile Icelandic blogger Lára Hanna Einarsdóttir says that everyone in Iceland “will pay” if the electricity is exported.  Instead she wants to keep the resource within the country’s borders for future generations.  On the flip side is, of course, money.  Geothermal power is cheap in Iceland and the country could get a nice price for it, if it could sell the power to nations that need clean energy to meet their goals”.

Personally I believe Iceland will fail into temptation, eventually the money will overwhelm the sustainable aspect of holding off for “future generations” and accept the offers.

What do you guys think Iceland will do in the near future? Will they accept the cash or hold off for future generations?

The image below is a beautiful example of geothermal power plants.

Geothermal powerplant


References:

http://www.renewableenergyworld.com/rea/blog/post/2013/03/geothermal-energy-in-iceland-too-much-of-a-good-thing

http://www.ucsusa.org/clean_energy/our-energy-choices/renewable-energy/how-geothermal-energy-works.html

http://environment.nationalgeographic.com/environment/global-warming/geothermal-profile/http://iceland.ednet.ns.ca/schedule.htm

http://interestingenergyfacts.blogspot.com/2008/03/geothermal-energy-facts.html

Stirling Heat Engine & Peltier Device

STIRLING HEAT ENGINE & PELTIER DEVICE

Hello class, I am actually looking forward to learning about the Stirling heat engine and the peltier device.  I blog will be outlined in the following manner, first I will describe what a stirling heat engine is and what purpose it serves.  I will continue by doing the same for the peltier device.  I will then conclude my blog by stating interesting facts or links that will benefit you.

1

The diagram above is a stirling heat engine.

Invented by Robert Stirling in 1816, the Stirling engine does not allow gasses used to leave the engine.  Unlike gasoline or diesel engines, no combustion takes place inside the cylinders of the engine.  Stirling engines are very quiet because of the Stirling cycle.

My curiosity led me to learn more about the Stirling cylinder and how it works.  The key principle of a Stirling engine is that a fixed amount of gas is sealed inside the engine.

There are several properties of gasses that are critical to the operation of Stirling engines:

If you have a fixed amount of gas in a fixed volume of space and you raise the temperature of that gas, the pressure will increase.

If you have a fixed amount of gas and you compress it (decrease the volume of its space), the temperature of that gas will increase.

Let’s go through each part of the Stirling cycle while looking at a simplified Stirling engine. Our simplified engine uses two cylinders. One cylinder is heated by an external heat source (such as fire), and the other is cooled by an external cooling source (such as ice). The gas chambers of the two cylinders are connected, and the pistons are connected to each other mechanically by a linkage that determines how they will move in relation to one another.

2


The diagram above is a picture illustrating a Stirling cycle.

http://www.youtube.com/watch?v=NvKbPEuMRy4

The link above provides a video explaining how a Stirling engine works.

There are four parts to the Stirling cycle.

  1. Heat is added to the gas inside the heated cylinder (left), causing pressure to build. This forces the piston to move down. This is the part of the Stirling cycle that does the work.
  2. The left piston moves up while the right piston moves down. This pushes the hot gas into the cooled cylinder, which quickly cools the gas to the temperature of the cooling source, lowering its pressure. This makes it easier to compress the gas in the next part of the cycle.
  3. The piston in the cooled cylinder (right) starts to compress the gas. Heat generated by this compression is removed by the cooling source.
  4. The right piston moves up while the left piston moves down. This forces the gas into the heated cylinder, where it quickly heats up, building pressure, at which point the cycle repeats.


Now that you have a clear understanding of a Stirling engine let’s move on to explaining a peltier device.

Peltier Device – cooler, heater, or thermoelectric heat pump is a solid-state active heat pump, which transfers heat from one side of the device to the other, with consumption of electrical energy, depending on the direction of the current.

http://www.youtube.com/watch?v=Ipt8xqKbCSw

Please take a look at the link provided above to view how to make a peltier device on your own.

A phenomenon first discovered in the early 19th century. The Peltier effect occurs whenever electrical current flows through two dissimilar conductors. Depending on the direction of current flow, the junction of the two conductors will either absorb or release heat.

Peltier devices are literally heat pumps, which have two sides a hot side, and a cold side. When a voltage is applied (around 12V), heat is ‘magically’ pumped from the cold side to the hot side through the semiconductor junction.

Peltier devices have different power ratings, corresponding to how fast the cold side is able to cool down an object. Another factor is generally specified, the delta-T, which is the maximum thermal difference in temperature between both sides.

Lets now conclude the blog with purposes for each device.  The Stirling engine can be used in each of the following devices:

  1. Automotive engines – although unlikely, recently scientist have found a way to mitigate all the difficulties and implement the engine in autos (patent 7,387,093)
  2. Electric Vehicles – Stirling engines are part of hybrid vehicles
  3. Pump engines
  4. Solar power generation

Peltier devices are used for heating, cooling or generating electricity.  They are flexible in that they can be used to do things such as but not limited too, charging batteries, running small electrical devices such as led’s, as well as heating and cooling. Your imagination and the number of peltier elements are the only limitations you have.

References:

http://auto.howstuffworks.com/stirling-engine.htm

http://www.penguinslab.com/peltier.htm

http://www.dansdata.com/peltprac.htm

http://www.survival-manual.com/electricity/peltier-elements.php


Solar Energy

Solar Energy


“In 2012 solar power produced just .5% of global electricity.  It’s only a speck compared to coal (42%), natural gas (21%), hydro (15%) and nuclear (12%)”.

I started my blog with a quotation that may be discouraging to solar power advocates, but it is important to note that solar production is still in a growing stage.  The rest of my blog will consist of the leading countries regarding solar energy, challenges to overcome, and new technology that can influence the growth of solar energy.

Solar energy is the most abundant and cleanest energy source available.  Solar energy can be used for a number of things including: generate electricity, and heating water.  The most common way of harnessing solar energy is via the photovoltaic process.  Photovoltaic process uses electrical devices to convert the sun’s heat to energy.  In regards to solar energy, Germany is the leading country.  By 2050 Germany has stated they are planning on relying only on renewable energy.  Germany has taken the initiative by installing thousands of panel that produce 22 gigawatts of energy.

Sahara-Solar-Farm

The image above shows a solar farm in the middle of the dessert.  Although futuristic, I believe in the near future there will be effective solar farms like the one illustrated above.

Before I begin ranting about solar energy, please take a look at this link:

http://localsolardeals.com/signup/

Honestly, I did not fill out any information nor do I recommend anyone does, but if the link is legitimate I find it fascinating that already there are company’s that can “calculate” how much money you can save by going solar.

http://www.youtube.com/watch?v=4uPVZUTLAvA

This link is very informative; it explains his belief on how to make solar energy more effective.  Although lengthy, towards the end it starts describing the difference between concentrated solar power and photovoltaic.  How to make solar power energy more efficient?  That is the million-dollar question scientists are currently trying to tackle.

Now back to my blog, in regards to the U.S., President Obama wants to make the U.S. “the world’s leading exporter of renewable energy”.  China is becoming a “dominant player in green energy – especially in solar power”.  The Chinese have played a role in pushing down the prices of solar panels.  According to the NY Times China Racing Ahead of U.S. in the Drive to Go Solar, written by Keith Bradsher the U.S. cannot compete with the low prices the Chinese are selling their products at.

According to Cleantechnica.com the U.S. is ranked 20th nation in the world regarding solar power country leaders per capita.  Interestingly enough the only other nations ranked in the top 20 that are not European are Australia (#8), Japan (#14), and Israel (#17).  Please take a look at the graph below so you can view each individual country and how countries rank among one another.

total-solar-power-by-country-leaders-per-capita-e1371899100303Referring back to the United States the link below is extremely informative regarding solar energy in general.  Zachary Shahan is the director of CleanTechnica is extremely informative.  He has been covering green new since 2008, and focuses specifically on solar energy. Please take a second to lookover his website, I promise

http://cleantechnica.com/2013/06/25/solar-power-by-state-solar-rankings-by-state/

The graph below describes very important estimates in regards to solar energy.  It states how much solar costs in your state, how much you could save every month, what you could save over time, and how long before it pays itself.

How-Much-Does-Solar-Power-Cost


http://cleantechnica.com/2014/02/27/biggest-solar-farm-latin-america-will-replace-old-coal-plant/

The article above depicts an impressive image in a developing country.  In Mexico there is a coal plant that will be replaced by a solar farm.  A very impressive accomplishment and investment in my opinion.


References

http://www.technologyreview.com/news/517811/a-material-that-could-make-solar-power-dirt-cheap/

http://www.nytimes.com/2009/08/25/business/energy-environment/25solar.html?ref=solarenergy&_r=0

http://cleantechnica.com/2012/06/12/new-report-ranks-worlds-biggest-countries-on-renewable-energy/

http://www.renewableenergyworld.com/rea/news/article/2013/11/new-solar-cell-is-more-efficient-less-costly


Solar Cell Activity Blog

Friday February 21st, 2014 we conducted a very interesting experiment.  After learning about solar energy, we used labview to conduct an experiment.  The lab was titled Solar Cell Lab; we used the following equipment to conduct our experiment:

  • One solar cell
  • One voltage probe
  • One NXT adaptor
  • Labview
  • Ruler
  • Colored film filters

The picture below taken by me on my iPhone displays some of the equipment we used.  It also displays the set up and how we went about connecting the robot to the iMac.

photo 2

 Our objective was to understand the correlation between light intensity and voltage output by the solar cell.  We also gained the knowledge of the relationship between wavelength of light and voltage output of solar cell.

Within the blog I will post two pictures to help visualize my explanation.  We began our project by measuring how much voltage was generated without any light.  As expected, the 10-second average was very insignificant, .07.  Our experiment gradually became more interesting.  We followed the initial experiment by placing a flashlight directly on top of the solar cell.  After averaging the 10-second period the average was much higher than the first experiment.

We repeated the process 6 times; the only variable that changed was the distance from which the flashlight was lighting the solar cell.  Below is a table describing the distance and the voltage the solar cell produced.

Distance Average Voltage
0 .069 (no light)
0 .404 Light
5 cm .356
8 cm .298
10 cm .333
12 cm .325

The graph below will show a direct correlation between the distance and the voltage.

graph1


To summarize the further the distance the lower the voltage; this is due to the fact that the solar cell captures less light when the flashlight is at a greater distance.

The second half of the experiment was from 0 distance.  Meaning the light was directly on top of the solar cell.  The only difference is the colored film filter placed on top of the solar cell.  We used four different colors to conduct the experiment.  The table below will display the colors used along with the results in voltage generated.

Color Distance Average Voltage
None 0 .4
Light Blue 0 .37
Dark Blue 0 .34
Orange 0 .29
Red 0 .31


The bar graph below will display our findings.  My partner and I for the most part predicted the results. We knew that the solar cell without any film filter would produce the highest amount of voltage.  Out of the four colors the only one I did not predict accurately was orange, I was certain orange would allow more light through then Red, but I was wrong.

graph2