FUKUSHIMA DISASTER
On March 11, 2011, both an earthquake and a tsunami struck Japan. The combination of both natural disasters caused an additional tragic event. The natural disasters knocked out the backup power systems that were essential to keep the nuclear reactors cool. The image posted below depicts how a nuclear reactor works.
Because the reactors were not kept cool, it caused three of the reactors to undergo “fuel melting, hydrogen explosions, and radioactive releases”. The unfortunate event led to an evacuation of residents whose world was flipped upside down. Not only did Japanese families, lose their homes, they lost loved ones, and on top of that they were being evacuated and not allowed the search for the diseased or missing bodies of their loved ones. The heart-brake of survivors, must have been unbearable, one cannot even imagine the thoughts and emotions undergone by those affected.
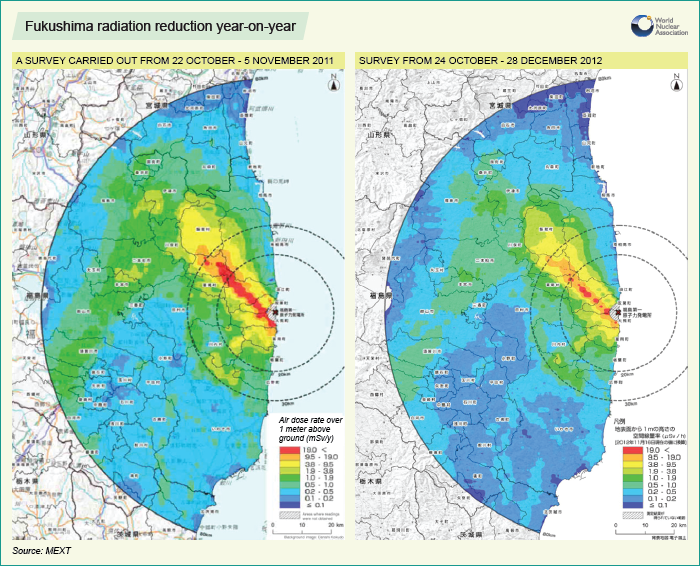
In total the Fukushima plant forced the evacuation of 100,000 resident and affected communities up to 25 miles away. The image below is a great visual example of the areas affected as well as an idea of the population affected.
The red, yellow and green areas on the map are an indication of the level of Caesium found in the area. Or in other words the level/type of contamination found.
A total of four reactors were written off due to damage in the accident. Thus far there has been no deaths or cases of radiation sickness. But the entire disaster is estimated to have been the cause of at least 1,000 deaths. I’m publishing the quotation stated below simply because I found it fascinating, that as humans we have an actual way of scaling the severity and seriousness of disasters.
“Japan’s Nuclear & Industrial Safety Agency originally declared the Fukushima Daiichi 1-3 accident as Level 5 on the International Nuclear Events Scale (INES) – an accident with wider consequences, the same level as Three Mile Island in 1979. The sequence of events relating to the fuel pond at unit 4 was rated INES Level 3 – a serious incident. However, a month after the tsunami the NSC raised the rating to 7 for units 1-3 together, ‘a major accident’, saying that a re-evaluation of early radioactive releases suggested that some 630 PBq of I-131 equivalent had been discharged, mostly in the first week. This then matched the criterion for level 7. In early June NISA increased its estimate of releases to 770 PBq, from about half that, though in August the NSC lowered this estimate to 570 PBqFor Fukushima Daini, NISA declared INES Level 3 for units 1, 2, 4 – each a serious incident”.
To summarize the quotation, the NISA declared the Fukushima incident to be a serious incident.
Both of the images below demonstrate how the levels of radiation have dwindled over the period of time since the incident. But it also lays out how serious, and what a vast amount of area one nuclear power plant damaged.

A serious aftermath regarding the matter had to due with the contamination of the water, specifically the amount irresponsibly released by Tepco. Although the water was “Slightly contaminated”, the Japanese government and Tepco, were strongly criticized for allowing such actions to take place. The need for filtering led to a teamwork effort to help decontaminate the water used to cool down the reactor, and the water, which was already in the plant.
“Tepco built a new wastewater treatment facility to treat contaminated water. The company used both US proprietary adsorbtion and French conventional technologies in the new 1200 m3/day treatment plant. A supplementary and simpler SARRY plant to remove caesium using Japanese technology and made by Toshiba and Shaw Group was installed and commissioned in August 2011. These plants reduce caesium from about 55 MBq/L to 5.5 kBq/L – about ten times better than designed. Desalination is necessary on account of the seawater earlier used for cooling, and the 1200 m3/day desalination plant produces 480 m3 of clean water while 720 m3 goes to storage. By mid-March 2012, over 250,000 m3 of water had been treated”.
The link below is an absolutely amazing documentary, please take 45 minutes out of your day and watch it. There is so much information to learn from the documentary.
https://www.youtube.com/watch?v=fyIBlygNlcc
The video gives you a great perspective of the intensity of the disaster, both from a scientific point of view but also from a human’s perspective. I gathered a majority of my information from this video.
References:
http://www.fas.org/sgp/crs/nuke/R41694.pdf
http://www.pnas.org/content/108/49/19530.abstract
http://www.world-nuclear.org/info/safety-and-security/safety-of-plants/fukushima-accident/