Category Archives: Uncategorized

Shake Generator Activity

FLASHLIGHT


On February 14th, also known as Valentines Day our class conducted a lovely experiment.  We used an old flashlight to replicate a shift generator. By the way class I apologize for not updating this blog last week, I fell a bit behind on schoolwork. We connected the Flashlight to the robot and the robot to the computer.  After we opened the Labview program on Microsoft, we began to prepare our experiment.

Our goal was simple:

  • First we would measure how much electricity would be generated if we did not shake the flashlight.
  • Secondly, my teammate and I would increase the number of shakes all within a 30 second window
  • After each test we would open Microsoft excel
    • Open the lab-view file name Test2.va
    • We then calculated the Sum of Square by simply typing “=Sumsq(range of data)”
      • Sum of square was essential to find the total variability in the set of numbers.  Although excel did the formula out for us, if we were to calculate it on our own we would need the following formula:
        • SS=E(y)^2=E(y-y)^2

The Sum of Square is also needed to square the voltage.  Each sum of square data plot represented 30 data points

We repeated the process five times; below is a graph of the data.

generator

Our findings were very consistent, simply put the more we shook the flashlight the more voltage and electricity we generated.  Just in case you can’t see the graph, you can view it better in the picture below.


(I took pictures of the experiment but could not figure out how to upload them)

The experiment overall went extremely well, my partner and I distributed the responsibilities evenly, and helped each other accomplish the daily task.


Electricity Generator

Granted that I did not know much about how electricity was generated prior to blogging about the topic I feel as if the link below is a great resource and learning tool.

http://www.youtube.com/watch?v=20Vb6hlLQSg

The link provides you with a short five-minute video, broadly explaining how electricity is generated, and problems with generating electricity.

Throughout my blog I will write about how electricity is generated from different sources. Coal, natural gas, and nuclear power plants, are going to be the main topics throughout the body of my blog.  Each topic will have a brief overview, that hopefully explains, how it works, which countries are highly dependent on that specific sector, flaws or problems with the sector, and the sectors projected future growth.

Coal

 Coal initially mined by miners in states or countries that have an abundance of coal, which is a natural resource.  The United States, and China being amongst the greatest producers.  Within the U.S. states such as Wyoming, West Virginia, and Kentucky are amongst the greatest producers.  As for how coal is transformed into electricity, I found a direct paragraph that summarizes the process.

“The coal is grinded to make it easier to deliver and burn as a fuel.  Large fans blow the coal powder into a boiler that stands 20 stories high.  The coal fuels a massive fireball that can reach 3,000 degrees Fahrenheit.  Steam pipes in the boiler carry ultra pure water that has been pumped from a nearby cooling lake and treated.  The heat of the furnace converts the water into steam. At a temperature of 1,005 degrees and a pressure of 2,400 pounds per square inch (PSI), the steam is sent over a turbine through a series of pipes.  Low pressure, intermediate pressure and high-pressure steam are used to spin the blades of three turbines at a rate of 3,600 revolutions per minute.

The turbines, connected to a generator by a shaft, power the generator.  The generator is made of a large magnet spinning inside copper windings.  Electrons flow from the copper along a conductor to create 24,000 volts of electricity. 

In order to push the electricity from the plant further out into the city, a step-up transformer is needed to increase the power from 24,000 volts to 345,000 volts to carry electricity over transmission lines to customers.” 

These steps are obviously taken after the coal has been mined and transported to a plant.

Just incase you are too lazy to read and follow the process as stated above, below is a diagram provided by Exxon Mobile depicting the process in which coal is transformed into electricity.  According to treehugger.com, China, U.S., and India are the countries that consume the largest amount of coal.

Coal-plant

The problem with coal as discussed in prior classes is the amount of CO2 released into the atmosphere.

Surprising coals consumption is projected to slow down in growing countries such as China and India.

Natural Gas

NGCC_diagram

 Is a versatile fossil fuel, meaning it can be used for various different things, such as cooking, electricity, etc.…  Some of the advantages are that natural gas burns cleanlier than coal and oil.  However, natural gas is still a fossil fuel, which contributes to global warming.

As to how it works the link below is extremely informative on the process.  The link includes flaws, strengths, and future possibilities for natural gas.

http://www.ucsusa.org/clean_energy/our-energy-choices/coal-and-other-fossil-fuels/how-natural-gas-works.html

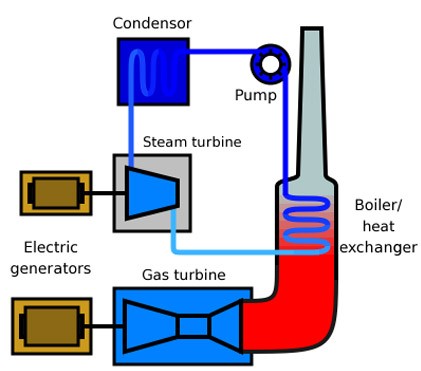
“The fastest growing use of natural gas today is for the generation of electric power”.  Natural gas is used in a plant, in order to provide heat/energy those later powers steam turbines, which provides consumers with electricity.

“Because energy produced from natural gas has much lower associated carbon emissions than these other fossil fuels, natural gas could act as a “bridge” fuel to a low-carbon energy future.  Particularly in the electric sector, natural gas has the potential to ease our transition to renewable energy”.

Some the flaws regarding natural gas are the possibility that extracting natural gas may lead to earthquakes.  Although, not proven I believe the mini earthquakes caused by hydraulic fracturing, leads to larger earthquakes.  Not to mention that although is less harmful to the environment it is still a short-term solution.

The U.S., Russia, and European Union are the three largest consumers of natural gas.

 Nuclear Power Plant

nuclear

The diagram above displays the process of how nuclear power plants actually work.  In reality all three plants (Nuclear, coal, natural gas) work very similarly.  Commonality being, heat is needed in order to turn turbines that produce energy.

The flaw with nuclear power plants is the danger of a disaster.  When things go wrong they go terribly wrong.

“On one hand, atomic energy offers a clean energy alternative that frees us from the shackles of fossil fuel dependence. On the other, it summons images of disaster: quake-ruptured Japanese power plants belching radioactive steam, the dead zone surrounding Chernobyl’s concrete sarcophagus”.

This quote does a great job describing how dangerous nuclear power plants are.  In our recent memory there are images of the devastation left behind by not only the tsunami but also the nuclear power plant in Japan.

Fukushima Daiichi nuclear disaster

http://www.pbs.org/wgbh/pages/frontline/japans-nuclear-meltdown/

The video provided in the link although lengthy is a great short documentary.  It really helps you visualize the horror possible with nuclear power plants.

Advantages of Nuclear Energy

1)   Lower Greenhouse Gas Emission

2)   Powerful and Efficient

3)   Reliable

4)   Cheap Electricity

5)   Low Fuel Cost

6)   Continuous Supply

Countries that produce the most amount of electricity from nuclear power plants are as follows:

1)   U.S.

2)   France

3)   Japan

4)   Russia

Conclusion

 It is fair to say that each individual plant has both pro’s and con’s.  As future contributors to society, it is our duty to be well informed on the matter.


References:

http://www.cpsenergy.com/Services/Generate_Deliver_Energy/Coal/coal_generation.asp

http://www.treehugger.com/clean-technology/what-are-the-top-10-coal-burning-countries-on-the-planet-whos-1.html

http://www.catf.us/fossil/problems/co2/

http://www.bloomberg.com/news/2013-12-16/coal-demand-growth-to-slow-in-next-five-years-on-china-iea-says.html

http://www.ucsusa.org/clean_energy/our-energy-choices/coal-and-other-fossil-fuels/how-natural-gas-works.html

http://www.conserve-energy-future.com/Advantages_NuclearEnergy.php

In Class Experiment

In Class Pulley Experiment

 Friday February 7th was an interesting class to say the least.  I found myself lost and did my best to avoid frustration.  Nothing seemed to work, to add to the pressure a majority of my peers including my partner were confused.  However, I managed to complete the task and learned how to explain my thoughts to my partner.  Between the both of us and assistance from the professor we pulled together and finished our objective.

During our experiment we used Newton’s 2nd law, which states:

Force=Mass * Acceleration

Initially we began by maintaining the robots force fixed at 50 (Newton’s).  We repeated this experiment three times and increased the mass each time.

1.) TRIAL #1

Force = Mass * Acceleration
50 Newton’s = .05Kg * 1000 m/s^2
50 Newton’s = .07Kg * 714.29 m/s^2
50 Newton’s = .1Kg * 500 m/s^2

If you take a look at the table below you will notice that by increasing the mass the acceleration is decreasing.  There is a direct correlation between mass and acceleration.

2.) TRIAL #2

Force Mass Acceleration
70 Newton’s .1kg 700 m/s^2
100 Newton’s .1kg 1000 m/s^2
90 Newton’s .1kg 900 m/s^2

For our second trial we maintained the mass at the same weight .1kg.  We repeated the experiment three times; each time we changed the force.  As you can see in the first column the force increased from 70 to 100 and then decreased to 90 Newton’s.  The change in force caused the acceleration to change each time.  Trial #2 proved that the greater the force the greater the acceleration (assuming Mass is constant).

3.) MGH calculations

Joules = Mass * Gravity * Height
.16 = .05kg * 9.8m/s^2 * .317meters
.22 = .07 * 9.8 * .317
.31 = .1 * 9.8 * .317
.31 = .1 * 9.8 * .317
.31 = .1 * 9,8 * .317
.31 = .1 * 9.8 * .317

Our third goal was to calculate MGH (mass*gravity*height). We first began by ensuring all the units were compatible.  After measuring the height of the pulley in inches, we converted the height of 12.5 inches into .317 meters.  We then proceeded to calculate our joules or potential energy.

What the MGH calculation proved was that as mass increased Joules increased.  We then continued to plot our information on excel.

Graph 1

Mass Acceleration
0.05

1000

0.07

714

0.1

500

Graph 1


Graph 1 displays the direct correlation between an increase in mass and decrease in acceleration.  Displaying that the heavier the mass the lower the acceleration.

Graph 2

Power Acceleration
70

700

100

1000

90

900

Graph 2

This graph depicts the correlation between power and acceleration.  The greater the power the faster the acceleration.

Germany and Renewable Energy

“He will win whose army is animated by the same spirit throughout all its ranks”.

The quote above written by Sun Tzu, famously recognized from his book Art of War, ties into why I believe Germany will be successful in establishing their country as the first to reach 100% renewable energy “as quickly as possible”.  As I read through articles online, I am continuously impressed by the dedication of the German population.

The article below listed below, depicts 3 Reasons Germans are Going Renewable ‘At All Costs’.

 http://www.renewableenergyworld.com/rea/blog/post/2013/10/3-reasons-germans-are-going-renewable-at-all-costs

To summarize, the article the key points the author describes are:

  1. “Germany has some of the highest rates per kilowatt-hour in the world”
  2. 84% of residents, support the idea of 100% renewable energy
  3. Nearly 63,000 megawatts of wind and solar power is locally owner
  4. Millions of Germans are building their retirement funds by investing in solar and wind power plants

What this article tells me is that Germany as a nation is fully committed to achieving their goal.  Which leads me to believe that they will accomplish their goal.  If you take a look at the quote I stated in the beginning of my blog, “army”, “spirit”, and “ranks” can all be interpreted to Germany’s scenario.

Army – Country / population

Spirit – Common goal

Ranks – throughout all social/economical classes

If Germany continues to work as a unit, I believe it will ultimately lead to their success.  They are setting an example of the tremendous amount of effort required by a country to benefit from sustainability in the long-term.

germany-people-powered-2012-003

This Graph represents, 100% of renewable energy market.  As you can see in the graph, individuals own 35% of the market.  Which should astonish you, companies do not have the largest part of the market share.

Although this all seems like a great fairy tale story, lets now take a moment to uncover the hardship, and difficulties Germany is trying to overcome.  As of Thursday the 30th of January, Sigmar Gabriel, Germany’s minister is trying to maintain and keep public acceptance on the matter.  “The public’s acceptance will be critical for Germany to continue expanding the use of renewable sources of energy”.

Unfortunately, the cabinet in Germany is beginning to feel the pressure and is trying to withstand the cost of initiating a movement.  According to the Wall Street Journal, “Germany is struggling with rising energy costs as it phases out nuclear power and tries to shift to more renewable energy”.

Whether Germany can overcome the most difficult task of budgeting this project will determine if Germany is capable of overcoming this obstacle.

Interesting Videos:

Kilowatt-hour – is most commonly known as a billing unit for energy delivered to consumers by electric utilities

http://rt.com/business/germany-green-energy-costs-489/

This link leads you to a video that gets into greater depth in describing the financial difficulties Germany is trying to overcome.

Germany’s Turn to a Renewable Energy Future

This link is a PBS video; although lengthy this video is extremely interesting.  It is the opposite of the video above and describes the potential Germany has, if they are to succeed with their plans.

References:

http://www.the-american-interest.com/blog/2014/01/09/end-result-of-germanys-green-energy-policy-more-coal/


http://www.dw.de/germanys-green-energy-debate-just-beginning/a-17397270

http://www.renewableenergyworld.com/rea/blog/post/2013/10/3-reasons-germans-are-going-renewable-at-all-costs


http://online.wsj.com/news/articles/SB10001424052702304632204579336220103661350


Robots Activity Blog

Robots Activities Blog

 Today was my first time using and experimenting with robots.  Quite honestly, I enjoyed the experiment and learned a lot.  Our goal was to collect data from nine different experiments.  Three experiments were conducted per set of circumstances.  My team then calculated and accounted for an error percentage.

 Error percentage was calculated with the following formula:


Error% = Distance (measured) – Distance (Lab view)

Distance (measured) + Distance (Lab view)    X 100%

2

Before I begin to explain or get into the details of our class experiment I would like to make a suggestion.  Our team had two business students and one electrical engineer.  I believe this should be the case on a weekly basis.  Having my partner completely understand the project added value to my time in class.  He answered a lot of questions and seemed comfortable with robotics.  Although I can only speak for myself, as a business student I have never conducted research in this manner.  It would be beneficial to the entire class if business students were paired with electrical engineers.


STEP 1:

  • We first took the wheel and calculated the circumference.
  • Circumference = Pi * Diameter
  • Our measurements stated that the diameter of the wheel was 5.5 cm
  • We converted it into meters .055m
  • Circumference = .55 * pi = .173

Trial 1, which I consider to be the first threes samples went as follows.  The first test we conducted allowed for 1.439 wheel turns to occur, the distance and velocity traveled was .249.  Which also indicates that the total amount of time traveled was 1 second.  Throughout the first three trials the rotation of the wheels (both left & right) were 525 degrees.  The distance it traveled during this period was 24 cm.

Learning’s:  What I learned from the first trial may sound obvious but it had honestly never occurred to me.  Both distance and velocity were .249, which meant it had only traveled one second.  In other words distance and velocity are to an extent intertwined.

After trial 1 we realized the left engine was not as powerful as the right engine because the wheel on the left was causing the robot to swerve left.

After three different tests with the same fixed variables there was surprisingly no error, each test provided the same results.

Trial 2:

The big change we had in the second trial was the degrees in which the wheels rotated.  The left wheel rotated at 504 degrees while the right wheel rotated 511 degrees.  The reason for changing the degrees was to attempt and make the robot go straight.

Overall, the distance the robot traveled was 27 cm.

  • Number of wheels turned =1.4
  • Distance = .24
  • Velocity = .24
  • Time Traveled = 1 second

After testing this trial we found an error percentage of approximately 1.5% (meters).

Learning’s:  Trial 2 presented me with the opportunity to analyze, compute, and understand how exactly we were calculating for the error %.


Trial 3:

At this point we were rushing to ensure we would have time to conduct all three samples.  During this last trial we changed the power of both wheel.  The power of the left wheel was now 87, and the right wheel was now 80.  The increase in power caused the number of wheels turned to increase to 1.67, it also increased the distance and velocity to .289, and the time remained 1 second.

Here is an example of our error %:


.295-.290

.295+.290/2   X 100% = 1.7%


We could still not manage the car to travel completely straight therefor within the last 2 minutes we conducted a last attempt to make the robot travel in a straight line.  We increased the left wheel power to .99 and the right wheel to .87.  The rotation increased to 687 and 696 degrees.  The numbers of wheels turned increased to 1.9; distance and velocity were .33.


This last attempt had an error percentage of 6.25%.  But, it was the closest we came to ensuring the car traveled in a straight line.


Learning’s:

Overall, I learned the importance of teamwork, and the importance of taking detailed notes.  Regarding the trials I learned that by increasing the power of the wheels the number of wheels turned, distance, velocity, and rotation would increase.  I believe the purpose of the class was to better understand how velocity works, and how it relates to distance.


Sandy

Super Storm Sandy

Sandy was a super storm that devastated the northeast region of the United States.  This blog will begin by introducing Sandy, it will then follow by stating facts about the storm, whether climate change is the cause of the storm, and finally my humble opinion on the matter.

“Hurricane Sandy, a late-season post-tropical cyclone, swept through the Caribbean and up the East Coast of the United States in late October 2012. The storm left dozens dead, thousands homeless and millions without power. Total damage is expected to be in the billions of dollars.”  Being that I was born and raised in Massachusetts, I have family that resides in areas affected by Sandy.  Therefore, the research I have conducted was of great interest to me.  As I read Superstorm Sandy: Facts about the Frankenstorm , written by Tim Sharp on November 27, 2012, I was amazed at some of the statistics.

Statistics:

  • 149 Deaths
  • Deaths in New York, New Jersey, Maryland, Pennsylvania, West Virginia, Connecticut, Virginia, North Carolina, Canada, Caribbean, and Haiti.
  • $20 Billion in property damage
  • $30 Billion in lost business

Because of how recent the storm is we should all still have memories of how the media covered it, and the magnitude of the storm.  The stats above truly are representative of how large, vast, and mighty Sandy truly was.  Many Americans are still recovering their loses; not to mention the families of the victims of the storm.

storm


The picture above is depicts Sandy as she begins to gain strength and head towards the northeast coast of the United States.

There are many scientists who believe there is a direct correlation between global warming/climate change and storms such as Sandy.  Mark Fischetti a well-respected blogger/scientist wrote an article expressing his opinion on the matter.  Did Climate Change Cause Hurricane Sandy?  Expresses Mark’s opinion on the matter.  “Here’s where climate change comes in. The atmospheric pattern that sent the Jet Stream south is colloquially known as a “blocking high”—a big pressure center stuck over the very northern Atlantic Ocean and southern Arctic Ocean. And what led to that? A climate phenomenon called the North Atlantic Oscillation (NAO)—essentially, the state of atmospheric pressure in that region”.  What scientist seem to be putting together are variables caused by the climate change, that contribute to the strength of storms.

For example:

  • Oceans have warmed,  which directly contributes to the energy source from which storms such as Sandy strengthen.
  • Our warmer atmosphere is retaining more moisture, the moisture is then drawn into more frequent and large storms.

What I found interesting about this article is the facts presented in regards to insurance agencies.  Insurance agencies are beginning to take into account climate change.

According to the press release that accompanied the report, “Nowhere in the world is the rising number of natural catastrophes more evident than in North America.” … While many factors have contributed to this trend, including an increase in the number of people living in flood-prone areas, the report identified global warming as one of the major culprits: “Climate change particularly affects formation of heat-waves, droughts, intense precipitation events, and in the long run most probably also tropical cyclone intensity.”

graphAs you can view in the graph above, there is a direct correlation between extreme climate and natural disasters.  This graph helps add to the credibility of the scientist who believe global warming is having a negative impact on our planet.  Information on how much of an impact climate change is having on storms is still up for debate.  Scientists are still trying to prove their theory.  Although difficult, I believe in the near future there will be concrete evidence supporting their theory.

Below is a list of videos you can watch to understand the severity of Sandy.

  1. http://www.weather.com/video/2012-superstorm-sandy-33440
  2. http://www.youtube.com/watch?v=ady9mc7fdTU
  3. http://www.cbsnews.com/news/dire-forecast-as-hurricane-sandy-approaches/

Sources:

http://www.livescience.com/24380-hurricane-sandy-status-data.html

http://blogs.scientificamerican.com/observations/2012/10/30/did-climate-change-cause-hurricane-sandy/

http://usnews.nbcnews.com/_news/2013/10/29/21215983-superstorm-sandy-anniversary-one-year-later-thousands-still-not-home?lite


LEGO + Education

LEGO MINDSTORMS

I would like to begin my blog by apologizing to my classmates for not attending last week’s class.  This blog will be a descriptive summary of LEGO as a company, LEGO Robotics as a product, and the capabilities of robotics integrated with education.

 Founded in 1932 by Ole Kirk Kristiansen, the family owned business is now in the hands of the founder’s grandchild.  Their products have thus far passed the test of time.  LEGO brick is what most of their customers are familiar with and is the reason LEGO has been named twice – “Toy of the Century”.   LEGO employees strongly believe in their product:

The interlocking principle with its tubes makes it unique, and offers unlimited building possibilities.  It’s just a matter of getting the imagination going and letting a wealth of creative ideas emerge through play”.

The thought of creative ideas emerging through play sinks well with me.  I am sure a majority of us at one point let our imagination run wild while playing with LEGO blocks.

Before I begin explaining LEGO Robotics, I would like to share this information with you guys.  In class we have discussed sustainability, “going green”, and the green house effect, LEGO has an entire page filled with Sustainability Cases;Cases that represent recent actions they have taken to help improve, and raise awareness of the ongoing global warming problem.

Sustainability%20Cases

LEGO Robotics – “LEGO Mindstorms is a line of Lego Group products combining programmable bricks with electric motors, sensors, Lego bricks, and Lego Technic pieces (such as gears, axles, beams, and pneumatic parts) to build robots and other automated or interactive systems”


images


The picture above is the packaging in which LEGO Mindstorms is sold.  To the left of the package is a book on many functions or possibilities for the robot.

To summarize, LEGO Robotics is a tool that can be used by professors in order to explain engineering and inspire students.  LEGO has gone as far as providing teachers with guides on how to most effectively use their products.  LEGO provides a hand -book describing:

  • What purposes might Robotics serve in the classroom?
  • For what grade levels is Robotics Appropriate?
  • Who can teach Lego Robotics?
  • Why are Robotics activities satisfying?
  • What are the instructional goals and advantages of LEGO Robotics?

LEGO hopes to capture the interest of students by assuring students are asking themselves: “What type of robot will I create? What will I make it do? How will I design and program it to retrieve a ball?”

As for LEGO and learning, I believe LEGO sparks the interest in students to continue and pursue an engineering path.  The product in the classroom initially intrigues students.  Students then continue to pursue their interest outside of the classroom.  There are social media channels solely dedicated to LEGO.  Enthusiasts depend on each other to continue and grow their knowledge base.

Please watch some of the videos below.

LEGO Enthusiasts:

The link I provide above is a funny TED talk describing how LEGO becomes almost a lifestyle.

http://www.youtube.com/watch?v=jLpBLPQNkz4

The Link above is a first look at how passionate LEGO enthusiasts are.  A young male describes his passion for LEGO.

http://www.youtube.com/watch?v=8IxF5q7NdWE

The link above gives a glimpse of a LEGO convention.

http://www.youtube.com/watch?v=HBf1BIdJT4Q

I found this  youtube link extremely interesting because the enthusiast is a 5-7 year old boy.  He is explaining his current project and I am impressed with his ability to explain what he has learned.

http://www.youtube.com/watch?v=Q61NdisQj0A&list=PLAwVqAfcVZAa2Rex6w86n3C-dc4atJCTZ

Finally, if you’d like to see how much time and creativity LEGOs can consume and nurture please watch this short LEGO movie.

In conclusion, I believe LEGOs role in education will continue to expand in the future.  If you take a look at the last link under REFERENCES you will find a very useful LEGO learning tool.  This tool in form of a “quiz”, that can help test what you may know about LEGO.

REFERENCES:

http://aboutus.lego.com/en-us/lego-group/the_lego_history

Sustainability%20Cases

http://quizlet.com/1291285/lego-robotics-flash-cards/

Energy Grid Blog #1

It is without a doubt that the need for energy is now greater than ever.  The demand for energy is growing on a daily basis, as countries continue to develop and global population continues to increase our understanding of the “Grid” should grow.  By the end of this blog you should clearly be able to understand what the Energy Grid is, how the infrastructure works, and pros/cons involved.

During our class discussion I was astonished when I was told it took 10^15 BTU to run the global economy.  On top of the already ridiculous demand, demand continues to grow by 2% every year as the appetite countries continue to develop.  Without getting into the global demand lets take a look at how the grid works.

Please click on the link below and take a minute to watch the video.  Thank you!

http://www.youtube.com/watch?v=1dZjohZPIqE#t=128

Lets now try and recap what we just learned by watching the video.  The Grid lives in the now, meaning it continuously adjusts to the demand.  Although our households do not consume a ton of electricity, in order for electricity to travel long distances high voltage is required (230,000 – 250,000 volts).


blog 1Key points:

  • 3 main interconnections (Western interconnection, Eastern Interconnection, and Texas Interconnection)
  • Nikola Tesla discovery ALTERNATING CURRENT helps make the grid possible
  • Transformers are the key to lower the voltages

2

For class purposes we will disregard any opinion presented towards the end of the video.

Know that we understand the infrastructure of the energy grid and how it works lets try and understand both the pros and cons of our current infrastructure.  I would love to hear your opinion concerning this matter, please feel free to comment and discuss.  First lets list some of the known commodities the grid currently presents us with.

After researching the pros and cons I found that it’s fairly difficult to find detailed pros.  It seems like we have used the system for so long that the only real benefit it provides us with is comfort.  Americans do not really worry or are informed on how the grid works.  We know it’s there and it’s reliable, besides the reliability and comfort we have no economic benefit.  The cons clearly outweigh the pros.

“A typical coal-fired electrical plant might be 38% efficient, so a little more than one-third of the chemical energy content of the fuel is ultimately converted to usable electricity. In other words, as much as 62% of the original energy fails to find its way to the electrical grid. Once electricity leaves the plant, further losses occur during delivery. Finally, it reaches an incandescent light bulb where it heats a thin wire filament until the metal glows, wasting still more energy as heat. The resulting light contains only about 2% of the energy content of the coal used to produce it. Swap that bulb for a compact fluorescent and the efficiency rises to around 5% – better, but still a small fraction of the original”.

3 Our grid is very inefficient, partly because the equipment is outdated.  It’s easy to suggest an update of equipment but the cost of upgrading the grid is enormous.

The con that stood out the most is the inefficiency; I would not care for old equipment if the grid were as efficient as currently possible.  That is not the case there are many brilliant ideas that I believe will help improve our energy grid.

Luckily there are companies currently working on improving our grid.  National Grid has a vision to “ to deploy Smart Grid technology in order to optimize the flow of green energy resources, enhance the performance of the electric distribution grid, and provide customers with the ability to make informed decisions about how they use energy”.

I believe the Smart Grid is the future!

References:

http://energy.gov/articles/top-9-things-you-didnt-know-about-americas-power-grid

http://www.nationalgridus.com/energy/

http://www.nap.edu/reports/energy/sources.html