Iceland’s Geothermal Energy

Iceland and Geothermal Energy

Iceland is a geologically young country that is home to more than 200 volcanoes. Though it is one of the most techtonically active places on earth and has frequent earthquakes, rarely are these damaging. See the map of Iceland’s geothermal fields.

geothermal-fields

Generating Electricity

There are currently 7 geothermal locations from which electricity is being generated in Iceland. Three of these locations, Bjarnarflag, Svartsengi, and Krafla, have been online and producing energy since the 1970s and 1980s. It was not until 1997 that Nesjavallir was brought online, and this effectively doubled the amount of geothermal electricity Iceland was generating. The more recent addition of 3 other locations has increased the amount of geothermal electricity being generated in Iceland from just less than 500 GWh/year in 1997 to over 5,000 GWh/year in 2012.

Iceland_Geothermal_facility
This is a picture of the Svartsengi geothermal power station.

Generating Heat

Space Heating

A main use of geothermal energy for heat in Iceland is for space heating. Currently, households of 89% of the Iceland population are heated using geothermal energy. Although this represents a dramatic increase in the share of heating energy from geothermal heat since the 1970s, the rate keeps increasing, and Iceland is expecting to increase it to at least 92%. Heat pumps, which pump the heat one location to another, have not needed to be used in Iceland, since sufficient cheap geothermal water for space heating is commonly available.
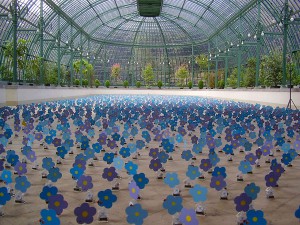
Heating Greenhouses
Screen Shot 2016-02-28 at 8.56.27 PM
This picture shows a greenhouse in Hveragerdi, Iceland.

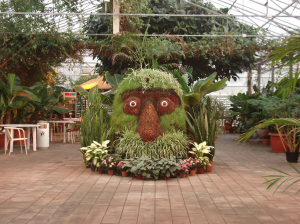
Even though space heating is important, in Iceland, another important use of geothermal heat is to heat greenhouses. Geothermal heating of greenhouses started in 1924, and the naturally heated soil grows potatoes and vegetables. Geothermal steam is used to boil and disinfect the soil.

Conclusion

Iceland is lucky to have so much geothermal energy available, and it is doing its best to use it for generating electricity and heat. The Icelanders are trying to get the most out of their available geothermal energy by building many power stations and using the energy to power both industry and households.

Thermoelectric Devices: What They Are & Examples

What is a thermoelectric device?

A thermoelectric device creates voltage when there is a different temperature on each side. The thermoelectric effect is the direct conversion of temperature differences to electric power and vice-versa. When temperature differences are converted directly into electricity, this is called the Seebeck Effect.

A thermoelectric generator

One common thermoelectric device is a thermoelectric generator.

Thermoelectric

In this setup, there is a heat source on one side, and the other side is cool (see figure).  If a heat source is provided, it causes the movement of power current through the circuit. Hot carriers diffuse the hot end to the cool end and vice versa. Adding the heat source and allowing for this movement to begin causes the generation of electricity.


Example of a Thermoelectric Device – a Thermocouple


A thermocouple is a couple of metals that are joined together, or coupled, for measuring heat. Thermocouples are widely used in science and industry because they’re typically very accurate and can operate over a large range of temperatures from extreme hot to extreme cold. Metals used in thermocouples include iron, nickel, copper, chromium, aluminum, platinum, rhodium and their alloys.

Different Applications of Thermoelectric Devices

Thermoelectric devices are used in larger machines as part of power generation. A great example of this is a diesel engine. The Thermoelectric Project in Maine aims to “recover waste heat from large marine Diesel engines using Thermoelectric technology.” Initial research was done using Maine Maritime’s vessel Friendship during an initial feasibility study. Their “green machine” works to recover energy.

The Green Machine

Another application is Seiko’s Thermic watch, which uses body heat to power its thermoelectric device.

Seiko_Thermic

Only 500 of these were made, and this was back in 1998. They cost over $2,500 when they were available.

Conclusion

Thermoelectric devices are a way of converting temperature to energy. Thermoelectric devices are commonly used in diesel engines, but have a lot of other uses. The Thermoelectric Project in Maine and the Seiko watch are some examples of creative uses of thermoelectric power.

Solar Experiment

Goal of Class Activity

The goal of this class activity was to look how light intensity affects voltage on a solar cell, and how color filters will affect the voltage on a solar cell.

The Experiment

In this experiment, there was a solar cell hooked up to to a monitor that recorded the level of voltage coming to the cell. This experiment was to see if shining a flashlight on the solar cell affects the voltage, and also, if using colored filters between the light and the solar cell affects the voltage.

Introduction

In this study, we looked at two conditions. In the first condition, which was light intensity, we collected data through five trials. In the second condition, which was colored filters on the light, we collected four measurements.

Methods

To conduct the experiment, we first made sure the solar cell was working and that voltage was being recorded. Next, we took a flashlight and shined it on the solar cell for 10 seconds from a distance of 0 cm, and took a measurement. Each voltage measurement was actually 10 measurements, which we averaged into one measurement. Next, we moved the flashlight to 4 cm away from the solar cell for 10 seconds, and recorded the voltage. We also recorded voltage for the flashlight being at the following distances from the solar cell: 8 cm, 12 cm, and 16 cm.

Next, we obtained four colored filters, one in purple, one in pink, one in yellow, and one in red. First, we fixed the purple filter to the flashlight, and then shined it on the solar cell at a distance of 0 cm for 10 seconds, and recorded the voltage. We repeated this process using the yellow filter, the pink filter, and the red filter.

Sample Calculation

As described above, for each voltage measurement, there were actually 10 measurements, and these were averaged together. We didn’t keep the original 10 measurements, but for example, for the first condition at 0 cm, the average voltage was 0.469.

Results

First, here is the table of results from the first condition:

Screen Shot 2016-02-23 at 4.24.11 PM

As can be seen by the table, data were gathered at distances of 0, 4, 8, 12, and 16 cm. The resulting voltage was plotted on the y-axis against the distance in cm, which was plotted on the x-axis (see below).

Screen Shot 2016-02-23 at 4.53.50 PM

There was a negative correlation between distance and voltage, meaning that the further away the light source was, the lower the voltage was.

Next, data were collected about the voltage output at 0 cm distance using four different color filters over the light source. The table below shows the results.

As can be seen by the table, the lighter colors yellow and pink were associated with higher voltage, and the darker colors purple and red were associated with lower voltage. This may be more apparent in the chart below.

Screen Shot 2016-02-23 at 4.23.50 PM

Conclusion

In conclusion, as the light source was moved away from the solar cell, the voltage went down. Also, as darker colored filters were placed on the light source, the voltage went down. For solar energy, it is best to have either no filters or light-colored filters on the light source, and to have the light source be as close as possible to the solar cell.

Generator Experiment

Goal of Class Activity

The goal of the class activity was to demonstrate Faraday’s Law that states that changing magnetic fluxes through coiled wires generate electricity, which refers to currents and voltage.

The Experiment

To demonstrate Faraday’s Law, we were given a tube with a magnet in it. When the tube is shaken, the magnet travels back and forth through a coil of wires. Theoretically, the faster the tube is shaken, the more voltage should be generated.

Introduction

In this experiment, we used a tube that connected to the computer. When we shook the tube, the computer registered the sum of squares of the voltage.

Methods

We did 5 trials, 30 seconds each, of shaking the tube. The number of shakes in each 30 second interval were recorded as the independent variable. Each time the tube was shook, it produced a voltage measurement. For each 30-second trial, the voltage measurements were squared, then summed (voltage sum of squares), and this was the dependent variable. The results of the 5 trials were plotted on a scatter plot with a trend line.

Sample Calculation

For the first trial, the tube was shaken 75 times. Each time it was shaken, a number was recorded. Each number was squared, then all these numbers were summed. The result was 5.43 sum of square voltage.

Results

Below are the results from the 5 trials:

Screen Shot 2016-02-18 at 12.01.02 AM

The following is a scatter plot of the above numbers with a trend line:

Screen Shot 2016-02-17 at 11.44.03 PM

Conclusion

Although Faraday’s Law says that the more shakes should have generated more voltage, this was not the case in the data we collected. This is likely due to measurement error. For example, for the fourth and fifth trials, the number of shakes was almost the same, but the voltage was twice as high in the fourth trial as the fifth trial.

Current Work Using Nikola Tesla’s Free Energy Ideas

Introduction

Nikola Tesla was an inventor in the late 1800s who developed a way to produce wireless energy using a coil he designed. Although the Tesla Coil does not appear to have a current use, a new group called Fix the World Project is promoting developing Tesla Coils to create free energy in underdeveloped countries. This blog post will review Tesla’s invention, and will describe a modern effort to use Tesla’s coil as part of a free energy project.

Nikola Tesla’s Work in Wireless Energy and Power Transfer

Nikola Tesla was a scientist and inventor known for his patents and grand ideas about bringing the world “free energy”. The invention that was to produce wireless energy is called the Tesla Coil. It was impressive that he invented this in 1891, before traditional iron-core transformers were invented. It is made of a primary and a secondary coil, and each has its own “capacitor”, or energy storage. The primary coil is hooked up to an energy source. The wireless energy is developed when the primary coil’s capacitor soaks up energy like a sponge until it is full, then discharges this energy. This appears to be a zap between the coils, and produces so much energy it can light up a light bulb.

The trick with the Tesla Coil is to time the energy transfer from the first coil to the second coil at the perfect time, so as to maximize the energy transfer. However, in reality, the Tesla Coil does not have any current applications, although a version of it is used in radios and televisions.

Modern Tesla Free Energy Devices

Even though the Tesla Coil must be hooked up to a power supply, theoretically, the Tesla Coil could be very efficient and sustain much energy development for little input. Therefore, it has been referred to as “free energy”, although it is acknowledged that it is not entirely free, because some equipment and a power supply is needed.

Modern efforts to use the Tesla Coil have culminated into the humanitarian movement called the “Fix the World Project“. Their mission is to “focus on projects dealing with energy access, economic hardship, and basic humanitarian aid”. The video below shows examples of their charity work.

They are promoting a book on their web site that shows how to build a quantum energy generator. This group even built one, and they put a video on the web of how it was working.

Current Controversy About Tesla’s Device

Even though this video is impressive, there are detractors. RealitiesWatch pointed out that the device in this video might have been a hoax. They explain it well with this labeled picture.

QEG

RealitiesWatch pointed pointed out that it looks like this machine was actually plugged into electrical current during the demo. Critics say this whole design is a fraud, and the organization is not a charity, but is raising money by asking inventors to pay them fees for consultation.

Conclusion

In conclusion, although Tesla’s idea of free energy is attractive, his invention was never used. This appealing idea is getting more attention now, in light of energy conservation issues. Although the Fix the World Project is promoting the use of the Tesla Coil to solve world energy problems, many feel that they are a hoax, and their efforts are self-serving.

Functionality and Aesthetics of Solar Energy in Different Countries

Introduction

Solar energy has been promoted as an alternative to the less clean energy associated with fossil fuels. Specifically, countries looking to reform their energy efforts to be more eco-friendly are looking to solar energy. This blog post will describe the purpose of these efforts, and describe initiatives in both China and Europe that have been put in place to expand solar energy’s use in these countries.

Purpose of Solar Energy Efforts

Countries that have relied on fossil fuels historically are now running into problems with the sustainability of their energy systems. Solar energy efforts have been implemented by different countries to address this. Solar energy is a great alternative for many reasons. Solar energy is renewable, green, eco-friendly, low voltage, and available anywhere. These characteristics make it attractive to countries that may have a lack of resources, or be struggling with pollution from other energy sources. This blog post will describe a few solar energy efforts done by countries to leverage the advantages of solar energy.

Efforts in China

China is a large country with a large pollution problem, as it is the world’s biggest carbon emitter. In response, China’s National Development and Reform Commission made a goal of tripling China’s solar panel installed capacity to 70 gigawatts by 2017. As part of this plan, China will also increase its reliance on wind and hydro power. This is part of China’s larger goal, which is to increase the energy it consumes from non-fossil fuels to 13% of its total consumed energy.

Solar power efforts in China are mainly part of a bigger picture in energy reform. China has had to declare war on smog, so solar power offers one of many alternatives to burning fossil fuels. China has set goals to increase nuclear power use as well, and expects it will meet its new solar target by 2017.

Efforts in Europe

In Europe, many different solar efforts are being implemented by various governments, and some private-public partnerships have developed. Here, I will describe two specific solar efforts, one that has been used in several European countries, and one that is more specific to France.

Solar Flowers

Solar Solidarity International is a group that developed “solar flowers”, and a program to put them throughout Europe and test their usefulness. These solar flowers double as art designed by Alexandre Dang and mini dancing solar energy collectors.

belgium2

These solar flowers dance when collecting sun. Their purpose was not only to raise awareness throughout Europe about solar energy, but also, to raise funding to support solar electrification projects in the developing world. This group has done over 40 exhibitions throughout Europe, and sold over 10,000 flowers. The main exhibitions were in Belgium, which were at the European Commission, the European Parliament, and at the Council of the EU. There were also exhibitions in Barcelona, Valencia, and Tenerife in Spain; in Milan, Italy; in Essen, Germany; and in Chambray, France. Proceeds collected from funding went to solar electrification of schools in Burkina Faso, Senegal, Haiti and Nepal.

Roof Tiles

France has emphasized using solar panels specifically called Building Integrated Photovoltaics (BIPV), which can integrate easily into a building. The example that has been emphasized in France are solar shingles. Unlike typical solar panels, solar shingles are specifically designed not only to collect solar energy, but to protect the roof, and are extremely durable for this purpose and can withstand the weather. They are also smaller, more lightweight, and easier to install, and that makes them more accessible to the average person.

solar-shingles2

Although France has emphasized using these solar panels, growth in their interest has slowed. According to the European Photovoltaics Industry Association, there has been a lack of political support for this due to attacks from the nuclear and fossil fuel industries.

The video below shows a case study of installing BIPVs.

Conclusion

In conclusion, countries now have a lot of attractive and creative alternatives to turn to when selecting solar energy products. Hopefully, governments in these countries will continue to promote energy reform programs that encourage the use of solar power.


Robotic Blog on Newton’s Law

Goal of Class Activity

The goal of the class activity was to study Newton’s Second Law of force and motion. Newton’s Second Law recognizes that there is a relationship between mass and acceleration, and that the product of mass and acceleration is force.

The Experiment

The experiment was to demonstrate a proof of Newton’s Second Law. This was done by fixing force, and then varying mass and acceleration, and then fixing mass, and varying force and acceleration.

Introduction

For this experiment, we used the Lego Mindstorm motor. This apparatus has a pulley on which weights can be attached, and it is hooked up to a computer that can record measurements. In this experiment, we tried using different weights to represent varying mass, and we used the computer to manipulate the force on the pulley so we could vary force.

Methods

First, we did an experiment varying mass, but keeping force constant, and seeing the effect on acceleration. We kept the force at 75, and tried masses at the following weights: 0.10, 0.08, 0.06, 0.04, and 0.02 KG. Then we calculated the acceleration (RPM/S). Finally, after measuring the height in meters, which was 0.37, we calculated potential energy by multiplying mass by acceleration by height.

Next, we varied force, but kept mass constant at 0.18 KG. Force was set at 30, 40, 50, 60, and 75, and acceleration was calculated. Again, we calculated potential energy by multiplying mass by acceleration by height. Finally, we made charts to visualize the relationship between acceleration, force, and mass.

Sample Calculation

For the first part of the experiment, a sample calculation is given here.  This is where force was set at 75, and mass was varied. In one case, mass was set at 0.10 KG, so for this case, the calculation of acceleration was done by the computer, which was 14.25. Then, potential energy was calculated to be 0.10 * 14.25 * 0.37 (height) = 0.63.

For the second part of the experiment, a sample calculation is given here. This is where mass was set at 0.18 KG, and force was varied. At the force of 75, the acceleration was calculated by the computer to be 33.10. Next, potential energy was calculated to be 0.18 * 33.10 * 0.37 = 2.20.

Results

First, I will report the results of the first part of the experiment, where force was fixed at 75. Below is the data table:

These data are charted in the figure below.

As can be seen by the figure, at low levels of mass, acceleration was high. This means that there was a strong, negative correlation between acceleration and mass at a fixed level of force.

Next, I will report the results of the second part of the experiment, where mass was fixed at 0.18 KG.

These data are charted in the figure below.

With mass fixed, as force increased, acceleration increased.  There was a strong, positive relationship between acceleration and force.

Conclusion

This experiment was a successful proof of Newton’s Second Law of Motion. It demonstrated the relationship between mass, force, and acceleration.

SpaceX Corporation

Introduction

The SpaceX corporation does space exploration and has rocket scientists. It is led by the famous businessman Elon Musk, has several high-profile goals having to do with space exploration, and has built a lot of advanced technology. They use the concepts of gravity, velocity, and kinetic energy in their designs. This blog post will describe SpaceX’s technology and goals, discuss their use of the energy and force concepts of gravity, velocity, and kinetic energy, and provide an analysis of these ideas.

SpaceX’s Goals and Technology

SpaceX has several space-related goals, but a particularly important and interesting one is that they want to set up life on Mars. In this short video, Elon Musk and others who work at SpaceX are interviewed about being part of this effort to bring life to Mars.

As described in the video, the first step is to figure out how to create an atmosphere on Mars that humans can live in. SpaceX is planning to put greenhouse gasses on Mars to neutralize the environment, and make it warm enough to live in for humans. Also, they discuss the issue of bringing people there in the first place. All the employees seem very proud to be working on such high level technology.

In addition to setting up life on Mars, SpaceX is working on perfecting transportation back and forth through space by way of their Dragon and Falcon 9 spaceships. Not only do they want to perfect using these vessels as “cargo ships” that can bring supplies back and forth to the International Space Station (ISS), but they also want to become a “space taxi” for astronauts.

SpaceX’s use of Energy and Force Concepts

On SpaceX’s web site, one of their posts describes specifically the energy and force concepts behind the Falcon 9. First, they provide an in-depth description of gravity and how it works in space. They explain that gravity is the reason that “escape velocity” is needed to escape the Earth’s orbit. They also explain how gravity extends into the universe, and even though a spaceship may not be in the Earth’s atmosphere, it still is subject to gravity.

Next, they explain the importance of velocity relative to gravity. They point out that it seems that the astronauts who are on the space station are in “zero gravity” because they are floating around. They say:

This is because they are actually moving around Earth’s gravity funnel at the blistering speed of 27,000 km/h (17,000 mph), completing a round-the-world trip every 90 minutes!

They explain that the reason for this is that there is no net acceleration for these individuals, so they appear to be standing still.

Finally, they discuss the importance of the force of kinetic energy. Kinetic energy is the energy of motion, and is defined as mass times volume. SpaceX describes the challenge of having to cause a 125 metric ton Falcon 9 rocket accelerate to 8000 km/h and land on an ocean platform, or to accelerate to 5000 km/h and land back at the launch site.

What’s Next for SpaceX?

I believe that the work that is being done by SpaceX is important work, and should be completed. It is important to continuously build on our knowledge of space, and internationally, there are very few institutions dedicated to this research. It was good that NASA led this effort in the beginning, but NASA is part of the government, so this creates a limitation. The limitations associated with government do not apply to the private sector, so SpaceX has had the flexibility to be more creative. This could be a good thing as we go forward, because the limitation of government might get in the way of innovation.

Conclusion

In conclusion, SpaceX has several goals, but their main focus is on developing the ability to live on Mars, and further developing Dragon and Falcon 9, their spaceships, into cargo ships and space taxis. They discuss on their web page the important forces of gravity, velocity, and kinetic energy, and how they relate to their technology. In my analysis, it is good that SpaceX is a private company, because that allows it to be more creative and innovative than a governmental agency.

Image of spaceship from Pixabay.


Robotic Activity Experiment

Goal of Class Activity

The goal of the class activity was to compare manual measurements with measurements taken digitally to see the rate of errors.

The Experiment

Introduction

We had a Lego car with a sensor in the wheel. We used a program to visualize what the sensor was recording as the car went along. Tufts University Center for Engineering Education and Outreach posted an example of the apparatus we used, and there is a picture below.

Screen Shot 2016-01-31 at 8.27.09 PM

Methods

The computer program was called a virtual interface, or VI. We first had to measure the wheel manually and compute its circumference. Then, we ran the VI and recorded the results. The VI digitally recorded measurements of the wheel rotation (number of turns) and degrees, the time it took for the wheel to turn (in seconds and milliseconds), and the distance the car moved.

Next, we measured the same items with a ruler (manually). We did this experiment a t0tal of 9 times and looked at the discrepancies between digital and manual measurements.

Sample Calculation

The error was calculated by comparing distances measured between the VI and the manual measurement. The formula for error used was [(VI-M)/((VI+M)/2)] * 100 where VI is the VI measurement, and M is the manual measurement.

Results

The results for 9 trials are below.

Screen Shot 2016-01-31 at 9.11.02 PM

Conclusion

There was more error than I expected between the VI and the manual measurement. This is similar to the real-life situation I blogged about, where California’s electrical grid started using new digital meters, but they were found to be inaccurate.

New Smart Grid Technology

First, there’s the grid – and then, there’s the “smart grid”. What are these, and what is the significance of the “smart grid”? I will explain the grid and the “smart grid” below, and then talk about some pros and cons of the smart grid.

What is the Grid and the “Smart Grid”?

In order to understand the “smart grid”, it is first necessary to understand what the grid is. The term “the grid” refers to the electrical system in the United States. This is the network of transmission lines, substations, transformers and other components that stretch across the United States to deliver electricity locally. The grid was started in the 1890s, so parts of it are very old. Even so, today, there are more than 9,200 electric generating units involved, with more than 1 million megawatts of generating capacity. The network is connected with over 300,000 miles of transmission lines.

The “smart grid” refers to an upgrade of the existing grid, where it is made smart the way a smart phone is smart. This involves adding sensors that can transmit information from the grid digitally back to humans, who can use the information to improve energy usage and efficiency. It can cause a two-way communication between the utility and the customer. Examples of potential uses of smart technology in the grid include improving security, reducing peak demand, and quicker restoration of electricity after an outage.

Advantages of the Smart Grid

Even though the federal government supports the smart grid, not all states have adopted it. However, California is ahead, and already has smart technology in place. California residents who use Pacific Gas and Electric (PG&E) have smart technology advantages. They can log in online and look at visualizations of their electrical usage. They can also program alerts to come by e-mail or text if they are using high amounts of energy.

Disadvantages of the Smart Grid

California may sound like the perfect place for smart technology, but it does have its disadvantages. According to the San Francisco Chronicle, smart meters were installed in some houses, but residents are questioning whether they are working properly. They complained that their utility bills soared after the meters were installed. Therefore, they had to halt the program until they could finish the investigation into why this was happening.

Even though smart technology sounds like a good idea, we are just at the beginning, and it looks like we have a long way to go!