Goal of Class Activity
The goal of this class activity was to look how light intensity affects voltage on a solar cell, and how color filters will affect the voltage on a solar cell.
The Experiment
In this experiment, there was a solar cell hooked up to to a monitor that recorded the level of voltage coming to the cell. This experiment was to see if shining a flashlight on the solar cell affects the voltage, and also, if using colored filters between the light and the solar cell affects the voltage.
Introduction
In this study, we looked at two conditions. In the first condition, which was light intensity, we collected data through five trials. In the second condition, which was colored filters on the light, we collected four measurements.
Methods
To conduct the experiment, we first made sure the solar cell was working and that voltage was being recorded. Next, we took a flashlight and shined it on the solar cell for 10 seconds from a distance of 0 cm, and took a measurement. Each voltage measurement was actually 10 measurements, which we averaged into one measurement. Next, we moved the flashlight to 4 cm away from the solar cell for 10 seconds, and recorded the voltage. We also recorded voltage for the flashlight being at the following distances from the solar cell: 8 cm, 12 cm, and 16 cm.
Next, we obtained four colored filters, one in purple, one in pink, one in yellow, and one in red. First, we fixed the purple filter to the flashlight, and then shined it on the solar cell at a distance of 0 cm for 10 seconds, and recorded the voltage. We repeated this process using the yellow filter, the pink filter, and the red filter.
Sample Calculation
As described above, for each voltage measurement, there were actually 10 measurements, and these were averaged together. We didn’t keep the original 10 measurements, but for example, for the first condition at 0 cm, the average voltage was 0.469.
Results
First, here is the table of results from the first condition:
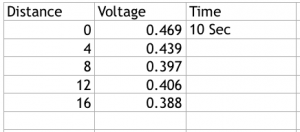
As can be seen by the table, data were gathered at distances of 0, 4, 8, 12, and 16 cm. The resulting voltage was plotted on the y-axis against the distance in cm, which was plotted on the x-axis (see below).
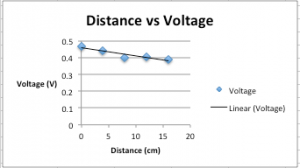
There was a negative correlation between distance and voltage, meaning that the further away the light source was, the lower the voltage was.
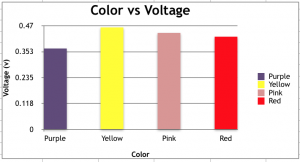
Next, data were collected about the voltage output at 0 cm distance using four different color filters over the light source. The table below shows the results.

As can be seen by the table, the lighter colors yellow and pink were associated with higher voltage, and the darker colors purple and red were associated with lower voltage. This may be more apparent in the chart below.
Conclusion
In conclusion, as the light source was moved away from the solar cell, the voltage went down. Also, as darker colored filters were placed on the light source, the voltage went down. For solar energy, it is best to have either no filters or light-colored filters on the light source, and to have the light source be as close as possible to the solar cell.
Your blog about the experiment is just so detailed, and the chart you have with colors is really awesome. Hopefully I visited your blog, which I think it helps me a lot.
I love how you inserted the graphs and tables into your submission. Also, I noted that you had different color strips than we did, and you measured your light in the color experiment from a different distance.