Fukushima

On March 11, 2011, the second largest nuclear meltdown in world history occurred on the east coast of Japan.  In 1986, the world was faced with it’s first nuclear disaster: Chernobyl in the Ukraine.  In the wake of this disaster, many world citizens thought that this was going to be the next Chernobyl: that the surrounding communities would be permanently evacuated, major health problems for years to come, mass loss of life (both human, animal, and plant), etc.  The Fukushima Daiichi disaster is only the second nuclear disaster to ever reach the International Nuclear Event Scale’s level 7.

What some people don’t realize is that this nuclear meltdown was not initially caused because of sloppy work or lack of precautions, but instead by a 9.0 magnitude earthquake that occurred in Japan, followed by a tsunami resulting from said earthquake.  Japan is located in “The Ring of Fire,” which is a horseshoe shaped ring of underwater/above ground volcanoes that is extremely active.  This “Ring of Fire” extends into the US too, sweeping up Hawaii with it.

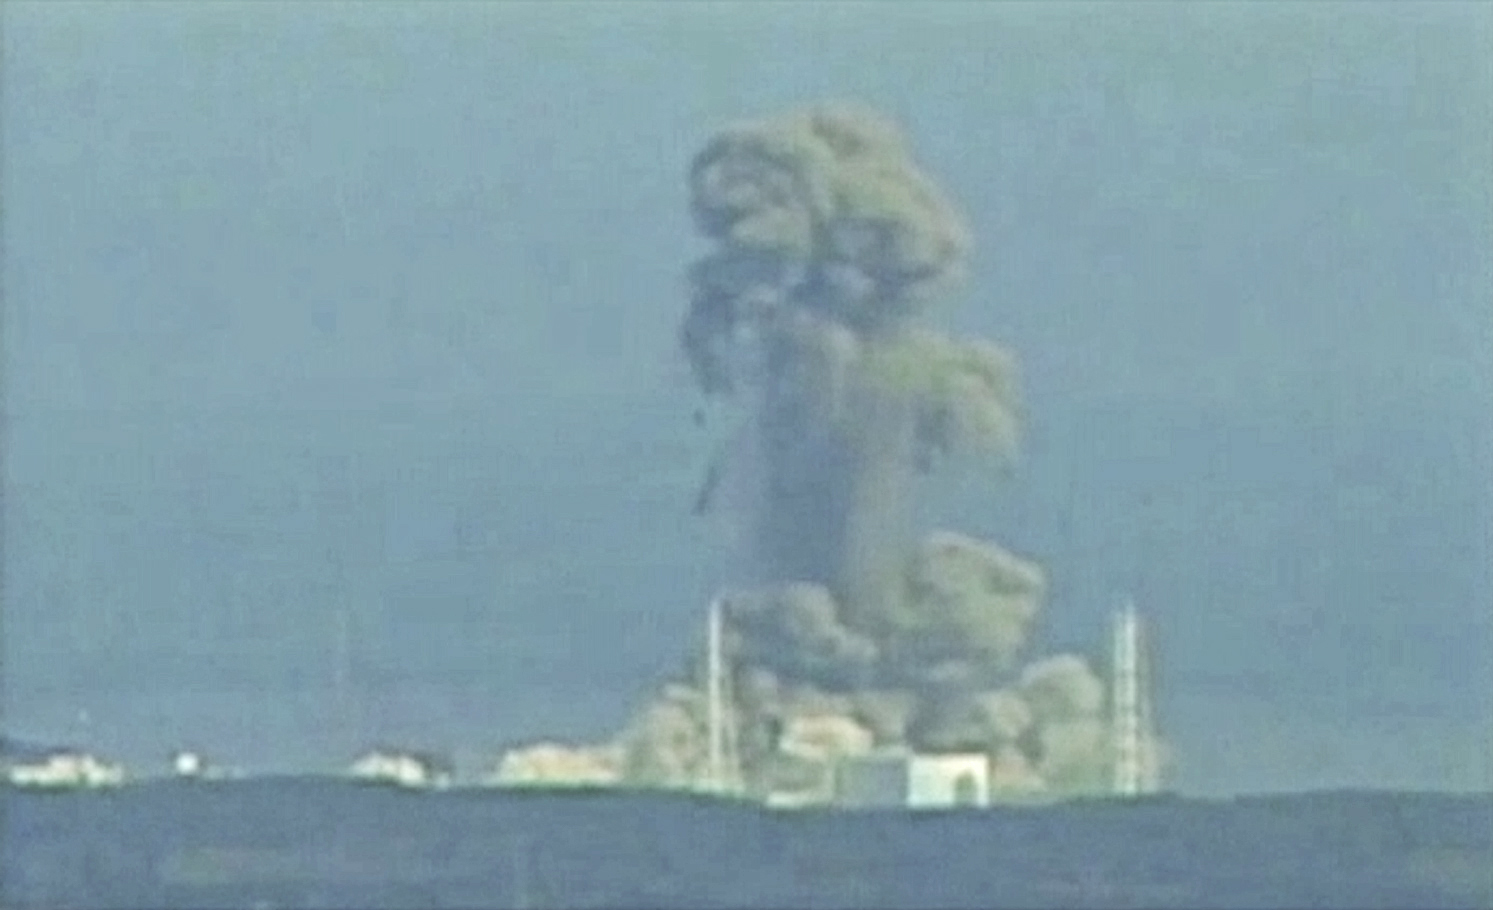
So, on March 11, 2011, the earthquake occurred which caused damage to the Fukushima Daiichi nuclear facility and that damage was later exacerbated by the massive tsunami that swept through Japan because of the jolt from the quake.  Japan’s Fukushima power plant was made up of 6 boiling water reactors.  With this level of power being pumped from the plant, they were able to produce 4.7 GWe’s of power!  This power plant was also created so that it could function with other companies.  Fukushima ran concurrently with General Electric, Tokyo Electric Power Company, and Boise.  Because of this conglomerate of power, the Fukushima Daiichi nuclear power plant placed on the world’s top 20 largest nuclear power plants.

Unfortunately, when the tsunami struck the Fukushima nuclear power plant, it did considerable damage to it’s reactor cooling systems.  This damage subsequently caused the nuclear meltdown.  However, before the tsunami hit, some of the nuclear reactors were already shut down for maintenance.  Unfortunately, with nuclear reactors, it takes days for them to cool off because of the heat decay rate of the fuel.  Without the cooling reactants, they will overheat thereby causing a meltdown.  Before the tsunami, the reactors were already running on the emergency electrical generators, but once the wave rushed in, those were ruined, and the meltdown began.

At the end of this nuclear disaster, many Japanese workers were killed due to the falling piping inside the factory during the earthquake and tsunami, and many more died later on due to radioactive exposure.  In addition to that, an area of about 12.5 mile evacuation zone surrounding the facility has been in order since the disaster and access is only gained with governmental supervision.  This evacuation is due to the fact that large amounts of radiation were released and poses environmental, health and even food and clean water concerns for the Japanese people who live in that area.

Sources:

http://www.world-nuclear.org/info/Safety-and-Security/Safety-of-Plants/Fukushima-Accident-2011/#.UVXyu442HS8

http://en.wikipedia.org/wiki/Fukushima_Daiichi_Nuclear_Power_Plant

http://www.theatlanticwire.com/global/2011/07/meltdown-what-really-happened-fukushima/39541/

http://www.npr.org/2012/02/28/147559456/one-year-later-inside-japans-nuclear-meltdown

Nuclear Radiation: Japan’s Fukushima Daiichi Plant and After Effects

Smoke rises from Fukushima Daiichi nuclear power complex in this still image from video footage


Solar Cells

This past week in class, we were experimenting with solar panels and how different types of light (different colors) will effect how much power (V) was produced with different colored filters at different distances.  For our experiment, we tested with no light, no filter, a blue filter, a green filter, and an orange filter.  With each trial, we used the NXT battery, a USB plug, a flashlight, ruler (cm), the 3 color filters, and the solar panel.

Here is an example of how our experiment would happen:

Step 1: First, after everything was set up, we wanted to get a baseline reading from the solar panel with no light.  By doing this we can check if the panel is working and then compare the numbers to numbers that will come up when there is light hitting the solar panel.  Having no light hit the solar panel was as easy as flipping it upside down.

Step 2: For our first real run, we used no filter on the flashlight, and just allowed 100% light to hit the solar panel from 0cm away.  After those readings came in, we would move the light source away from the solar panel in increments.  We would then run the experiment again with the light 10cm away facing the solar panel, and measure how much voltage was being picked up from the solar panel.  After that, the light would be moved back to 30cm, and finally 40cm away.

Step 3: Once we got our baseline readings with no light and light with no filter, we moved on to our first colored filter.  Our group started with the blue filter, so we would hold the filter flush with the flashlight and hold that at 0cm from the solar panel.  After that reading, we would move it away to 10cm, 30cm, and 40cm keeping the blue filter flush with the flashlight.  Finally we would move onto the orange filter and the green filter.

At the end of our experiment, we found out that there is a positive correlation between the color of light and how far away it is from the solar panel.  The closer the light was to the solar panel, the more voltage was read.  In addition to that, the natural light and the orange filter gave off the most amounts of voltage.  In conclusion, there is definitely a correlation between light intensity when you factor in colors and distances.


* I apologize for the photo below and it’s lack of clarity.  There was no other way to upload a photo of the experiment, so the one from my cell phone has to do. *


IMG_2411

Second Mass-Pulley Experiment

In this experiment, we re-tested how mass is effected when the power of a pulley is changed, and vice versa.  For all nine trails, the results are below:

Trail 1:  Mass: .25kg;    Battery Discharge: 69 mV;  Power: 50%;  Time: 1.206 seconds;  Acceleration: 3769 RPM/s;   Speed: 36.34605 RPM

Trial 2: Mass: .25kg;  Battery Discharge: 69mV;  Power: 50%;  Time:1.208 seconds; Acceleration: 30.38061 RPM/s;  Speed: 36.69978 RPM

Trial 3: Mass: .25kg;   Battery Discharge: 83 mV;  Power: 50%;  Time: 1.211 seconds;  Acceleration: 31.7077 RPM/s;   Speed: 38.39802 RPM

Trial 4: Mass; .09kg;   Battery Discharge: 125 mV;  Power: 50%;  Time: 1.209 seconds;  Acceleration: 37.51389 RPM/s;  Speed: 45.35429 RPM

Trail 5: Mass: .09kg;  Battery Discharge: 111 mV;  Power: 50%;  Time: 1.209 seconds;  Acceleration: 38.9962 RPM/s;  Speed: 47.1464 RPM

Trial 6: Mass: .09kg;  Battery Discharge: 28 mV;  Power: 50%;  Time: 1.206 seconds:  Acceleration: 39.41963 RPM/s;  Speed: 47.54008 RPM

Trial 7: Mass: .05kg;  Battery Discharge: 69 mV;  Power: 50%;  Time: 1.206 seconds;  Acceleration: 42.85739 RPM/s;  Speed: 51.68601 RPM

Trial 8: Mass: .05kg;  Battery Discharge: 125 mV;  Power: 50%;  Time: 1.21 seconds;  Acceleration: 42.233 RPM/s;  Speed: 51.10193 RPM

Trial 9: Mass: .05kg;  Battery Discharge: 194 mV;  Power: 50%;  Time: 1.206 seconds;  Acceleration: 42.7428 RPM/s;  Speed: 51.54782 RPM

(Chart and data from experiment:) batterydischarge1a-2

For this experiment, we began to understand the relationship between mass and battery discharge, and how that changes at different power levels and different speeds.  For this experiment, the power level stayed at 50% throughout the entire experiment, but the mass changed from .25kg, .09kg, and .05kg.  This change in mass will change the battery discharge because the battery will have to do more work in order to get the mass to the top of the pulley.  This means that there is a positive correlation between force, mass and velocity (F= MV).  As you can see from the data above, the battery discharge rate is lower when the mass is higher.  Overall, this experiment was a good learning experience for us to see the relationship between things, and how they can change the entire outcome of the data.


Solyndra Scandal

images

The 2011 Solyndra Scandal was a fast moving and abrupt process of lay-offs and bankruptcy.  Solyndra was a company founded in 2005 that was a major innovator in the production of thin-film solar cells, or solar panels.  Solyndra boasted about being at the forefront of technology with their lightweight, weather-savvy, aerodynamic solar panels that were supposed to be able to convert 12-15% of sunlight into electricity.  However, even Solyndra’s forward thinking couldn’t protect them from scandal.

Solyndra’s “cylinders, one inch in diameter, is made up of two tubes… the tubes use hermetic sealing technology to exclude moisture… When combined with a white roof… the company claimed that systems that employ the panels on a given rooftop could produce significantly more electricity in a given year.  It was thought that on a white roof, the panels can capture up to 20% more light than a black roof… The other advantage claimed by the company was that the panels did not have to move to track the sun… The Solyndra panels allow wind to blow through them.  According to the company, these factors enable the installation of PV on a broader range of rooftops without anchoring or ballast, which are inherently problematic.  Solyndra claimed that wind and snow loads are negligible and that its panels are lighter in weight per area.”  This goes to show Solyndra’s innovate technology in the effort for green energy.  Using cylindrical tubes that allow the wind to pass through makes more a much more efficient solar panel.  Also, since they are thinner panel, scientists noted that they work better packed closer together, which minimizes wasted space in the surrounding area.

However, on August 31, 2011, Solyndra officials announced that they were filing for Chapter 11 Bankruptcy, and would subsequently be laying off all 1,100 employees, and ceasing production and manufacturing.  Looking back, according to the Washington Post,  in March of 2010, auditors began to raise concerns about Solyndra’s budgeting and whether or not they were going to be able to continue operating.  Very quickly, in December of 2010, executives realized that Solyndra was essentially out of money, and in January of 2011, the CEO’s speak with the Obama administration about how they are on the verge of bankruptcy.  The DOE, noticing Solyndra’s financial crisis, gives them $75 million towards refinancing the company in hopes of keeping them afloat.  However, in August of 2011, Solyndra shuts down despite of the government refinance money.

Because of this abrupt closure of the company, the FBI and the Department of the Treasury launched an investigation in September of 2011.  The FBI looked into Brian Harrison, CEO, and Chris Gronet, Solyndra’s founder to look for accounting fraud.  After that ordeal, a judge found both men not guilty of fraud, and Solyndra remains out of business.


Sources:

http://en.wikipedia.org/wiki/Solyndra

http://www.washingtonpost.com/wp-srv/special/politics/solyndra-scandal-timeline/

http://abcnews.go.com/blogs/politics/2012/07/obama-fundraises-with-players-in-solyndra-scandal/


Flashlight Experiment

This past week, we worked on a manual flashlight experiment, where we manually charged a flashlight.  The flashlight had a copper coil inside which conducted the electrical charge throughout the experiment.  There was also a magnet on the inside of the flashlight that would slide to opposite sides of the flashlight whenever we would shake it.  This movement of the battery helped create the charge, while the copper coil conducted the charge.  This was hooked up to the computer, so that we could accurately get our results.  Over the course of the three trials, these are the results below.

Baseline: 0 shakes;   sum squared: 0.292718

Even though we were not actually shaking the shake light, there are still some charges flowing through the light, so there is still a charge even though nothing is actively going on.

Trial 1: 44 shakes;   sum squared: 245.8468

Trail 2: 23 shakes;   sum squared: 100.1544

Trial 3: 16 shakes;   sum squared: 40.15929

Looking at the above data, it is easy to see that the more shakes, the greater the charge and the greater the sum squared (of all the numbers that the light generates and then square it) will be.  Below is a scatter plot chart of our results.

Copy of test2