Friday February 21st, 2014 we conducted a very interesting experiment. After learning about solar energy, we used labview to conduct an experiment. The lab was titled Solar Cell Lab; we used the following equipment to conduct our experiment:
- One solar cell
- One voltage probe
- One NXT adaptor
- Labview
- Ruler
- Colored film filters
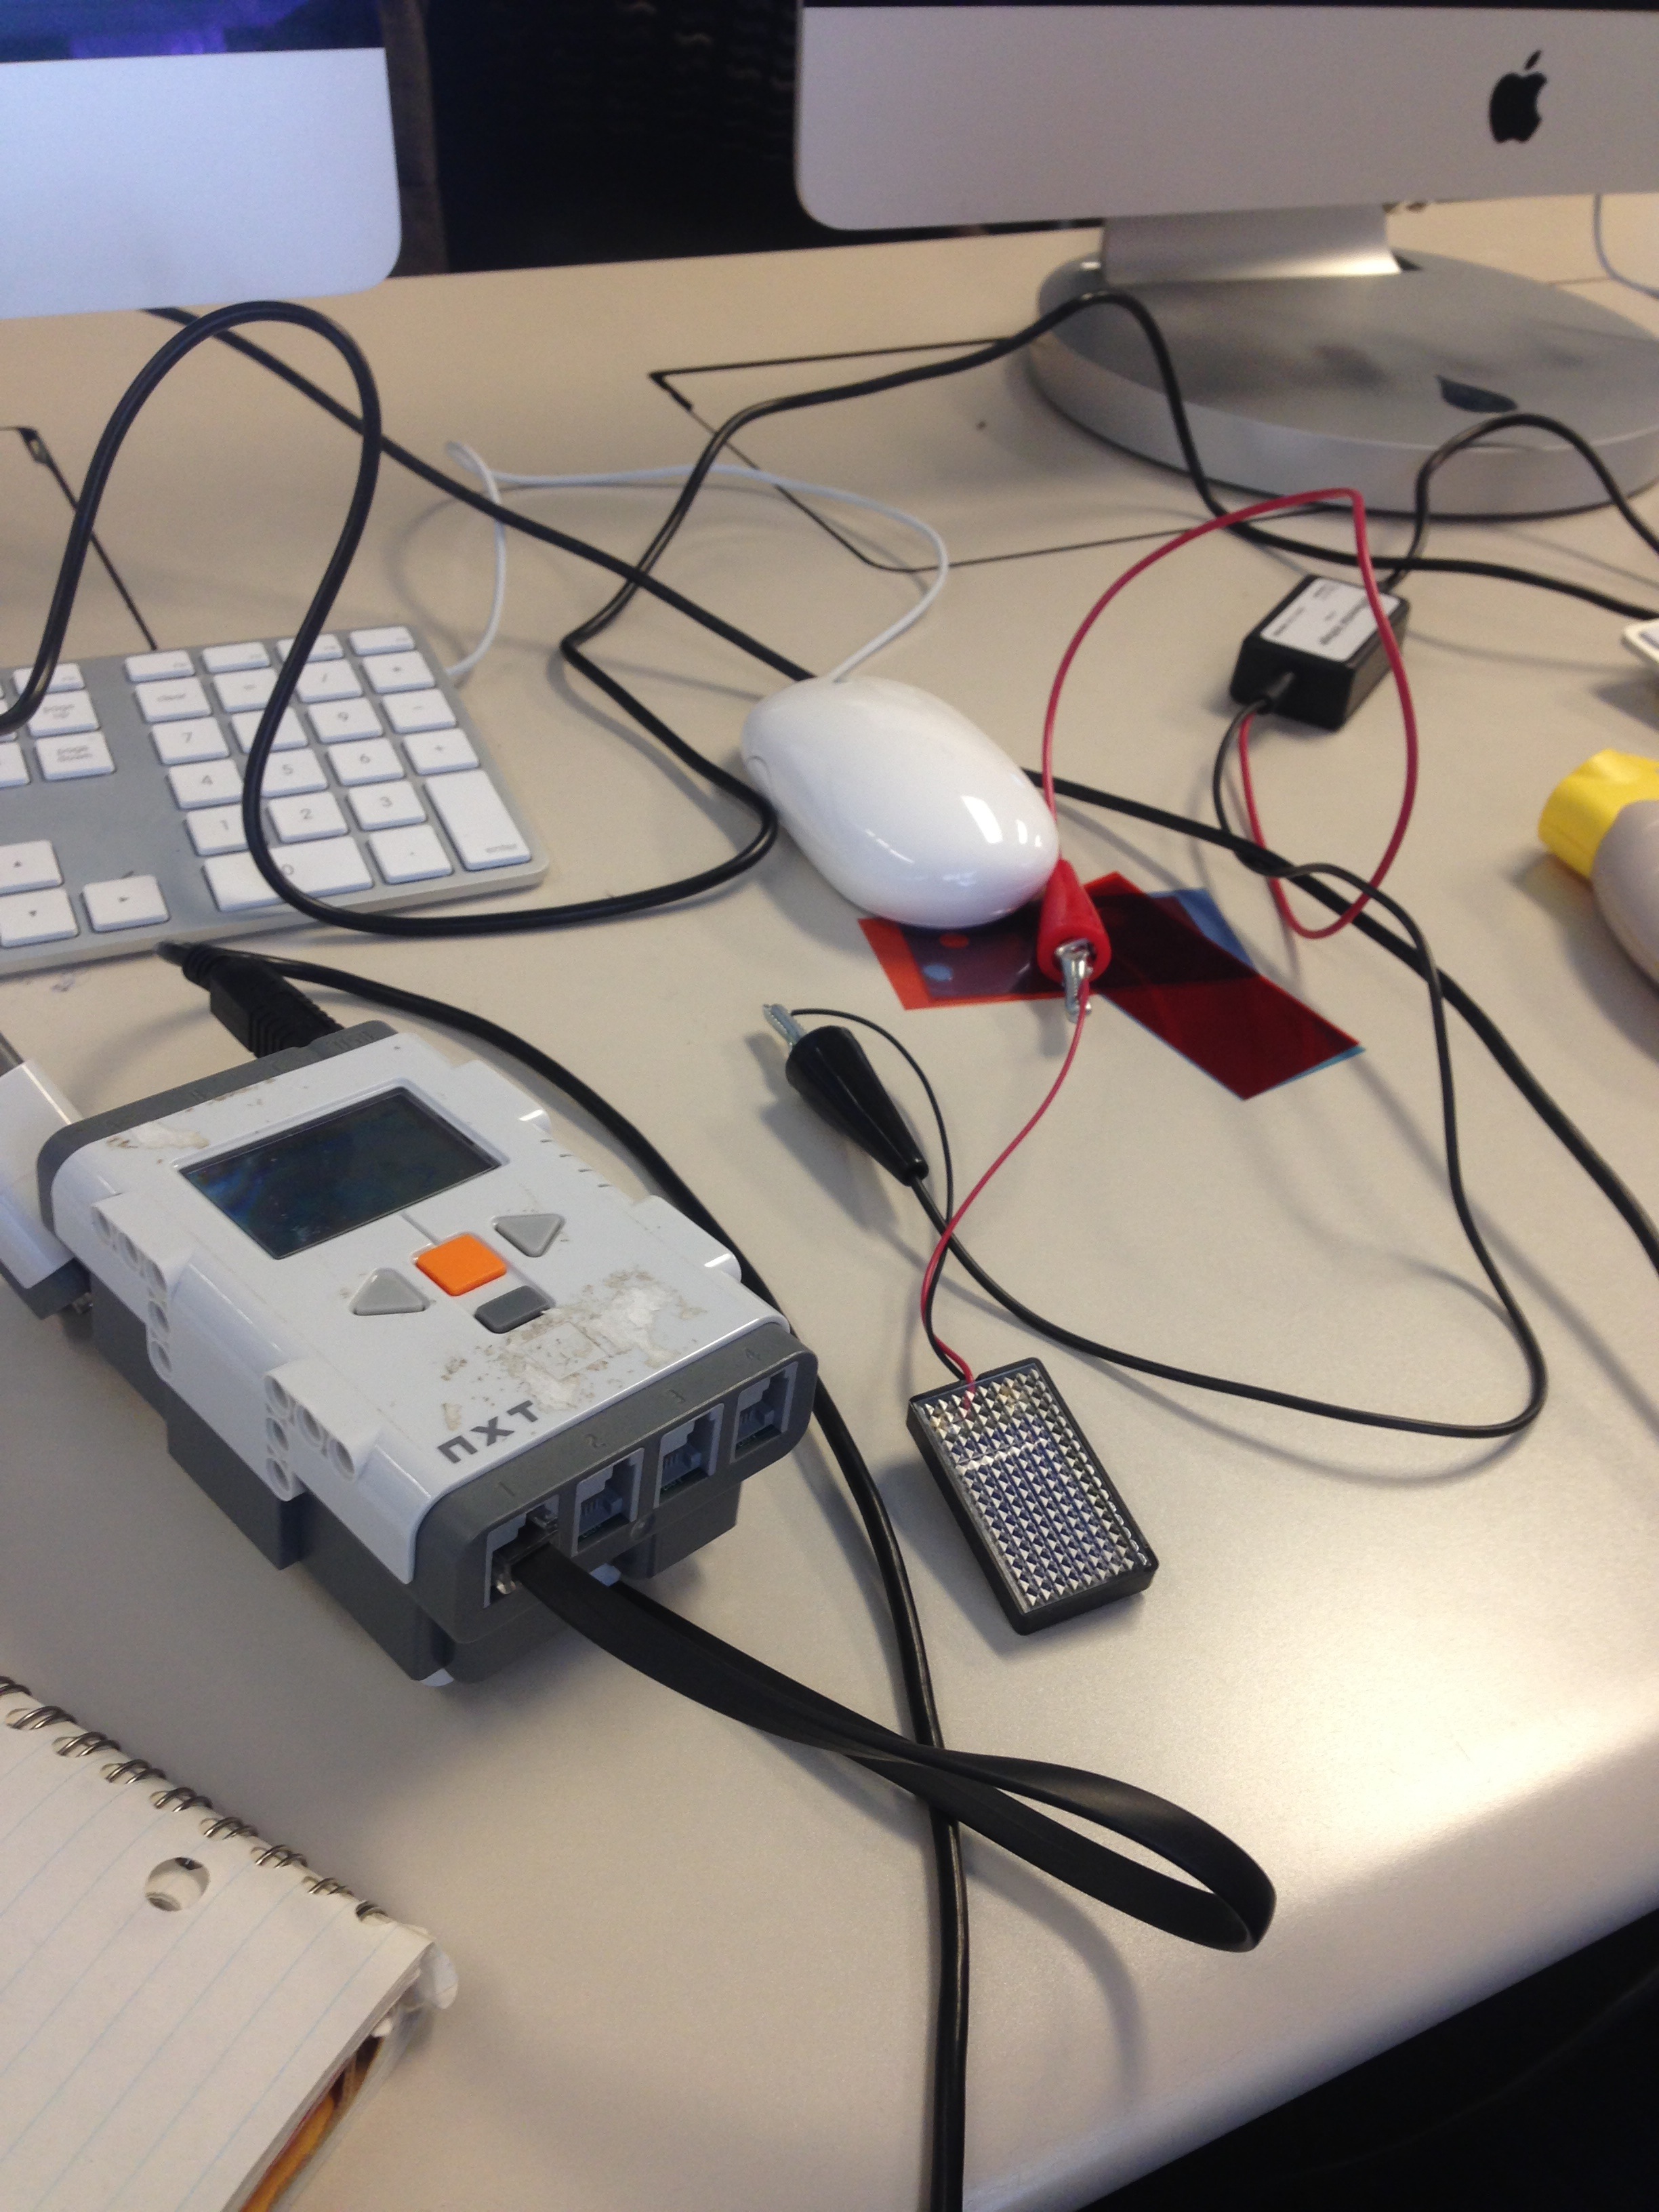
The picture below taken by me on my iPhone displays some of the equipment we used. It also displays the set up and how we went about connecting the robot to the iMac.
Our objective was to understand the correlation between light intensity and voltage output by the solar cell. We also gained the knowledge of the relationship between wavelength of light and voltage output of solar cell.
Within the blog I will post two pictures to help visualize my explanation. We began our project by measuring how much voltage was generated without any light. As expected, the 10-second average was very insignificant, .07. Our experiment gradually became more interesting. We followed the initial experiment by placing a flashlight directly on top of the solar cell. After averaging the 10-second period the average was much higher than the first experiment.
We repeated the process 6 times; the only variable that changed was the distance from which the flashlight was lighting the solar cell. Below is a table describing the distance and the voltage the solar cell produced.
| Distance | Average Voltage |
| 0 | .069 (no light) |
| 0 | .404 Light |
| 5 cm | .356 |
| 8 cm | .298 |
| 10 cm | .333 |
| 12 cm | .325 |
The graph below will show a direct correlation between the distance and the voltage.
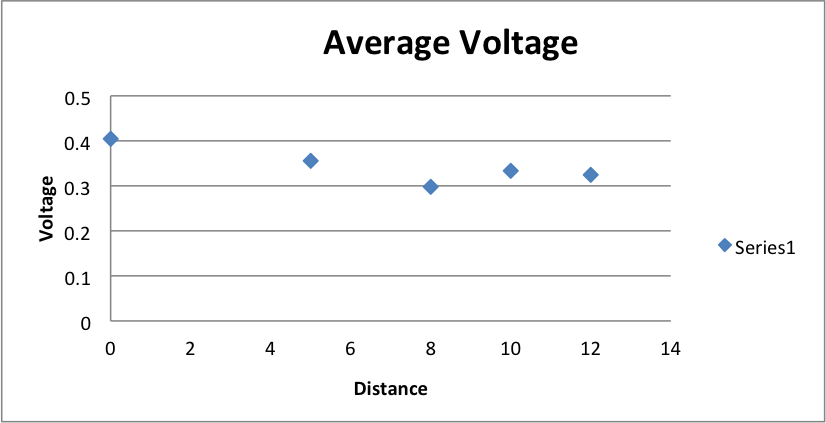
To summarize the further the distance the lower the voltage; this is due to the fact that the solar cell captures less light when the flashlight is at a greater distance.
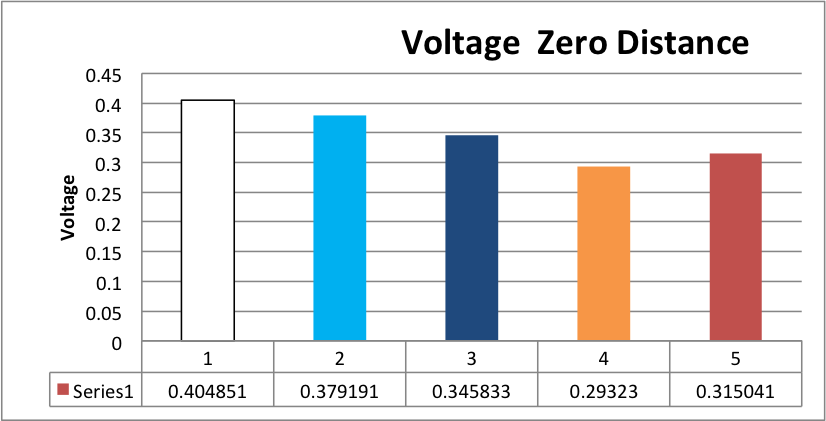
The second half of the experiment was from 0 distance. Meaning the light was directly on top of the solar cell. The only difference is the colored film filter placed on top of the solar cell. We used four different colors to conduct the experiment. The table below will display the colors used along with the results in voltage generated.
| Color | Distance | Average Voltage |
| None | 0 | .4 |
| Light Blue | 0 | .37 |
| Dark Blue | 0 | .34 |
| Orange | 0 | .29 |
| Red | 0 | .31 |
The bar graph below will display our findings. My partner and I for the most part predicted the results. We knew that the solar cell without any film filter would produce the highest amount of voltage. Out of the four colors the only one I did not predict accurately was orange, I was certain orange would allow more light through then Red, but I was wrong.