Fracking’s Impact on Oil and Gas Prices

Introduction

Oil and gas prices have been going down internationally for the last six months. There are several reasons for this, and one of them is the increased availability of alternative energy sources, like energy from natural gas. Natural gas is released from the earth by fracking, and this blog post will explain how the increase in fracking may be influencing the reduction in worldwide gas prices.

Why Oil and Gas Prices are Currently Low

According to the International Business Times, “The price drop [in oil and gas] is due to Saudi Arabia and other oil-rich OPEC countries not pulling back on crude production”. But the reasoning is more complicated than that, because the next question is: Why aren’t they?

gas-price-historical

The above graph is from the same article referenced above, and shows how the price of crude oil dropped from $140/barrel in 2008 to $36/barrel in 2015. As the article said, there is now a glut in the market because oil and gas is being produced at the same rate, but demand is down.

So supply is remaining steady while demand is down. Why is demand down? One reason is that there is a greater use in the US and Europe for energy-efficient cars, such as hybrids, which take less gas. Second, the US itself has become the world’s largest oil producer (though not world largest exporter). It’s cheaper for the US to buy oil from itself because it does not have to transport it or deal with international trade rules.

Finally, in general, people are switching to other sources of energy, and that includes natural gas. Natural gas is released from the earth by a process called fracking.

What is Fracking?

Fracking, also known as hydraulic fracturing, is a technique designed to recover gas and oil from shale rock. The BBC made a short video cartoon explaining how fracking works.

Advantages of fracking include being able to extract difficult-to-reach resources of oil and gas, and having been part of the reason why the US has significantly improved its domestic oil and gas production, as described earlier. Fracking is controversial because of its effects on the environment; it can release toxins into the ground, groundwater, and air. Also, worker injuries and on-site explosions are a risk.

How Fracking Lowers Oil and Gas Prices

The main way that fracking has lowered oil and gas prices currently is that it has allowed the US to become the world’s biggest oil producer. Since the US Energy Information Administration says that, “In 2015, the United States consumed a total of 7.08 billion barrels of petroleum products, an average of about 19.4 million barrels per day,” since the US is not importing the oil, the oil is cheaper for us. This makes it so that world oil prices have decreased.

Conclusion

In conclusion, the relationship between oil prices and fracking right now has a lot to do with the US. Because the US is a large consumer of oil, and also, found a cheaper way to produce it domestically, the world price of oil is going down. This is also because, even though this has happened in the US, the OPEC countries are not controlling their production, either. If they were to lower it, the price of oil worldwide would go up – but the US would still enjoy the discount associated with having local oil produced that does not have transportation and international trade costs connected.

Three Brainstorming Ideas for Experiment

My group met in class, and we brainstormed about three possible experiments.

Idea #1: Generate Chemical Energy from Animal Waste

This could be shown by burning animal waste to produce heat and light.

Idea #2: Demonstrate Movement of Thermal Energy

This could be demonstrated by inflating a balloon in water when changing the temperature of the water. An example from YouTube is below.

Idea #3: Demonstrate Hydroelectric Energy

This could be demonstrated by having a waterwheel, and using water to make it turn and generate electricity. Here is an example of one built in a basement and displayed in a back yard.

What I Observed and Learned from Tom Vales demo

I observed and learned several things from Tom Vales demo about many topics in science. I will first give an overview of the demo, and then explain what I observed and learned.

Overview

In the demo, Tom Vales set up a Tesla coil as we talked about in previous blogs. The Tesla coil requires electricity to run, but as it runs, it amplifies the electricity. Tom’s coil was vertical, and had a spinning tip (propeller) on the top of it where the electricity collected. He said it was going at 101 khz/second.

In the first part of the demo, he touched various objects to the tip, and the electricity jumped to them. He explained the different effects caused by the different objects. He also showed several electronic historical devices and talked about them.

Three Glass Tubes

Tom used three different glass tubes and touched them to the propeller to see the electricity jump. The first tube was made by his friend out of different colors of glass. It lit up brightly when he touched it to the propeller, but he did not get hurt. He explained this is because of the Skin Effect (described below).

The second the glass tube was a little larger than the previous one, and was clear. Tom explained that there was gas inside the tube. He said that how the tube looks when it touches the propeller depends not only on what gas is in the tube, but how much, the voltage of the electricity, and the shape of the tube. He explained how gas has this property that it expands to fill the entire space it is in, and so the shape of the tube should matter.

This tube was filled with xenon gas, which he described is the same gas as in flashes on cameras. When he touched it to the propeller, it looked like a line of bluish-white lightening was going down the tube toward his hand, and it made a crackling noise.

The third tube he used to demonstrate how you can have the same gas in the whole tube, but if it is a smaller diameter on one part compared to another, the color will be different. This tube was skinnier on one end than the other. When he put it by the propeller, he showed the same gas glowed pink on the skinny side and blue on the thicker side.

The Skin Effect

When he was using the glass tubes with the propeller, he pointed out he could not touch the propeller directly or he would get burned. Using the glass tube, the electricity actually climbs down the tube to his hand but then jumps over his body. He said this is called the Skin Effect.

The Placebo Effect

Tom explained at the time that Tesla coil got popular, there was a lack of medical research and medical treatments that had been proven. Therefore, people offered various things as medical treatments. Many did not work, but people thought they worked because of the “placebo effect”. This is an effect that patients get when they believe they are getting a treatment, even if it’s not real. Just the thought that they are getting treated can make them feel fewer symptoms and like they are getting better. This is why some of the various non-proven medical treatments of the time were accepted as fact and some people believed they really worked.

Violet Ray Machine

Finally, Tom demonstrated one of his many historical Violet Ray Machines. These were machines that produced electricity that traveled down various shaped wands. The wands were supposed to be held by the part of the body that was hurting (such as the throat), and somehow, this was supposed to cure the problem. Each machine came with a set of attachments, and these attachments were suited to different parts of the body. They said it cured coughing, brain damage, or even hemorrhoids, but what was really happening was the Placebo Effect. There were also manuals explaining how to use these for medical treatment, and there were even trainings, conferences, and symposia about it.

Tom demonstrated a few of the attachments. The kit he demonstrated had three electrodes, but he said he had others with many more attachments; one had over 20 attachments. The attachments were glass, and they had a violet-colored lightning bolt that would travel down them. The first one had a comb on it, the hair electrode, and was supposed to be used on one’s head for psoriasis and other skin condition on the head. The second one, a skin electrode, had a flat part at the end for running around the skin. The third one was the shape of the throat, and was used when a patient had a sore throat. He said that when they were available, they could be bought by anyone at a store, and cost about $8.00.

Conclusion

Tom’s demo included using the Tesla coil to show how it generated electricity. He also demonstrated how electricity appears differently in different tubes, and described these historical medical devices. I learned a lot from Tom’s demo, and enjoyed looking at the different colorful lights.


Three Initiatives from the President’s Climate Action Plan

Introduction

The President’s Climate Action Plan was released by the United States Executive Office of the President in June 2013. It set forth a vision for the US government to work to prevent climate change not only domestically, but internationally. This blog post will first describe this action plan, and then give examples of three initiatives set forth in the action plan.

The President’s Climate Action Plan

This document is in the form of a 21-page report, and is divided into three sections. The first section is titled, “Cut Carbon Pollution in America,” and describes the President’s plan for domestic efforts to reduce carbon emissions in the US. It sets forth goals with respect to deploying more clean energy, cutting waste in both the home and business sectors, and reducing other greenhouse gas emissions. One initiative put forth in this section is cutting carbon pollution through advanced transportation technologies, and I will describe this initiative in this blog post.

Beach_erosion_(8427148836)
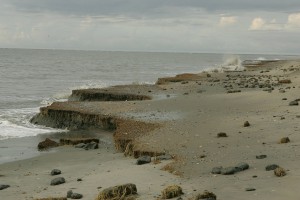
Beach erosion due to climate change.

The second section of the report is titled, “Prepare the United States for the Impacts of Climate Change”. This section describes plans to build safer infrastructures and communities, protecting the US economy and natural resources, and referring to science to manage climate impacts. This section describes an initiative focused on preventing droughts, wildfires, and floods, and I will describe this in my blog post.

Finally the third section is titled, “Lead International Efforts to Address Global Climate Change”, and describes international efforts the US is involved in. Initiatives are described that involve joint efforts between countries, and how international negotiation is intended to be used to develop new international joint efforts is covered. One initiative described in this section involves international efforts to prevent deforestation, and I will cover this initiative here.

Cutting Carbon Pollution in America through Advanced Transportation Technologies

Several initiatives under this main initiative were described:

  • Renewable Fuels Standard – This initiative supports investing in research and development to develop new biofuels and bring them online. Biofuels are energy made of biomass; the two most comment types of biofuels are ethanol and biodiesel.

  • Department of Energy’s eGallon program – This program informs drivers about electric car operating costs in their state. The national average for operating costs for electric cars is only $1.14 per gallon of gasoline equivalent.
  • United States Navy and Departments of Energy and Agriculture – These agencies are collaborating on an initiative to work with the private sector to accelerate the development and use of advanced biofuels in military and commercial sectors.

Preparing the United States for Climate Change: Droughts, Wildfires, and Floods

The President’s Climate Action Plan also described efforts to mitigate the impact of droughts, wildfires and floods:

  • National Drought Resilience Partnership – The Obama Administration launched this effort which was built upon the National Disaster Recovery Framework. This is intended as a “front door” for communities seeking assistance in preventing droughts and reducing the impact of droughts.
  • Western Watershed Enhancement Partnership – This is a pilot project in five western states between the Department of the Interior and the Department of Agriculture. This project aims to reduce the risk of wildfires by removing flammable vegetation around critical areas such as water reservoirs. In August 2014, the program announced that it had restored an important central Arizona watershed.
  • Update to Flood Risk Reduction Standards – This effort is an extension of the work done by the Hurricane Sandy Rebuilding Task Force. It will incorporate the most recent science on expected rates of sea-level rise in different regions.

International Efforts: Reducing Emissions from Deforestation


Finally, the President’s plan sets forth plans to address international deforestation. The Obama Administration is working partnering with countries to reduce global land-use-related emissions, to create new environmentally-friendly models for rural development, and to conserve biodiversity, protect watersheds, and improve livelihoods.

The U.S. Agency for International Development sponsored these specific initiatives:

  • The Forest Investment Program and Forest Carbon Partnership Facility  – These are two of the multi-lateral initiatives that contributed to reducing more than 140 million tons of carbon dioxide emissions.
  • Green Prosperity  – This program in Indonesia, which is sponsored by the Millennium Challenge Corporation, supports environmentally-sustainable economic development in select districts.
  • Tropical Forest Alliance 2020  – This initiative is geared toward addressing agriculture-driven deforestation. It brings together governments, industry, and the community to reduce tropical deforestation related to agricultural activities.

Conclusion

In conclusion, the President’s plan in 2013 put forth an ambitious course of action for the US on the climate change front. The US is now focused on initiatives to reduce domestic and international carbon pollution, and has met with success with a few of these initiatives already. Hopefully, they will continue to be successful in the future.

MOS Trip Review

Introduction

We went on a trip to the Museum of Science in Boston, and were asked to review four exhibits: Energized!, Catching the Wind, Conserve@Home, and Investigate. Energized! focused on different ways of generating energy. Catching the Wind focused on wind turbine energy. Conserve@Home showed different ways of recycling and conserving energy. Investigate! provided opportunities for observation and experimentation. I will review my reaction to these exhibits here.

Energized! Exhibit

IMG_7716In the Energized! Exhibit, one part of the exhibit showed how energy levels generated by solar energy change throughout the
day, depending on the time of day. This is similar to an experiment we did in class in looking at how much solar energy was generated when we directed light from a flashlight on a solar cell.

To the left, you can see the picture I took of this part of the exhibit. Notice the arrows labeled “Morning”, “Noon”, and “Afternoon”. These are associated with three buttons on the console. As you can see, I pushed the button on the right, and that directed Afternoon levels of light at the solar panel (see the red wand). A display is made that shows the level of energy being generated – see the red box on the left.

Observe that the black surface on which the light is falling is irregularly shaped, like a building would be. This is to demonstrate that not only does the surface matter, but the location of the light source matters, in terms of generating solar energy.

Catching the Wind Exhibit

This exhibit focused on wind energy. There was a tube under which a person can place their hand and feel wind. This is the amount of wind needed in order to turn a wind turbine. I tried it, and it was not a very strong wind, but it was definitely stronger than a breeze.

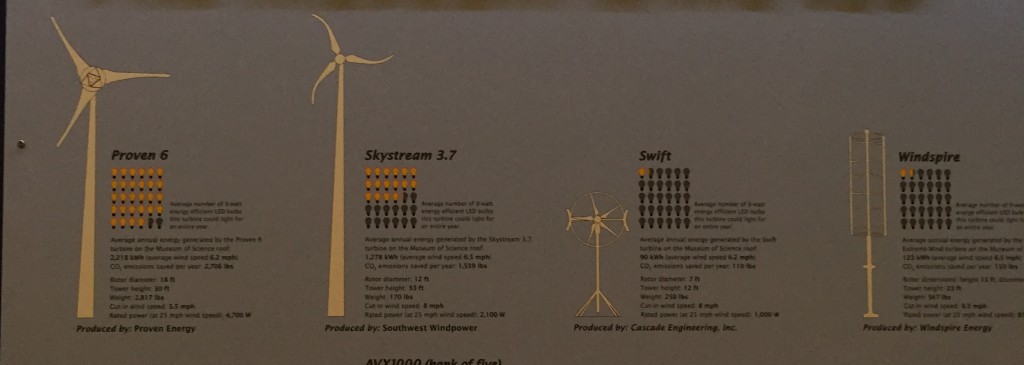
They had a display that showed several different types of wind turbines.

This picture shows four different turbines. I had not really thought about the differences between these before this exhibit. One way they demonstrate the differences is by showing how many light bulbs could be lit for a year using the energy from this turbine. They show this with a graphic to the right of the turbine.

As you can see by the graphics, the one on the left produces the most energy. This can be seen by all the yellow light bulbs that would be lit for a year. The turbine to the right of it is similar, but the ones on the far right seem far less productive.

Conserve@Home Exhibit

There were two sections of this exhibit I will talk about: A part that showed how waste can be recycled into products, and a
part that showed, how “smart” houses might be able to generate energy from within themselves.

What a Waste! Display

IMG_7740On the left, you will see a picture I took of the first part I mentioned. The flaps over the wooden boxes show an example of a type of waste. When you lift the flap, inside is an example of a product that can be made through this type of waste As you can see on the right, a person is lifting the flap and showing a type of garment that can be made out of recycled materials. The point of this part of the display was to show how different household waste we see every day could be changed into something new that we need at home.

Turn Your Energy Into Light Display

In this display, there was a steering wheel (lower right). As I turned the steering wheel, it would generate electricity that
would be shown by how much the lights connected to the steering wheel lit up. If I turned the wheel very fast, it generated more energy.

There were three kinds of lights: The one of the left is LED, the one in the middle is incandescent, and the last one was CFL (fluorescent). I noticed that as I turned the wheel, there was a delay between that and the lights coming on. And, I noticed this delay was the shortest with the incandescent light – it came right on when I started turning the wheel.

Investigate Exhibit

Finally, the Investigate exhibit encouraged us to consider some ideas from a scientific perspective. I was very interested in a particular exhibit that showed how a toilet flushed. I took a video of this, but I had trouble posting it, so I will post the picture here. Notice that in the toilet bowl, there are two white floating ping pong balls. When it is flushed, we can see the balls travel to the left through the pipes.
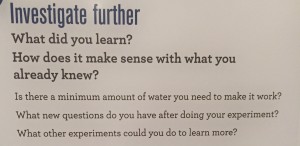
Notice the white vertical pipe on the back wall. The balls actually travel through the plumbing system and end up coming down that pipe! After viewing this, these questions were posted to think about:

IMG_7736To answer some of these questions, I learned the process of how the mechanisms in a toilet work to push the water along, since it was transparent. It made sense now with the sound I would hear with the flush; I now can see what happens along with the sound. Also, I was able to see how narrow this was, and I totally understand why people are told not to put too much paper in the toilet! It is easy to plug.
Conclusion

In conclusion, I enjoyed looking at these different exhibits. From the Energize! exhibit, I was able to see the effect of the sun moving across the sky on solar energy generation. In the Catching the Wind exhibit, I learned about the different types of wind turbines and how much energy they make. In the What a Waste! display, I learned about a lot of products that can be made from recycled waste. And finally, in the Investigate exhibit, I learned about how the water in a toilet flows.

Review of Pandora’s Promise

Introduction

Pandora’s Promise is a documentary produced in 2013 by award-winning director Robert Stone. Robert Stone had made previous anti-nuclear documentaries, but this one was different. Instead, this one made the case that nuclear energy is actually safer and greener than coal, and was directed at environmentalists to make them reconsider nuclear energy as a possibility for solving the world’s energy problems. This blog post will provide my review of this movie.

Many Opinions, Few Facts

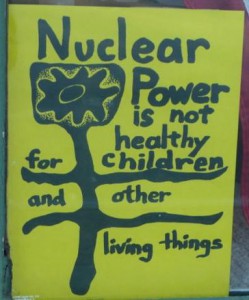
I found the movie visually appealing and interesting, but difficult to follow in terms of theNuclear_power_is_not_healthy_posterarguments the director was making. For example, a journalist was interviewed who said he used to be on the anti-nuclear side, but now he changed. He said the reason he changed was that he spent a lot of time with physicists and finally learned how nuclear energy really works. He was very passionate, but he was not convincing. He didn’t explain what it is he learned from these physicists that made him change his mind.
In fact, the movie was not good about putting titles visually on the screen for the people the director was interviewing. I was unfamiliar with these people so it was hard to keep track of what the points were supposed to be about. A lot of the movie was comprised of people remembering past nuclear activism and issues, and a lot of history is presented. But there are not a lot of clear facts. In fact, it is debated in the movie as to how many people died at Chernobyl. Two totally different numbers are cited, but not attempt is made to figure out the correct number.

Analysis: Is Nuclear Really Safer?

It is hard to watch this movie and not consider the situation that if something goes wrong with a nuclear reactor and there is a meltdown or explosion, it could be especially catastrophic. The opinions expressed that suggest that nuclear isn’t as dirty as once thought, or that other fossil fuels are not as clean as once thought, are probably based in fact. But ultimately, the point made early in the movie, that even Fukashima, which was run well and built solidly, ran into a problem after a freak tsunami. Every single situation cannot be prevented, and one huge mistake with a nuclear power station could be devastating. This cannot be said for fracking, coal extraction, or other types of “dirty” energy production.

Chapelcross_Nuclear_Power_Station_2

Conclusion

Although this movie was visually stimulating, and provided interesting history and opinions, I do not think it met its goal of being convincing about its point, which is that nuclear energy deserves a second look and could possibly solve our energy problems. Since the earlier eras where there was a lot of protesting against nuclear energy, it has been revealed that most energy production is dirty, not just nuclear. Simply saying that nuclear is not as bad as we thought, or the other energy generation approaches are worse, does not lead to the idea directly that we should wholly embrace nuclear energy.

Two Nuclear Disasters: Three Mile Island & Fukushima

Introduction

Generating electricity from nuclear power requires nuclear power plants. While these can be helpful and efficient ways to generate electricity, there are also downfalls. One of the main downfalls is that if there is a problem with the nuclear reactor, there can be health effects. The worst case scenario is a nuclear disaster, where radioactive gasses are released and living things in the area (including plants, animals, and people) become ill and even die.

In this blog post, I will talk about two nuclear disasters: Three Mile Island, which took place in the United States, and Fukushima, which took place in Japan. I will explain what happened in these disasters, why the disaster occurred, and will finish the post by saying what can be done to make nuclear energy safer.

Three Mile Island

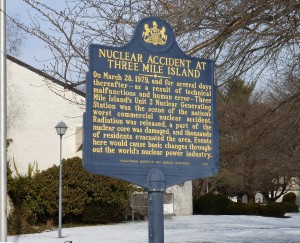
Three_Mile_Island_accident_sign


Three Mile Island is a nuclear energy generating station in Pennsylvania. The above picture commemorates the nuclear disaster that took place at the station in 1979.

What Happened

The Three Mile Island nuclear accident did not result in negative health effects of plant workers or residents, according to the government, but was the most serious commercial nuclear disaster in the US and it brought about changes and reform.

What ultimately happened was that a cooling system for the reactor broke down because a valve was stuck open and coolant was pouring out, but the employees did not know this. Therefore, the coolant leaked out and caused the reactor to overheat and melt down. This is similar to if a radiator in a car runs out of coolant and the engine overheats and breaks.

Why it Happened

The story of why it happened has several steps. First, the problem only happened in one of two reactors. In that reactor, the problem started in a non-nuclear part. A cooling system stopped working right, and this caused a buildup of pressure in the nuclear part. That was okay, because then a valve opened to allow the pressure to escape.

Where the problem came was that the employees thought the valve had closed, but it hadn’t. Coolant started pouring out the valve, so it was not cooling the reactor. The reactor started to overheat, and alarms went off, but the employees had no idea what was going on. They actually took actions that made the situation worse without realizing it. Finally, the core started to melt, and this was when the actual problem was discovered and addressed.

The plant workers did not actually get complete control of the plant back until Day 10 of the disaster. The community around the plant had to be evacuated until this time.

Fukushima

Japanmap

On March 11, 2011, a large earthquake and tsunami hit Japan and did considerable damage. It hit the Fukushima power station, which has 11 nuclear reactors. Luckily, the reactors survived the earthquake, but the tsunami caused damage that led to the Fukushima nuclear disaster.

What Happened

In March of 2011, an earthquake occurred followed by a tsunami, and interestingly, the 11 reactors of the Fukushima plant all survived the earthquake. Seismically, the reactors proved resistant to damage, but their operations were vulnerable to the tsunami.

All 11 reactors shut down as planned when the earthquake hit. Also, the power plant lost electrical power, and this caused them to revert to using back-up generators. However, there were not enough back-up generators to handle all the power needs since this was such a large power failure.

Why it Happened

The tsunami disabled 12 of the 13 backup generators. This caused the cooling system to be inadequate for 3 of the 11 reactors. The three units could not maintain proper reactor cooling and water circulation functions, and electrical switches were disabled. It took many weeks of dedicated work by employees to get the cooling system to begin functioning again and to get the reactors back online.

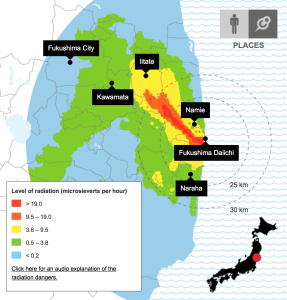
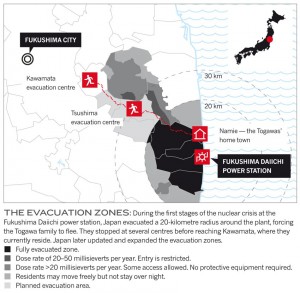
Below shows a map of the exposure from the disaster.

Screen Shot 2016-03-06 at 8.03.50 PM

Making Nuclear Power Safer

In terms of Three Mile Island, the result of the disaster was reform. Public health investigations as well as lawsuits took place, and there were a lot of lessons learned about how to improve protocols at nuclear plants to make them safer.

However, the example at Fukushima shows that even the best plans cannot account for every situation. The fact is that nuclear energy involves dangerous mechanisms over which humans can lose control. The result can potentially be a huge loss of human life. Whenever a nuclear plant is built, the human race is placing a bet. Therefore, probably the safest approach to nuclear energy would be limiting it and finding less dangerous and more sustainable approaches to generating energy.

Conclusion

Three Mile Island, which took place in the US, and Fukushima, which took place in Japan, represent two modern nuclear disasters. Even though the result was not widespread death and injury, the events were enough to strike fear into the local populations. The result of the Three Mile Island incident was reform, but ultimately, the safest approach with nuclear energy would be to limit the number of reactors in the world so as to limit the risk of a nuclear disaster.

Iceland’s Geothermal Energy

Iceland and Geothermal Energy

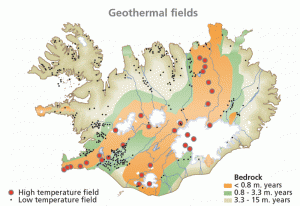
Iceland is a geologically young country that is home to more than 200 volcanoes. Though it is one of the most techtonically active places on earth and has frequent earthquakes, rarely are these damaging. See the map of Iceland’s geothermal fields.

geothermal-fields

Generating Electricity

There are currently 7 geothermal locations from which electricity is being generated in Iceland. Three of these locations, Bjarnarflag, Svartsengi, and Krafla, have been online and producing energy since the 1970s and 1980s. It was not until 1997 that Nesjavallir was brought online, and this effectively doubled the amount of geothermal electricity Iceland was generating. The more recent addition of 3 other locations has increased the amount of geothermal electricity being generated in Iceland from just less than 500 GWh/year in 1997 to over 5,000 GWh/year in 2012.

Iceland_Geothermal_facility
This is a picture of the Svartsengi geothermal power station.

Generating Heat

Space Heating

A main use of geothermal energy for heat in Iceland is for space heating. Currently, households of 89% of the Iceland population are heated using geothermal energy. Although this represents a dramatic increase in the share of heating energy from geothermal heat since the 1970s, the rate keeps increasing, and Iceland is expecting to increase it to at least 92%. Heat pumps, which pump the heat one location to another, have not needed to be used in Iceland, since sufficient cheap geothermal water for space heating is commonly available.

Heating Greenhouses
Screen Shot 2016-02-28 at 8.56.27 PM
This picture shows a greenhouse in Hveragerdi, Iceland.

Even though space heating is important, in Iceland, another important use of geothermal heat is to heat greenhouses. Geothermal heating of greenhouses started in 1924, and the naturally heated soil grows potatoes and vegetables. Geothermal steam is used to boil and disinfect the soil.

Conclusion

Iceland is lucky to have so much geothermal energy available, and it is doing its best to use it for generating electricity and heat. The Icelanders are trying to get the most out of their available geothermal energy by building many power stations and using the energy to power both industry and households.

Thermoelectric Devices: What They Are & Examples

What is a thermoelectric device?

A thermoelectric device creates voltage when there is a different temperature on each side. The thermoelectric effect is the direct conversion of temperature differences to electric power and vice-versa. When temperature differences are converted directly into electricity, this is called the Seebeck Effect.

A thermoelectric generator

One common thermoelectric device is a thermoelectric generator.

Thermoelectric

In this setup, there is a heat source on one side, and the other side is cool (see figure).  If a heat source is provided, it causes the movement of power current through the circuit. Hot carriers diffuse the hot end to the cool end and vice versa. Adding the heat source and allowing for this movement to begin causes the generation of electricity.


Example of a Thermoelectric Device – a Thermocouple


A thermocouple is a couple of metals that are joined together, or coupled, for measuring heat. Thermocouples are widely used in science and industry because they’re typically very accurate and can operate over a large range of temperatures from extreme hot to extreme cold. Metals used in thermocouples include iron, nickel, copper, chromium, aluminum, platinum, rhodium and their alloys.

Different Applications of Thermoelectric Devices

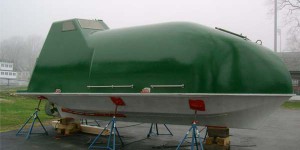
Thermoelectric devices are used in larger machines as part of power generation. A great example of this is a diesel engine. The Thermoelectric Project in Maine aims to “recover waste heat from large marine Diesel engines using Thermoelectric technology.” Initial research was done using Maine Maritime’s vessel Friendship during an initial feasibility study. Their “green machine” works to recover energy.

The Green Machine

Another application is Seiko’s Thermic watch, which uses body heat to power its thermoelectric device.

Seiko_Thermic

Only 500 of these were made, and this was back in 1998. They cost over $2,500 when they were available.

Conclusion

Thermoelectric devices are a way of converting temperature to energy. Thermoelectric devices are commonly used in diesel engines, but have a lot of other uses. The Thermoelectric Project in Maine and the Seiko watch are some examples of creative uses of thermoelectric power.

Solar Experiment

Goal of Class Activity

The goal of this class activity was to look how light intensity affects voltage on a solar cell, and how color filters will affect the voltage on a solar cell.

The Experiment

In this experiment, there was a solar cell hooked up to to a monitor that recorded the level of voltage coming to the cell. This experiment was to see if shining a flashlight on the solar cell affects the voltage, and also, if using colored filters between the light and the solar cell affects the voltage.

Introduction

In this study, we looked at two conditions. In the first condition, which was light intensity, we collected data through five trials. In the second condition, which was colored filters on the light, we collected four measurements.

Methods

To conduct the experiment, we first made sure the solar cell was working and that voltage was being recorded. Next, we took a flashlight and shined it on the solar cell for 10 seconds from a distance of 0 cm, and took a measurement. Each voltage measurement was actually 10 measurements, which we averaged into one measurement. Next, we moved the flashlight to 4 cm away from the solar cell for 10 seconds, and recorded the voltage. We also recorded voltage for the flashlight being at the following distances from the solar cell: 8 cm, 12 cm, and 16 cm.

Next, we obtained four colored filters, one in purple, one in pink, one in yellow, and one in red. First, we fixed the purple filter to the flashlight, and then shined it on the solar cell at a distance of 0 cm for 10 seconds, and recorded the voltage. We repeated this process using the yellow filter, the pink filter, and the red filter.

Sample Calculation

As described above, for each voltage measurement, there were actually 10 measurements, and these were averaged together. We didn’t keep the original 10 measurements, but for example, for the first condition at 0 cm, the average voltage was 0.469.

Results

First, here is the table of results from the first condition:

Screen Shot 2016-02-23 at 4.24.11 PM

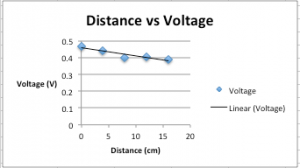
As can be seen by the table, data were gathered at distances of 0, 4, 8, 12, and 16 cm. The resulting voltage was plotted on the y-axis against the distance in cm, which was plotted on the x-axis (see below).

Screen Shot 2016-02-23 at 4.53.50 PM

There was a negative correlation between distance and voltage, meaning that the further away the light source was, the lower the voltage was.

Next, data were collected about the voltage output at 0 cm distance using four different color filters over the light source. The table below shows the results.

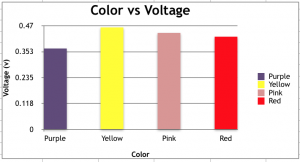
As can be seen by the table, the lighter colors yellow and pink were associated with higher voltage, and the darker colors purple and red were associated with lower voltage. This may be more apparent in the chart below.

Screen Shot 2016-02-23 at 4.23.50 PM

Conclusion

In conclusion, as the light source was moved away from the solar cell, the voltage went down. Also, as darker colored filters were placed on the light source, the voltage went down. For solar energy, it is best to have either no filters or light-colored filters on the light source, and to have the light source be as close as possible to the solar cell.