Goal of Class Activity
The goal of the class activity was to compare manual measurements with measurements taken digitally to see the rate of errors.
The Experiment
Introduction
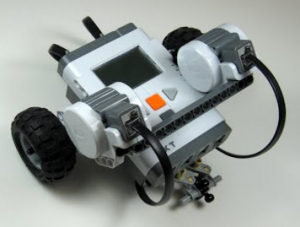
We had a Lego car with a sensor in the wheel. We used a program to visualize what the sensor was recording as the car went along. Tufts University Center for Engineering Education and Outreach posted an example of the apparatus we used, and there is a picture below.
Methods
The computer program was called a virtual interface, or VI. We first had to measure the wheel manually and compute its circumference. Then, we ran the VI and recorded the results. The VI digitally recorded measurements of the wheel rotation (number of turns) and degrees, the time it took for the wheel to turn (in seconds and milliseconds), and the distance the car moved.
Next, we measured the same items with a ruler (manually). We did this experiment a t0tal of 9 times and looked at the discrepancies between digital and manual measurements.
Sample Calculation
The error was calculated by comparing distances measured between the VI and the manual measurement. The formula for error used was [(VI-M)/((VI+M)/2)] * 100 where VI is the VI measurement, and M is the manual measurement.
Results
The results for 9 trials are below.

Conclusion
There was more error than I expected between the VI and the manual measurement. This is similar to the real-life situation I blogged about, where California’s electrical grid started using new digital meters, but they were found to be inaccurate.