DATA:
| Speed (RPM) | Battery Discharge (mV) | Mass (kg) | Power Level (%) | Time (s) | Acceleration (RPM/s^2) | height (m) | g | Potential Energy (J) | Power (W) |
| 101.8302 | 69 | 0.25 | 75 | 4.28 | 23.792107 | 0.25 | 9.81 | 0.613125 | 0.143254 |
| 81.02994 | 41 | 0.25 | 75 | 2.026 | 39.995037 | 0.25 | 9.81 | 0.613125 | 0.302628 |
| 83.21144 | 69 | 0.25 | 75 | 2.051 | 40.571156 | 0.25 | 9.81 | 0.613125 | 0.29894 |
| 90.48324 | 41 | 0.19 | 75 | 2.028 | 44.61698 | 0.25 | 9.81 | 0.465975 | 0.229771 |
| 92.49195 | 27 | 0.13 | 75 | 1.656 | 55.852626 | 0.25 | 9.81 | 0.318825 | 0.192527 |
| 97.0276 | 27 | 0.07 | 75 | 1.57 | 61.80102 | 0.25 | 9.81 | 0.171675 | 0.109347 |
| 99.26762 | 27 | 0.07 | 75 | 1.684 | 58.947516 | 0.25 | 9.81 | 0.171675 | 0.101945 |
| 47.24775 | 41 | 0.25 | 50 | 3.591 | 13.157268 | 0.25 | 9.81 | 0.613125 | 0.170739 |
| 81.71883 | 55 | 0.25 | 75 | 2.013 | 40.595543 | 0.25 | 9.81 | 0.613125 | 0.304583 |
| 102.8455 | 83 | 0.25 | 90 | 1.64 | 62.710688 | 0.25 | 9.81 | 0.613125 | 0.373857 |
| 125.0974 | 55 | 0.25 | 100 | 1.283 | 97.503841 | 0.25 | 9.81 | 0.613125 | 0.373857 |
Explore Newton’s 2nd Law
Keeping the power level fixed and changing the mass. Does the acceleration vary with mass?
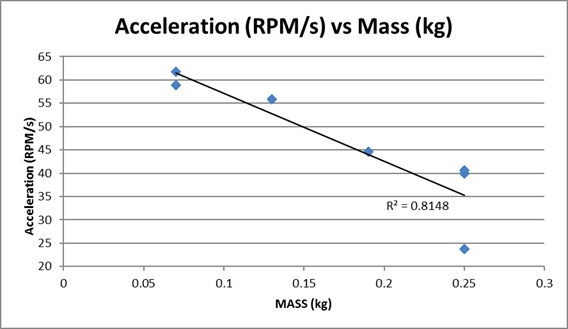
Increasing mass decreases acceleration. This agrees with Newton’s Law F = ma. If F is staying constant, as mass increases, acceleration must decrease to balance it out.
Keep the mass fixed and change the power level. Does the acceleration vary with power level?
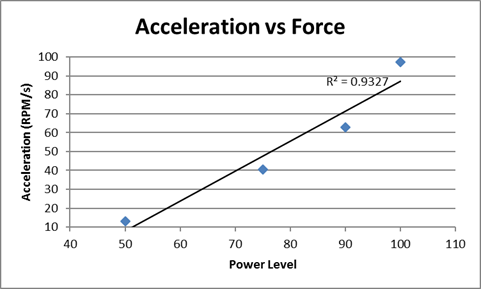
Increasing the power level does increase the acceleration. Again, looking at F = ma, if F is increasing, yet mass is staying the same, acceleration must also increase in order to keep both sides of the equation equal.
Explore the Law of Conservation of energy
With the power level fixed, study how the battery energy drainage changes as a function of mass. Since the energy of the battery is converted to the potential energy of the masses, you would expect that the greater the masses, the greater is the battery drainage. However, the battery level reading is not that accurate, so you should repeat your measurements several times and look at the average battery drainage as a function of mass.
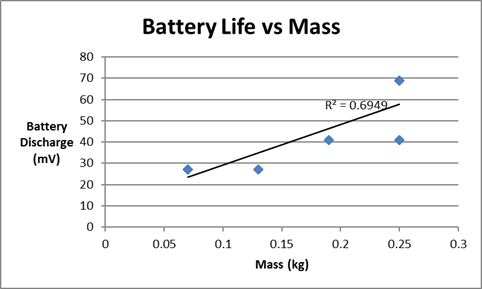
Our chart supports the theory that as mass increases the discharge of the battery also decreases. In other words, a heavier mass will cause the battery to drain more because of the increase of power required to raise it up a certain height. Work equals force multiplied by displacement. A larger mass means a larger force will be required meaning a larger amount of work. This work is what causes the battery to drain faster. Imagine it like this. Imagine trying to give a piggy-back ride to a child to the top of a hill versus trying to give a piggy-back ride to a full grown adult to the top of the same hill. The distance you have to travel is the same, but a lot more work is going to be needed to carry the adult all the way up, and as a result you will be a lot more tired by the time you get to the top. You’re lack of energy once reaching the top is the same as the battery being drained.
Calculate the average power used by the motor for each of your experiments. For the same mass, plot power used as a function of the power level of the motor. Add a linear trend line (with equation and R2 indicated). Describe this curve. Is it what you expected?
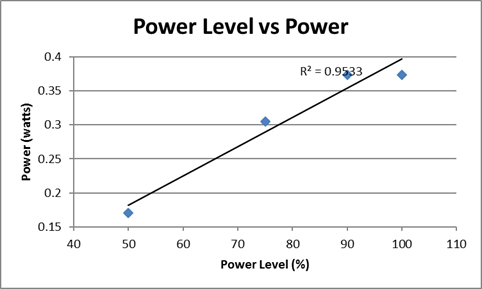
Yes this graph is what you would expect from this situation. Increasing the power level of the motor would also increase the power. We know that Power = Energy / time AND Force = Mass * Acceleration AND Work = Force * Displacement. Knowing these three equations we can figure out that this is what is to be expected. Increasing the power level is the same thing as increasing the force. This increased force increases the work done by the pulley. With work and energy being basically the same thing for our purposes (technically they both have the same magnitude, just different signs – or +), increasing the energy means the overall power of the equation will also increase. To add on even more to this, increasing the power level also decreases the time. So in the power equation the numerator is increased while the denominator is decreased, making the power even larger.
Through this experiment and graphs we are supporting Newton’s theory of force and laws of conservation of energy.
This blog is clear and very descriptive of the set up of the experiment. You did a good job at summarizing the main points and concluding the relationships between the variables. After looking at your data it is very similar to the same results that my group got during the experiment. Your Battery Discharge VS Mass graph caught my attention. Unlike my results where our graph was very linear your graph is slightly more inconsistence. I think your graph is a good demonstration of how the Battery Discharge data is not always the most accurate and at times can give you results that are just logically incorrect. I really like how you explained in great detail the relationship between Battery Discharge and Mass by using the piggy-back ride example. It is a great comparison for a person who doesn’t have a lot of physics background. In conclusion, nice blog! You should further discuss how this experiment is related to the concept of Energy in order to make it a more reflective blog.
Awesome blogs the graphs really helped me understand. LOVE IT
The blog does a very good job at relating the lab back to basic theories that were taught in class. I liked how there were a lot of data points so the graphs could be much more accurate. Not only that but each graph has it own explanation and a breakdown to help one understand the concepts.