MIT tour

The MIT  nuclear reactor tour was a great way to see first hand how nuclear energy was produced and what the process was. Although I was a bit confused, the tour throughout  helped to clear this up a bit as our leader led us through the different parts of the reactor. Seeing the machines up close and hearing how they operated was a surreal experience, and a little bit scary.  However, it made me feel better that the lab is used only for  research and not to generate power. Still, walking into the reactor was intimidating and I felt worried. Perhaps this was because  the facility was locked down with a lot of security, and had to have prior personal information about us if we were to enter the facility. When we were checked in we were given a device that monitored radiation called an embitter. We were instructed to carry this on us at all times and to leave our cellphones and other personal belongings in a room outside of the reactor. This was a bit alarming to me, and made me realize how seriously the production of nuclear energy needed to be taken. It made the experience very real for me.


I thought it was really interesting how they were able to add things directly to the reactor to see the reaction as it seems very beneficial to the facility’s research. Furthermore, the fact that they used to use the reactor to treat cancer patients was very intriguing and good to hear. I was eager to learn more about the process and disappointed to hear that although it was very effective, they had stopped treating patients due to cost. When we went downstairs in the reactor, we got to see where the patients were treated, which was a bit spooky, but also very cool! This was probably the most interesting part of the tour for me because it was a real life application of the things we were learning about nuclear energy in class!


Fukushima Daiichi nuclear disaster and Japan’s new energy strategies

Following the Great East Japan Earthquake of magnitude 9.0 at 2.46 pm on March 11, there was considerable damage in the region which was only increased by the large tsunami that was created as a result. “The earthquake was centred 130 km offshore the city of Sendai in Miyagi prefecture on the eastern cost of Honshu Island (the main part of Japan), and was a rare and complex double quake giving a severe duration of about 3 minutes.”. Furthermore, the tsunami destroyed 560 sq km and resulted took the lives of over 19,000 people. There was also a lot of damage to coastal ports and towns, including the destruction and collapsing of over a million buildings.T he Fukushima accident was rated 7 on the INES scale, due to high radioactive releases over days 4 to 6 days.

Screen shot 2014-04-30 at 11.42.47 AM Screen shot 2014-04-30 at 11.44.02 AM

The area was evacuated by more than 100,000 people  for fear of radiation sickness from the nuclear disaster. Moreover, other major issues concerning this event include the highly radioactive water in the basements of reactors 1-3, signifying damage to the reactor pressure vessel. The leakage was not able to be explained but was must likely a result of the reactor core. Also, the evaporated sea water  can clog the cooling pipes and weaken the cooling effect, which is concerning.

What happened in the reactors was this:

It began flooding and almost all power was lost along with workers getting killed instantly while the water began entering the station. Then, the cooling system failed  and in the now damaged control room, workers found out that the pressure levels were increasing and that they needed to bring the pressure down to prevent disaster.  These reactors  have pressure release valves that are used to release pressure, the valves were ordered to be opened  in order to release pressure into the air. Inside of the plant, however, scientists argued against this plan because if steam were to be released into the air, this steam would carry radioactive material. But, they were under orders and set off to find the valve with only lanterns to guide them. Then, reactor number one exploded from the post quake which dramatically increased radiation levels and  two days later, an even larger explosion effects reactor 3, causing radiation levels to rise even higher and when reactor 4 exploded the next day, everything began melting. Then, the three safety measures taken to cool everything failed.

This is in inside of a reactor:

Screen shot 2014-04-30 at 12.05.32 PM


“when the power failed at 3.42 pm, about one hour after shutdown of the fission reactions, the reactor cores would still be producing about 1.5% of their nominal thermal power, from fission product decay – about 22 MW in unit 1 and 33 MW in units 2 & 3. Without heat removal by circulation to an outside heat exchanger, this produced a lot of steam in the reactor pressure vessels housing the cores, and this was released into the dry primary containment (PCV) through safety valves. Later this was accompanied by hydrogen, produced by the interaction of the fuel’s very hot zirconium cladding with steam after the water level dropped.

As pressure started to rise here, the steam was directed into the suppression chamber under the reactor, within the containment, but the internal temperature and pressure nevertheless rose quite rapidly. Water injection commenced, using the various systems provide for this and finally the Emergency Core Cooling System (ECCS). These systems progressively failed over three days, so from early Saturday water injection to the reactor pressure vessel (RPV) was with fire pumps, but this required the internal pressures to be relieved initially by venting into the suppression chamber/ wetwell.”

http://www.world-nuclear.org/info/safety-and-security/safety-of-plants/fukushima-accident/


As a result of this disaster, Japan has been developing new energy strategies. These strategies include the following:

  • reducing in the oil-dependency rate to 40% or less by 2030 from the current 50%,
  • promotion of nuclear energy, and securing of energy resources abroad through the fostering of more powerful energy companies
  • promotion of nuclear energy
  • new plants to replace old ones
  • the  increasing the ratio of “Hinomaru oil”, or oil developed and imported through domestic producers, from the current 15% to 40% by 2030. To achieve that goal, the new strategy emphasizes the need to foster Japanese oil majors that can compete with foreign rivals.
  • the restart of reactors

http://www.atimes.com/atimes/Japan/HA13Dh01.html

Cabinet’s new energy plan praised by pro-nuclear U.S.


Iceland’s use of geothermal energy for heat and electricity


Our world has become quite polluted over time as a result of our waste materials from generating heat and electricity. Inevitably, we are headed toward global warming. Luckily, there are many advances in alternative energy sources and in this post I will be talking about geothermal energy in particular. Geothermal energy is the process of taking heat from the earth and converting it into energy that can be used as a source of electricity and heat. Recent technological advancements have allowed the utility scale to produce 12 million US households worth of energy that is cheaper and cleaner than other ways of producing electricity.  Geothermal energy is created when Earthquakes create magma movement and break up rocks below the Earth’s surface, which his allows hot water to circulate and rise to the Earth’s surface so the heat from the water is used to produce electricity (as seen in the image below).

image


The following image from truegreengeo.com shows how geothermal energy is acquired.GeothermalComesFrom


Currently, Iceland is the “pioneer” in the use of geothermal energy throughout the world as it has 5 geothermal power plants; Iceland generates 25% of its energy and roughly 85% of the country’s heat from geothermal systems ! This high level of productivity from the geothermal sources is mostly created through steam, which is naturally occurring due to the high amount of volcanic activity and hot springs in Iceland, which are around 150 degrees Celsius. Because the ground is unstable due to the volcanic activity, however, the plates are frequently moving and thus causing earthquakes. According to the National Energy authority, “During the course of the 20th century, Iceland went from what was one of Europe’s poorest countries, dependent upon peat and imported coal for its energy, to a country with a high standard of living where practically all stationary energy is derived from renewable resources. In 2011, roughly 84% of primary energy use in Iceland came from indigenous renewable resources. Thereof 66% was from geothermal.”


Clearly, there is a lot to look into with Iceland’s success with geothermal energy!


http://www.nea.is/geothermal/

Stirling Heat Engine, Peltier Device, and their modern-day applications

The Stirling Heat Engine was created by Robert Stirling in 1816 and has the potential to be much more efficient than a gasoline or diesel engine. Unlike the internal- combustion engine, the Stirling Engine uses Stirling cycle. The Stirling cycle consists of an external heat source, which can be many different things like gasoline or solar energy or the heat produced by dying plants. However, no combustion takes place inside the cylinders of the engine! Furthermore, the gasses that are used inside the engine never leave the engine. There are no exhaust valves that create high-pressure gasses, thus, there are no explosions and the Stirling engines are very quiet. Also, there is a fixed amount of gas in the engine. What happens is that there are certain things that happen inside the engine that change the pressure of the gasses and cause them to do work.

There are two different types of Stirling Engines, the displacer type and the two piston type. The displacer is consistently heated by a heat source below the the displacer piston and is cooled above it. On the other hand, the two piston is continuously heated above the hot piston and cooled above the cold piston.

Here are pictures of  sterling enginse from The American Stirling company.

The Displacer Type

tech2

The Two Piston Type

tech1

http://http://auto.howstuffworks.com/stirling-engine1.htm

Here, you will find a moving diagram of how the engine works as well as  the two different types of Stirling Heat Engines and their processes.

Today, there are only three main uses of the sterling engine. These are Submarine engines, cryocoolers, and they are also found in classrooms.

http://www.stirlingengine.com/faq/#1

The Peltier device, often referred to as a  Thermoelectric cooler, due to its  thermo electric facets was created in 1834 by a scientist that built upon the opposite of the Seebeck effect. He found that taking a thermocouple and applying voltage would cause temperature difference between the two. How it works is that the device pumps heat from one side to the other using an abundance of electric power. A module flow of direct current moves heat from a side of the module to the other which in turn cools one side while heating the other. “A single stage can make a temperature variation of 70 degrees Celsius, and more than 100 degrees Celsius in a multistage unit.”

http://www.heatsink-guide.com/peltier.htm

This is what the Peltier device looks like:


peltier01

and this the internal part of it:

peltier_effect_diagram

www.customchill.com

Uses for the Peltier Device today are most commonly in devices that require heat removal ranging from various ranges. For instance they can be used in something as small as a beverage cooler to something as large as a submarine.


Solar Cell Activity

Last friday in class, we continued our Robotics lab with a new solar cell activity! In this lab, we measured light from varying distances and recorded the changes in power. Next, we added color panels to see if we could get even more variables. In order to do this, my partner and I used our solar cell connected to our robot, a ruler, a flashlight, different colored panels, and of course, LabView. Below is a picture of our solar cell connected to our robot!

Screen shot 2014-02-27 at 9.46.31 PM


The solar cell is the little black box, which at first glance may look simple. However, after conducting the experiment I was able to see the way the cell actually worked and understand the complexity!


Our instructions were to hold the ruler up to the power cell and shine the light on the cell from varying distances above it. Then, with the help of LabView (thank god!), we were able to obtain the variances in data when we measured the light further away from the cell. We then did the same with the five different color panels we got from Professor Sonek. The panels looked like this:

Screen shot 2014-02-27 at 9.48.29 PM


When we started, we did not see much variance in the data. This was concerning as the whole point of the lab was to compare the data. However, after a few trial runs, I began to understand how to correctly obtain the data.  When we got a hang of the lab, we took data from shining the light at 8cm, 16cm, 21cm, and finally, 32cm. From these different distances, the effect of the distance of the  light on the power  cell was quite clear. When we began to add the colors, I guessed that they would not change much, however, I was sadly mistaken. The color panels actually did affect the data. I could not wrap my head around the fact that just because a panel was a different color, the power levels would be different! I would love to look more into this.


Anyways, our next task was to enter the data in excel and create graphs. This was perhaps the scariest part for me as I’m not an avid excel user and I really really really dislike graphs. After taking a deep breath and asking some questions, however, it all began to make sense to me. Maybe science isn’t so bad after all….


Our data appeared like this

Screen shot 2014-02-27 at 9.53.59 PM

 After entering in the data, we were asked to find the averages of each so we could graph them. These were the averages we came up with using the formula (=average(x1-x9)) to have excel calculate each string of data:
Screen shot 2014-02-27 at 9.55.39 PM
The final step was to graph our data. This part was very confusing, but also fun to learn. With the assistance of my partner, and Professor Sonek, we created two beautiful graphs (that I am SO proud of, haha) :
Screen shot 2014-02-27 at 9.57.43 PMScreen shot 2014-02-27 at 9.57.51 PM
On the left graph are the results from our no color trials and on the right are the results from our colored panel trials.
While this lab was a bit more confusing than the last few, it was more enjoyable for me and easier to understand when broken down into parts. It was also perhaps the most interesting lab we have done this far, as I am still shocked about the effects of the color panels! I’m looking forward to this week’s lab.
Until then, folks!
Screen shot 2014-02-27 at 10.01.57 PM

Blog Post #5: Solar Energy Around The World

Solar energy is the cleanest and most abundant energy source available in today’s day and age. Solar energy can be used for generating electricity, providing lighting, and heating water for domestic, commercial, and industrial use. What’s even more positive about solar energy is that it can be created in many different ways! According to seia.org, “there are several ways to harness solar energy: photovoltaics (also called solar electric), solar heating & cooling, concentrating solar power (typically built at utility-scale), and passive solar.” The first three of these, which are active solar systems, use electrical devices to convert the sun’s heat and light to usable sources of energy. The others are passive solar systems, which are made to collect energy from the sun’s heat and distribute it without the use of moving parts. This kind of energy is a flexible technology as “solar power plants can be built as distributed generation (located at or near the point of use) or as a central-station, utility-scale solar power plant (similar to traditional power plants).” The utility scale plants can even store the energy for use after the sun sets!!

Screen shot 2014-02-20 at 10.27.13 PM


http://www.seia.org/about/solar-energy

Due to the fact that solar energy is renewable and thus, will never run out, countries all of the world have been converting to using solar power. Below is a graph of the countries with the most installed solar energy.

Screen shot 2014-02-20 at 10.34.06 PM

Solar Energy Statistics


As you can see, Germany is the leading country in the Solar Energy industry, and its use is continuing to grow!  According to planetsave.com, “During 2009, Germany installed eight times more megawatts of photovoltaics solar energy capacity than America did that year.” While Germany has already converted much of its energy to solar, installing thousands of solar panels, the country plans to rely only on renewable energy by 2050. Recently, German solar farms produced a world record of 22 gigawatts of energy which is equivalent to the output of 20 nuclear plants. An image of the farms can be seen below:

Screen shot 2014-02-20 at 10.48.33 PM

Germany Smashes Solar Energy Records


Read more at http://planetsave.com/2012/03/06/top-6-countries-using-solar-energy/#Qyo0O8EJIEKwol5d.99


Just behind Germany is spain, which gets 10% of its energy from solar power. In fact, Spain was once the leader in solar power. Furthermore, the Vatican has the larger solar power plant in Europe! “Although it is the smallest country in the world, the Vatican has spent $660 million to build a massive 100MW photovoltaic installation. The output will be more than enough to provide enough power for the whole country.” This is an incredible step forward into solar energy. Below, is an image of the solar power device in the Vatican.

Screen shot 2014-02-20 at 10.45.24 PM


Over the next few years, it will certainly be exciting to watch countries convert to solar energy! Clearly, this is already happening and proving to be a success in creating more renewable energy in order to save our beloved planet earth. I will most definitely be looking more into this topic!


Blog Post #4: Electricity Generation from coal-fired, natural gas, and nuclear power plants.

Today’s blog post will be focusing on the generation of electricity. While there are many different ways that electricity can be generated, the three I will explore today are electricity Generation from coal-fired, natural gas, and nuclear power plants. Through each individual process of generation, one can see the benefits and downfalls of each type of power plant.

1. Coal-fired power plants.

In coal-fired power plants,water is turned into steam, which then causes turbine generators to produce electricity. There are few steps to this process. First, heat must be created by reducing it to the fineness of talcum powder. After mixing it with hot water and air, it is put into the firebox which provides the maximum heat. Next, water is pumped through the pipes into the boiler, which in conjunction with the heat, creates steam that gets up to 1,000 fahrenheit. Then the steam creates a pressure that goes against a  series of giant turbine blades which turn the turbine shaft, which is connected to the shaft of the generator , where electricity is produced. Finally, the steam enters a condenser where millions of gallons of cool water from a nearby source  are pumped through a network of tubes running through the condenser. The cool water then turns the steam back into water so it can be used again to repeat the cycle.

Here is an image of the coal-fired power plant in its entirety:

Screen shot 2014-02-13 at 3.59.44 PM


Although low cost and versatile, coal-fired plants create high levels of pollution which causes health threats to society, and obvious destruction in nature. Furthermore, coal is not a renewable energy source. As you can see, there are many benefits and downfalls of coal-fired power plants.

http://www.duke-energy.com/about-energy/generating-electricity/coal-fired-how.asp


2. Natural Gas power plants

There are three types of natural gas power plants. They are steam generation, simple cycle, and combined cycle.  Similar to a coal-fired power plant, the steam generation plant uses natural gases to create steam that causes the turbines to spin and create electricity. The simple cycle plant burns natural gas to produce a high pressure gas that spins the turbine and convert electricity. These plants are used in times of high demand because of their short start-up times, however they are not very efficient in converting heat into electricity. Combined cycle plant use a heat recovery steam generator and simple cycle turbines to power itself.  In this plant, gas is burned to create high pressure gas and the excess heat from that process is captured and used to generate steam to spin a steam turbine. This plant is the most efficient of the natural gas plants, but due to its longer start up time, it is not used for the majority of the time.

Here is a picture of the three different kinds:

Screen shot 2014-02-13 at 4.23.59 PM


According to AEP.com, “The International Energy Administration (IEA) indicates that combined cycle gas plants have a higher average efficiency than coal plants. Simple cycle plants have efficiencies ranging from 35 – 42% and combined cycle plants have efficiencies of 52 – 60% compared to efficiencies of up to 46% for supercritical coal plants and 50% for ultra supercritical coal plants.”

Clearly, the natural gas plant is a better option than coal.

http://www.aep.com/about/IssuesAndPositions/Generation/Technologies/NaturalGas.aspx

3. Nuclear power plants

The nuclear power plant is a thermal power station heated by a nuclear reactor. The heat produced by the reactor produces steam to spin the steam turbine which is connected to a generator the produces electricity. The nuclear power plants produce around 20% of our nations power!  Although this system sounds simple, they are the most complex and sophisticated energy generators. According to ,Jan Willem Storm van Leeuwen  “A fundamental issue contributing to a nuclear power system’s complexity is its extremely long lifetime. The timeframe from the start of construction of a commercial nuclear power station through the safe disposal of its last radioactive waste, may be 100 to 150 years.” Furthermore, nuclear power plants also pose a threat to the health and safety of the public living near the plant. “The major hazards to people in the vicinity of the plume are radiation exposure to the body from the cloud and particles deposited on the ground, inhalation of radioactive materials and ingestion of radioactive materials.” A high exposure to radiation could cause death or serious illness. For this reason, the government has an emergency response plan in the event of a nuclear power plant incident.

Here is a picture of the Nuclear power plant:

Screen shot 2014-02-13 at 4.51.46 PM

www.tmaa.go.tz

http://www.ready.gov/nuclear-power-plants


Blog Post #3: Germany’s Green Energy Policy

Upon initial research on Germany’s green energy policy, I was very surprised to see that it was a policy that was not going well at all . This was shocking because one would think that any move towards green energy in today’s day and age would be positive and an improvement. After reading many articles, however, I found that this “improvement” in energy actually turned out to be a fluke.

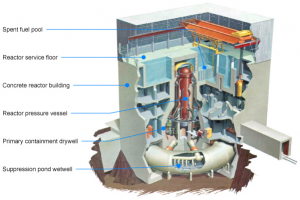
The whole idea behind Germany’s green energy policy, or as they call it, Energiewende, which means energy transformation, is to transition from nuclear and fossil fuels to renewable energy sources in order to reduce green house gas emissions. This policy came into consideration in the 80s, was put into policy in 2000, and became increasingly more prominent after the Fukushima disaster in March 2011. As a result of the hurried pace of the policy, Chancellor Angel Merkel was forced to end nuclear power, closing seven reactors, which was initially set by the government to phase out by  2022. In The Economist’s article on Germany’s green energy policy, it states that “Germany reaffirmed its clean-energy goals—greenhouse-gas emissions are to be cut from 1990 levels by 40% by 2020 and by 80% by 2050—but it must now meet those targets without nuclear power.” Clearly, Germany’s ambitious goals of cutting greenhouse gas emissions are now going to be more difficult as their Energiewende poses many problems for the government’s plan. Even the chancellor herself admits that Germany may be in too deep, calling the policy a “Herculean task”.

Screen shot 2014-02-06 at 9.59.14 PM


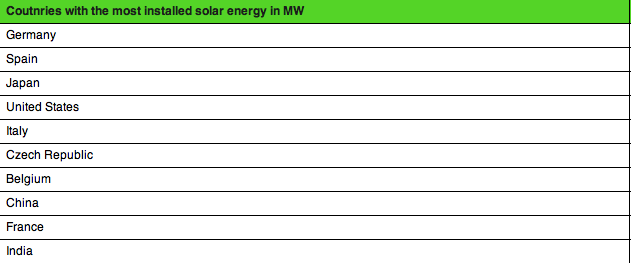
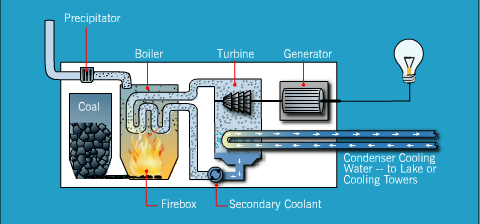
Although this image from theenergyconnective.com, which was featured on the front page of The Washington Post, makes Germany’s policy appear attractive and functional, there are facts that state otherwise.

First, let’s consider that Germany produced more energy by coal than it has in a quarter century! While the government’s policy claims to be seeking new renewable energy sources, it is evident that Germany has spent much of its’ time and resources mining for coal instead of looking for sources of green energy.

Screen shot 2014-02-06 at 10.25.16 PM


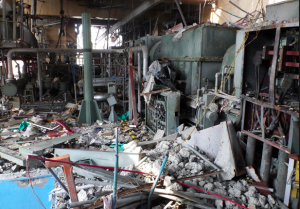
This comic, featured in dissentmagazinge, shows the irony of how Germany’s plans to help the country have blown up in their faces (quite literally). The smoke is representative of all of the excess coal it has been burning in the process of looking for new energy sources, which has lead to a rise in CO2 levels.

Next, there’s the fact that as a result of this coal burning, carbon dioxide levels have grown increasingly larger. According to the-american-interest.com, “Germany’s carbon dioxide emissions, which rose from 917m tonnes in 2011 to 931m tonnes in 2012, are estimated to show an increase of 20m tonnes when figures are tallied for last year.” This is a huge increase that seems to be going in the opposite direction of the ultimate goal of the Energiewende!

Screen shot 2014-02-06 at 10.24.01 PM

Furthermore, the costs are rising very fast, which may pose yet another problem to the policy. Germany’s minister of public economics that the country’s energy intensive industry may begin to look for cheaper prices as prices are estimated to climb to $32 billion in 2014 alone and will continue to climb upward.


Ultimately, Germany’s green energy policy is a big controversy throughout the world-it is even under investigation by the European Union for said policy. The Economist writes that, “it is hard to think of a messier and more wasteful way of shifting from fossil and nuclear fuel to renewable energy than the one Germany has blundered into. ”  This is due to the fact that the prices are high and will continue to grow, there are many risks involved, and some effects are already doing the exact opposite of what was intended. In fact, there may be a larger number of greenhouse gas emissions than was initially intended as well. However, some say that Germany can turn this around and become a leader in green energy. Perhaps there will be a transformation, or perhaps the Energiewende will, in fact, be a failure. While most evidence seems to push for a more negative outcome, one must always keep the positive in mind and have hope. Perhaps we will see Germany transform before our eyes-Only time will tell!


http://www.economist.com/node/21559667

http://hotair.com/archives/2013/12/19/germany-under-investigation-for-their-green-energy-policies/

http://www.the-american-interest.com/blog/2014/01/09/end-result-of-germanys-green-energy-policy-more-coal/

Robot Activities Blog #2

On Friday, January 31st, our class completed the second task with our Lego Robots. For this task, we had to measure the distance of our Robot’s travel and compare it to the LabView statistics, thus calculating our percentage error. Although we had to do less work in LabView, and focus more on our actual Robot and measuring the distance it traveled with a ruler.

When I initially saw what we had to do, I panicked. As I have mentioned before, anything that involves numbers or calculations is utterly terrifying to me. I hadn’t even used a ruler since middle school. Luckily, I got over my fear and jumped head on into the assignment. After Professor Sonek explained in detail the steps we would have to take in order to complete this activity, I felt more assured. The program on LabView was already set up for us, so we just had to type in the time and power of the robot. The Program looked something like this:

Screen shot 2014-02-06 at 4.14.25 PMScreen shot 2014-02-06 at 4.17.01 PM


As you can see, the area where we had to enter the power and time made the whole thing much less complicated as it was already set up for us.


We also had to use a ruler to measure it’s distance. That part was a bit hard at first as it was a difficult process that you had to really pay attention to in order to get the correct measurements. We had to redo our measurements many times due to inexact measurements. That process, which we did by hand in front of our computers, looked something like this:

Screen shot 2014-02-06 at 4.19.28 PM


Our group did not use paper or a marker to get a more accurate reading, which would have been very helpful. We used only our fingers, a ruler, and our own perception. Perhaps next time we can implement this method to prevent any inaccuracies. It looks like it would save a lot of time and frustration.

Then, we had to compare our measured to distance to the distance calculated by LabView. My partner and I recorded our own measurements next to those of LabView in our notebooks. LabView measured the number of wheel turns, distance, velocity while we measured merely the Robots distance in centimeters, which we had to convert to meters. My recordings, which were a bit unorganized looked like this:

Screen shot 2014-02-06 at 4.26.49 PM

We had to do the experiment three different times, each time using a different level of power and testing that level three times as well. The Formula we were given to calculate our percentage errors was:

[Distance(m)-Distance(LV)/(Dis(m)+Dis(LV)/2)]

In this equation (m) stands for the distanced we measured with the ruler and (LV) stands for LabViews measurements. I tried doing the equation out by hand a few times but kept getting it wrong. Like I said, I’m not good with numbers. Luckily, my partner knew how to use excel and put our calculations and the formula in to be calculated by excel. Our end result looked like this:


Screen shot 2014-02-06 at 4.04.57 PM


The last column represents our error percentages, which after comparing with other groups seemed off. We tried a few different things to get more accurate results, but ran out of class time. We are hoping to fix this next class.


Overall, I am proud of my completion of this activity, even if the numbers were off. I understood what we needed to do, and most of what we were doing while we were doing it. I even sharpened up on my math skills and learned how to better use excel.


Until next class, folks!


Screen shot 2014-02-06 at 4.33.00 PM

Blog post #2- Hurricane Sandy & Global Warming

On October 29, 2012, Hurricane Sandy struck land and sent many communities, especially those in New Jersey and New York into a whirlwind of destruction (quite literally). Although New Jersey and New York are the most talked about states that were impacted, there were more than a dozen states that felt at least some of Sandy’s destruction. Sandy was not only a hurricane, but also a post-tropical cyclone that was the cause of 117 deaths in the US and 69 between Canada and the Carribean. Sandy hit hard with strong winds, heavy rain fall, and storm surges, making this the second most expensive disaster in the US, right behind Hurricane Katrina. Unfortunately, it took many lives and  billions of dollars before some people began to open their eyes to global warming as a cause of such destruction.

Screen shot 2014-01-30 at 10.50.03 PM


Hurricane Sandy is a prime example of how climate change is affecting our world today, and can and will lead to much more damage to our earth if we don’t begin to fix the problem. Some scientists claim that the temperatures of the surface of the sea on the east coast caused a larger percentage of water vapor. Thus, the storm was able to produce more rain which made the flooding of the storm more destructive. This temperature change also led to a rise in sea level as there was a 13.2 foot storm surge in New York which intensified the storm even more. Furthermore, the temperature increase in Greenland  and the Arctic caused a dramatically larger sea ice and glacier melting rate. The melting of these glaciers is said to have  created a high-pressure system that blocked the North Atlantic and consequently pushed the hurricane toward the East Coast. Clearly, Even small changes in temperature, which may seem insignificant can cause dramatically dangerous effects to our planet.

This process can be seen in the image below:

Screen shot 2014-01-30 at 11.02.54 PM

As you can see, the effects of global warming can include more common storm surges, slower jet streams that block incoming weather for  a long time, and more active and intense storms. Ultimately, the more the temperature rises on earth, the more intense the storms will become as a result of higher temperatures, loss of ice, and rising sea levels. While Scientists can’t say that global warming is definitely the cause of Hurricane Sandy, there is an overwhelming amount of evidence proving that it is at least a factor.

Screen shot 2014-01-30 at 11.20.30 PM

Unfortunately, there are still many skeptics in the world who believe otherwise. Hopefully it won’t cost our planet even more destruction for everyone to open their eyes to this obvious problem. But, until then we must continue our research and note the connections between global warming and the deterioration of our planet in hopes of saving our wonderful planet earth from total destruction.

Screen shot 2014-01-30 at 11.18.29 PM


http://www.huffingtonpost.com/2012/11/06/hurricane-damage-climate-change_n_2081960.html

http://www.fema.gov/hurricane-sandy-timeline

http://www.cnn.com/2013/07/13/world/americas/hurricane-sandy-fast-facts/