By

Force, Mass and Acceleration

On Feb 5th, 2016, my teammate Daniela Galindo and I performed the pulley lab activity together using Lego robots. Our goals of the experiment was to study and understand the relationships between acceleration and mass with a fixed force, and between acceleration and force with a fixed mass. And most importantly, to explore the Newton’s Second Law of Motion, i.e. Force=mass x acceleration(F=ma).

We began the experiment by installing the battery of the robot, and connected it with the pulley and computer. Then we measured the height of the pulley from the base to the top using a ruler, which was 33 centimeters. After that, we launched the file provided by our instructor on the Labview, and we actually performed the experiment based on two different scenarios.
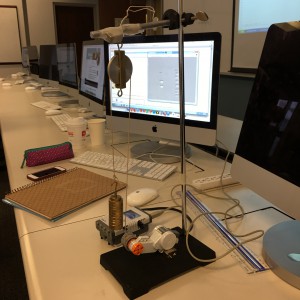
图啊

In the first scenario, we set the power on the program to be 60, and had the pulley to lift mass of 0.24kg object for 33 centimeters . We recorded time and acceleration from the computer, and then we repeat the experiment four more times using mass of 0.2kg, 0.15kg,0.1kg and 0.05kg. Following are the data and graph constructed for Scenario One.


data 

graph

We were expecting the acceleration to be varied with mass when we had the fixed amount of power. The data above shows the fact clearly, for examples, when mass is 0.24kg, acceleration is 18.2436 rpm/s, and when mass is 0.2kg, acceleration is 22.6958 rpm/s . Also, from the graph, after displaying the horizontal axis to be the mass and the vertical axis to be the acceleration. We see the red straight line on the graph indicating an inverse relationship between acceleration and mass. Namely, as the mass of the lifted objects increases, the acceleration decreases.

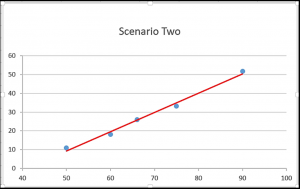
On the other hand, we did the scenario two with power levels of 50, 60, 66, 75 and 90, while had the pulley lifting a fixed amount of 0.24kg objects for all of the difference power levels. And here are the data and graph for the scenario two.

data 2


graph2

In the scenario two, we again got the result as we expected. The accelerations varied as we changed the level of powers, and we could see the results from the data as well. Furthermore, I displayed five difference power levels on the horizontal axis along with five difference accelerations on the vertical axis. And on the graph, we see as the value of the power increases, the acceleration also increases. Also, the red straight line on the graph indicates a positive linear relationship between accelerations and powers.

In conclusion, we concluded the force is indeed a function of mass and acceleration since two scenarios both supported the it. And the Newton’s second Law of Motion is true from the results of the experiment.


By

Energy Grid

In the modern world, people use cellphone, light, and almost every thing that required electricity. But where is the electricity come from? Well, it comes from the grid, which is a complex network of power plants and transformers connected by more than 450,000 miles of high-voltage transmission lines.gridAs we can see from the photo, electric power is generated at power plants and then moved by transmission lines to substations. A local distribution system of smaller, lower-voltage transmission lines moves power from substations to the customers.
The grid system is very important to us. Therefore, people need to constantly update, maintain and upgrade the infrastructures. The American Recovery and Reinvestment Act of 2009 provided the U.S. Department of Energy with $4.5 billion to modernize the electric power grid and to implement Title XIII of the Energy Independence and Security Act (EISA) of 2007. He has two largest initiatives are the Smart Grid Investment Grant (SGIG) Program and the Smart Grid Demonstration Program (SGDP.

Decades ago, people only used little amount of electricity for living. But today, we use a lot, and we need our grid to be smarter. The new Smart Grid allows for two-way communication between the utility and its customers, and the sensing along the transmission lines is what makes the grid smart. Like the Internet, the Smart Grid will consist of controls, computers, automation, and new technologies and equipment working together, but in this case, these technologies will work with the electrical grid to respond digitally to our quickly changing electric demand.

The benefits to smart grid is that it reduced operations and management costs for utilities, and further lower the costs for consumers. Another benefit is that the grid is more efficiency in transmission of electricity, and it can integrate with renewable energy systems, which helps in the globe warming.

Even though the Smart Grid does provide many benefits it does have negative aspects to it such as hacking. Because the Smart Grid is computer based, so there is potential risk that costumers’ information been stolen.

In conclusion, the Smart Grid is a great program for consumers, and also our environment. Although hacking is very bad, but nothing is perfect in the world. And as time goes by, we will develop a more secured way for the Smart Grid, with more feature, and more effective.


https://www.smartgrid.gov/the_smart_grid/smart_grid.html

http://energy.gov/articles/top-9-things-you-didnt-know-about-americas-power-grid

https://www.smartgrid.gov/recovery_act/project_information.html


By

Lego Robotics Activity

During the Friday class on January 29th, 2016, My teammate Daniela Galindo and I performed an experiment using Lego robot under the instructions of Prof. Sonek. Our goal of the experiment was to record the data of the robot movements measured by computer program called Labview and by ourselves. And to evaluate the percentage of errors between distance provided by program, and distance measured by our team using the formula:

formula

First of all, we installed the battery to the robot, and connected the robot with computer. Then, we used a ruler to measure the diameter of the robot’s wheel, which was 5.5 centimeters and we also calculated the diameter of the wheel, which was 0.1728 meters.

Diameter=5.5 centimeters X pi X (1 meter/ 100 centimeters)=0.1728 meters

After that, we launched the file, wheel rotation straight.vi provided by the our professor on the Labview, and set the diameter on the program to be 0.1728 meters. we placed the robot on the table and were ready to perform the lab.

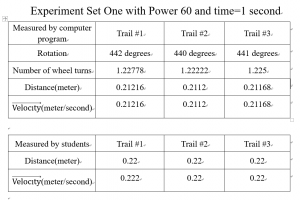
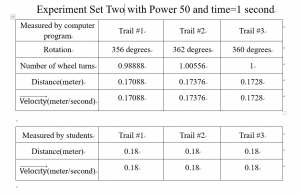
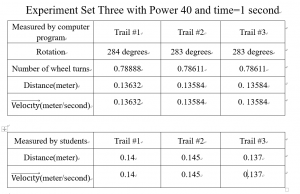
we set the power on the program to be 60 and time to be 1 second, and clicked run on the computer program. The robot moved from left to the right on the table, then we physically measured and recorded the distance robot traveled using the ruler. And also the data that the program gave to us. We did the same thing using power=60 and time=1 second extra two times. And then, we repeated the experiment using power=50, time=1 second and power=40, time=1 second both three times. The following data shows the results of each set of experiment.

power 60% of error of trail#1=(0.22-0.21216)/[(0.22+0.21216)/2] X 100% = 3.6283%
% of error of trail#2=(0.22-0.2112)/[(0.22+0.2112)/2] X 100% = 4.0816%

% of error of trail#3=(0.22-0.21168)/[(0.22+0.21168)/2] X 100% = 3.8547%

power 50

% of error of trail#1=(0.18-0.17088)/[(0.18+0.17088)/2] X 100% = 5.1984%

% of error of trail#2=(0.18-0.17376)/[(0.18+0.17376)/2] X 100% =3.5278%

% of error of trail#3=(0.18-0.1728)/[(0.18+0.1728)/2] X 100% = 4.0816%

power 40

% of error of trail#1=(0.14-0.13632)/[(0.14+0.13632)/2] X 100% =2.6636%

% of error of trail#2=(0.145-0.13584)/[(0.145+0.13584)/2] X 100% = 6.5233%

% of error of trail#3=(0.137-0.13584)/[(0.137+0.13584)/2] X 100% = 0.8503%

In conclusion, we found that the distances measured by the computer program and our team for all nine trails are difference, as we expected to have discrepancies for the experiment. And the discrepancies could be come from the measuring from our team, the defectiveness of the wheels or others.  Practically, we saw a positive relationship between the power of the robot and the distance it traveled, namely as the power of the robot increased, the distance it traveled also increased. Ultimately, Discrepancy was something that we should considered in our future experiments or in other field of study.

By

See the New World

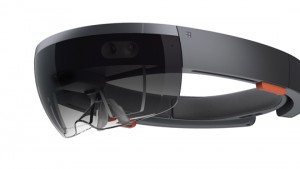
 We have seen hologram technology appears in many science fiction movies, and as we watching the movies, we probably think about that are holograms going to be true in the our lives some day. And after Microsoft released information about Hololens in 2015, we see that the possibilities of 3D holograms integrate with our world will be here shortly.8f64da9f-6c85-48fa-9e5d-f4652e287f9b

So, what exactly is Hololens? Well, Hololens is a smart glasses headset that is a cordless, self-contained Windows 10 computer. It uses advanced sensors, a high-definition stereoscopic 3D optical head-mounted play, and spatial sound to allow for augmented reality applications, with a nature user interface that the user interacts with through gaze, voice, and hand gestures.

https://www.youtube.com/watch?v=aThCr0PsyuA

The video above just shows some applications of Hololens, it can be used in 3D modeling, products designing, communicating, gaming and even teaching. and there will be even more because Microsoft is still developing new applications and improving the Hololens.

In the first quarter of 2016, the development edition of Hololens are releasing to developers in the United States and Canada for $3,000 per device. With the help from developers, Hololens will be the next hot electronic device in our world. And I am looking forward to seeing how our lives will be with Hololens.


References:

https://www.microsoft.com/microsoft-hololens/en-us

http://www.cnet.com/products/microsoft-hololens/

http://time.com/4190843/microsoft-hololens-demo-2016/


Skip to toolbar