By

Solar Energy

aaaaaa

Solar energy is radiant light and heat from the Sun harnessed using a range of ever-evolving technologies such as solar heating, photovoltaics, solar thermal energy, solar architecture and artificial photosynthesis. As now we care more about our planet, and CO2  emission, our society is progressive towards energy independence from fossil fuels and instead are accessing energy through wind, solar, geothermal and wave energy. And according to the International Energy Agency, by 2050 the sun could well be the world’s biggest source of electricity.


aaaaaa

In 2015, the U.S. solar industry installed 7,286 megawatts of solar power in 2015, which increase of over 1,000 megawatts of solar photovoltaic installations compared to 2014. One of the leader of America’s leaders in renewable energy is Prologis, You may not know about Prologis, which at 97.54 megawatts trails only Walmart in the amount of installed rooftop solar capacity in the U.S. Despite the low profile of its buildings and its brand, Prologis is the world’s largest owner and operator of warehouses, with a portfolio of thousands of nondescript one- and two-story buildings around the world. Boasting 700 million square feet of space  in 21 countries. In order to make use of their idle rooftop of storages, they install solar panel on them, and generate energy for daily operating use. They also sell excess energy to the energy supplier, which create another way of making money for their company. To date, Prologis has put solar panels on more than 100 buildings around the world, with a combined capacity of 140 megawatts. The company plans to add about 15 megawatts of solar capacity per year through 2020—a growth rate of about 10 percent annually.

The idea of installing solar panel to rooftop is not very new, and the only thing that matters is the scale. With so many warehouses Prologis have, Prologis has put itself on top of the game, and find a way of making money with their idle rooftops.


aaaaaa

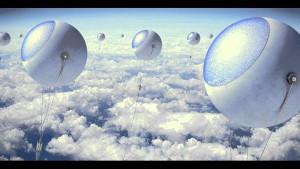
The problem with renewables is that we are never guaranteed a constant supply of sunshine, wind or wave power. NextPV, an International Joint Laboratory between France’s National Center for Scientific Research (CNRS) and the University of Tokyo come out a idea of harnessing solar energy by placing solar panels on balloons and sending them above the clouds. For which, Jean-Francois Guillemoles, senior researcher at the CNRS predicts the solar panels can get five times more energy in the upper air. According to the project, the solar balloon would be able to produce electricity during the day, with a battery continuing to generate electricity at night.

I see a future on installing solar panels on balloons, because a lot of technology is already available. And I believe NextPV will figure it out soon, and provide our society a new way of getting solar energy.


Resource:

http://www.cnbc.com/2016/01/14/harvesting-solar-6km-in-the-air.html

http://www.cnbc.com/2016/02/22/us-has-a-record-breaking-year-for-solar-power.html

http://www.slate.com/articles/business/the_juice/2016/01/prologis_which_runs_warehouses_is_a_huge_leader_is_solar_energy_huh.html

By

Solar Cell Lab

IMG_4541-e1446686068871-225x300

On Feb 19, 2016, I performed a lab about solar cell and energy with my teammate Daniela. In this experiment, our goals were to find the relationships between the voltage of the solar cell and the light intensity, and also between the voltage and 4 difference colors of light.

In order to do the lab, we need a flashlight, a solar cell, a voltage prone, a NXT with light sensor, a ruler, and four colored film filters. After we connected the NXT with computer, and active it, we ran the program solarlab1.vi on LabVIEW. Now, we were ready to roll.

In the first set of the experiment, we made our variable to be the light intensity. Thus, we turned on the flashlight, and let the light go directly to the solar cell with 0 cm away for 30 seconds. Then, we performed the same experiment with other four distances, namely 2 cm away, 4 cm away, 6 cm away, and 8 cm away. After that, we exported all of the data from the lab data file to Excel, averaged the voltages and constructed a graph for the first set of the experiment.

1

We then concluded that the voltage of the light and the distance of the light source were inversely related based on the graph we had.

Then, we moved on to the next set of the experiment. in this set of the experiment, we were asked to discover the relationship between the color of the light and the voltage. Therefore, we used color film filters to completely blocked the light from the flashlight. But this time, we kept the distance fixed for all types of color, which are red, green, purple and blue. After we performed each color of light for 30 seconds, we gathered all of the data and constructed a graph on Excel again.

2

Based on the chart above, we saw that green light generated the most voltage, followed by purple, blue and red. The experiment was very interesting, and I really enjoyed working on it.


By

Nikola Tesla

Nikola-Tesla

Nikola Tesla  was a Serbian inventor, electrical engineer, mechanical engineer, physicist, and futurist best known for his contributions to the design of the modern alternating current (AC) electricity supply system.

Tesla was born on July 10, 1856, in what is now Smiljan, Croatia. Tesla’s interest in electrical invention was spurred by his mother, Djuka Mandic, who invented small household appliances in her spare time while her son was growing up. In 1884, Tesla moved to America, and began to work for Thomas Edison whose DC-based electrical works were fast becoming the standard in the country. However, several months later, the two parted ways due to a conflicting business-scientific relationship.

After struggling with life, in 1887, he finally developed the alternating current system and filed several patents for his work. Meanwhile, his AC system was very interested by George Westinghouse, who later bought his patents for $60,000 in cash and stock. After the war of currents blew out, Tesla did not care so much, and he kept working on his work, and patented several more inventions during this period, including the “Tesla coil,” which laid the foundation for wireless technologies and is still used in radio technology today. In addition to his AC system and coil, he was also a pioneer in the discovery of radar technology, X-ray technology, remote control and the rotating magnetic field—the basis of most AC machinery.  

Current work and technology in Remote Control

A remote control is a component of an electronic device such as a television set, DVD player, or other home appliance, used to operate the device wirelessly from a short distance. Remote control is a convenience feature for the consumer, and can allow operation of devices that are out of convenient reach for direct operation of controls.

In our daily life, we use a lot of remote control technology, like controlling cars, TVs, cameras and etc. The following video demonstrates how  remote control technology works.

Remote control makes our lives easier than before. And I still remembered when I was a kid, I had to walk to the TV to change the channel. Now, we can do it with one click.


Reference

http://www.biography.com/people/nikola-tesla-9504443

http://www.history.com/topics/inventions/nikola-tesla

http://electronics.howstuffworks.com/inside-rc.htm


By

Generator Lab

On February 12th, 2016, my teammates Baoying, Ruan and I performed a generator experiment. The generator consists of a magnet, which will travel back and forth through Our through a coil of wires. Our goals of the experiment was to study the Faraday’s Law, which is stated that changing magnetic fluxes through coiled wires generate electricity. And also the relationship between the numbers of generator shook, and the sum of the squares of the voltages the generator generated in a 30 seconds interval.

In order to perform this experiment, we used a voltage probe, a NXT and of course, the generator. We connected the wires from the generator to the probe, and connected probe with NXT, and finally, connected probe to the computer.

Now, we opened the generator_lab.vi on the LabVIEW, and it would record the voltage the generator generated for us. And we were ready to shake. In the first time, I shook the generator 20 times in 30 seconds. And then, we opened the data recorded on excel. We saw 30 data in the excel, which meant our experiment was successful. We then did another 4 sets of experiment with 30, 40, 50 and 60 times in 30 second interval.

After that, we opened the excel and rearranged the data to make it clear. Then, we used the excel power function to square the voltages from each set of experiment, and summed up all of the square of the voltages in each set. Therefore, we were able to construct a graph about the relationship between the sum of the square of the voltages and number of shakes. Following is the graph and data from the experiment.

aa

When we did the experiment, we had different people shaking the generator every time. And when we did 20 shakes, and 60 shakes, we shook the tube at a faster rate compare to others. And the 50 shakes, our girl did it at a very slow rate. As a result, we concluded that the voltages generated from the generator was depended both on the rate of shaking, and the times of shakes. In particular, the faster we shake the tube, the more voltage will be generated. And the more times we shake, the more voltage will be generated.

In conclusion, the experiment was very interesting, and fun. And it also reminded me of taking calculus courses. Because I did not have a lot of knowledge about physics, but the instructor usually gave examples of flux and vector filed in physics world. Which I had no clue what was going on. After the experiment, I now understand much more about both calculus and physics.

By

Space X

lxshr2p

Space X, or Space Exploration Technologies Corporation, is an American aerospace manufacturer and space transport service company that was founded by Elon Musk in 2002. As a private company, it designs, manufactures, and launches advanced rockets and spacecraft. And the goal of the company is to revolutionize space technology and bring people to live on other planets. The company also accomplished a lot of achievements with two of their vehicles, one is Falcon 9 rocket, and the other one is the Dragon Spacecraft. Also, they are still working on Falcon Heavy, and they describe it as” The world’s Most Powerful Rocket”.

Falcon 9

crs6_launch_water

Falcon 9 is the first rocket completely designed and developed in the 21st century. It is a two-stage rocket designed to transport satellites and the dragon spacecraft into orbit. The Falcon 9 has a mass of 541,300kg, so it has a weight of 5304740N or 5304.74kN.(w=541300kg X 9.8 m/s^2 =5304740 N) In order for the rocket to moving upward against the force of gravity, the rocket needs to have very powerful engines. So, the company incorporates 9 Merlin Engines in the first stage, which gives the rocket a 6,806kN thrust at sea level.  Therefore, the net force moving upward when liftoff would be 1501.26kN.(6806kN+(-5304.74kN)=1501.26kN) By the Newton’s Second Law of Motion: F=ma, the Falcon 9 then has an acceleration of 0.002773 km/s^2 or 2.773 meters/s^2.(a=1591.26kN/541300kg=0.002773 km/s^2)

Falcon Heavy

fheavy_product_page1

Falcon Heavy is the newest rocket the company is working on, and it will be lift off later this year. From the data provided by the company, it has a mass of 1,394,000kg, which is more than two times greater than Falcon 9. So, how many engines it needed in order to lift off? Well, as we see in the photo above, it has 3 cores in the first stage. And the company says it has 27 Merlin engines, which provided 20,418kN thrust at sea level. Now, let’s calculate the weight of the giant rocket: 1,394,000kg X 9.8ms^-2=13661200N, or equivalently 13661.2kN. Now follow the same mechanism as we did before: 20418kN-13661.2kN=1,394,000kg X acceleration, we have acceleration=4.85 meters/second^2

In conclusion, we know that while the rocket burning fuels to provide the energy, it’s mass decreases. And as the altitude increases, the gravity also decreases. So, as a result, the acceleration of the rockets would eventually increase because the decrease in mass and the increase in the force.


Resources:

http://www.spacex.com/news/2013/03/26/merlin-engines

http://www.spacex.com/falcon9

http://www.spacex.com/falcon-heavy

http://www.spacex.com/

By

Force, Mass and Acceleration

On Feb 5th, 2016, my teammate Daniela Galindo and I performed the pulley lab activity together using Lego robots. Our goals of the experiment was to study and understand the relationships between acceleration and mass with a fixed force, and between acceleration and force with a fixed mass. And most importantly, to explore the Newton’s Second Law of Motion, i.e. Force=mass x acceleration(F=ma).

We began the experiment by installing the battery of the robot, and connected it with the pulley and computer. Then we measured the height of the pulley from the base to the top using a ruler, which was 33 centimeters. After that, we launched the file provided by our instructor on the Labview, and we actually performed the experiment based on two different scenarios.

图啊

In the first scenario, we set the power on the program to be 60, and had the pulley to lift mass of 0.24kg object for 33 centimeters . We recorded time and acceleration from the computer, and then we repeat the experiment four more times using mass of 0.2kg, 0.15kg,0.1kg and 0.05kg. Following are the data and graph constructed for Scenario One.


data 

graph

We were expecting the acceleration to be varied with mass when we had the fixed amount of power. The data above shows the fact clearly, for examples, when mass is 0.24kg, acceleration is 18.2436 rpm/s, and when mass is 0.2kg, acceleration is 22.6958 rpm/s . Also, from the graph, after displaying the horizontal axis to be the mass and the vertical axis to be the acceleration. We see the red straight line on the graph indicating an inverse relationship between acceleration and mass. Namely, as the mass of the lifted objects increases, the acceleration decreases.

On the other hand, we did the scenario two with power levels of 50, 60, 66, 75 and 90, while had the pulley lifting a fixed amount of 0.24kg objects for all of the difference power levels. And here are the data and graph for the scenario two.

data 2


graph2

In the scenario two, we again got the result as we expected. The accelerations varied as we changed the level of powers, and we could see the results from the data as well. Furthermore, I displayed five difference power levels on the horizontal axis along with five difference accelerations on the vertical axis. And on the graph, we see as the value of the power increases, the acceleration also increases. Also, the red straight line on the graph indicates a positive linear relationship between accelerations and powers.

In conclusion, we concluded the force is indeed a function of mass and acceleration since two scenarios both supported the it. And the Newton’s second Law of Motion is true from the results of the experiment.


By

Energy Grid

In the modern world, people use cellphone, light, and almost every thing that required electricity. But where is the electricity come from? Well, it comes from the grid, which is a complex network of power plants and transformers connected by more than 450,000 miles of high-voltage transmission lines.grid
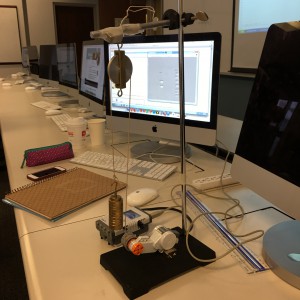
As we can see from the photo, electric power is generated at power plants and then moved by transmission lines to substations. A local distribution system of smaller, lower-voltage transmission lines moves power from substations to the customers.

The grid system is very important to us. Therefore, people need to constantly update, maintain and upgrade the infrastructures. The American Recovery and Reinvestment Act of 2009 provided the U.S. Department of Energy with $4.5 billion to modernize the electric power grid and to implement Title XIII of the Energy Independence and Security Act (EISA) of 2007. He has two largest initiatives are the Smart Grid Investment Grant (SGIG) Program and the Smart Grid Demonstration Program (SGDP.

Decades ago, people only used little amount of electricity for living. But today, we use a lot, and we need our grid to be smarter. The new Smart Grid allows for two-way communication between the utility and its customers, and the sensing along the transmission lines is what makes the grid smart. Like the Internet, the Smart Grid will consist of controls, computers, automation, and new technologies and equipment working together, but in this case, these technologies will work with the electrical grid to respond digitally to our quickly changing electric demand.

The benefits to smart grid is that it reduced operations and management costs for utilities, and further lower the costs for consumers. Another benefit is that the grid is more efficiency in transmission of electricity, and it can integrate with renewable energy systems, which helps in the globe warming.

Even though the Smart Grid does provide many benefits it does have negative aspects to it such as hacking. Because the Smart Grid is computer based, so there is potential risk that costumers’ information been stolen.

In conclusion, the Smart Grid is a great program for consumers, and also our environment. Although hacking is very bad, but nothing is perfect in the world. And as time goes by, we will develop a more secured way for the Smart Grid, with more feature, and more effective.


https://www.smartgrid.gov/the_smart_grid/smart_grid.html

http://energy.gov/articles/top-9-things-you-didnt-know-about-americas-power-grid

https://www.smartgrid.gov/recovery_act/project_information.html


By

Lego Robotics Activity

During the Friday class on January 29th, 2016, My teammate Daniela Galindo and I performed an experiment using Lego robot under the instructions of Prof. Sonek. Our goal of the experiment was to record the data of the robot movements measured by computer program called Labview and by ourselves. And to evaluate the percentage of errors between distance provided by program, and distance measured by our team using the formula:

formula

First of all, we installed the battery to the robot, and connected the robot with computer. Then, we used a ruler to measure the diameter of the robot’s wheel, which was 5.5 centimeters and we also calculated the diameter of the wheel, which was 0.1728 meters.

Diameter=5.5 centimeters X pi X (1 meter/ 100 centimeters)=0.1728 meters

After that, we launched the file, wheel rotation straight.vi provided by the our professor on the Labview, and set the diameter on the program to be 0.1728 meters. we placed the robot on the table and were ready to perform the lab.

we set the power on the program to be 60 and time to be 1 second, and clicked run on the computer program. The robot moved from left to the right on the table, then we physically measured and recorded the distance robot traveled using the ruler. And also the data that the program gave to us. We did the same thing using power=60 and time=1 second extra two times. And then, we repeated the experiment using power=50, time=1 second and power=40, time=1 second both three times. The following data shows the results of each set of experiment.

power 60
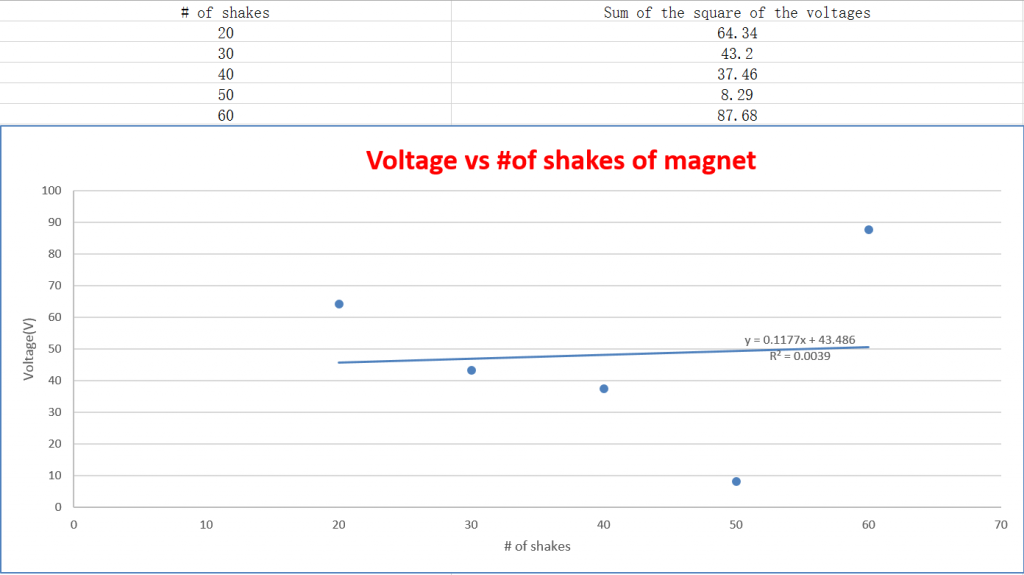
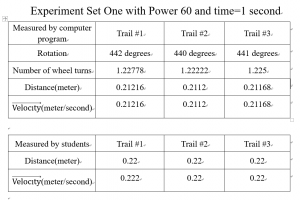
% of error of trail#1=(0.22-0.21216)/[(0.22+0.21216)/2] X 100% = 3.6283%

% of error of trail#2=(0.22-0.2112)/[(0.22+0.2112)/2] X 100% = 4.0816%

% of error of trail#3=(0.22-0.21168)/[(0.22+0.21168)/2] X 100% = 3.8547%

power 50

% of error of trail#1=(0.18-0.17088)/[(0.18+0.17088)/2] X 100% = 5.1984%

% of error of trail#2=(0.18-0.17376)/[(0.18+0.17376)/2] X 100% =3.5278%

% of error of trail#3=(0.18-0.1728)/[(0.18+0.1728)/2] X 100% = 4.0816%

power 40

% of error of trail#1=(0.14-0.13632)/[(0.14+0.13632)/2] X 100% =2.6636%

% of error of trail#2=(0.145-0.13584)/[(0.145+0.13584)/2] X 100% = 6.5233%

% of error of trail#3=(0.137-0.13584)/[(0.137+0.13584)/2] X 100% = 0.8503%

In conclusion, we found that the distances measured by the computer program and our team for all nine trails are difference, as we expected to have discrepancies for the experiment. And the discrepancies could be come from the measuring from our team, the defectiveness of the wheels or others.  Practically, we saw a positive relationship between the power of the robot and the distance it traveled, namely as the power of the robot increased, the distance it traveled also increased. Ultimately, Discrepancy was something that we should considered in our future experiments or in other field of study.

Skip to toolbar