Solar Cell Lab
On Feb 19, 2016, I performed a lab about solar cell and energy with my teammate Daniela. In this experiment, our goals were to find the relationships between the voltage of the solar cell and the light intensity, and also between the voltage and 4 difference colors of light.
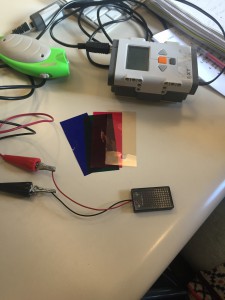
In order to do the lab, we need a flashlight, a solar cell, a voltage prone, a NXT with light sensor, a ruler, and four colored film filters. After we connected the NXT with computer, and active it, we ran the program solarlab1.vi on LabVIEW. Now, we were ready to roll.
In the first set of the experiment, we made our variable to be the light intensity. Thus, we turned on the flashlight, and let the light go directly to the solar cell with 0 cm away for 30 seconds. Then, we performed the same experiment with other four distances, namely 2 cm away, 4 cm away, 6 cm away, and 8 cm away. After that, we exported all of the data from the lab data file to Excel, averaged the voltages and constructed a graph for the first set of the experiment.
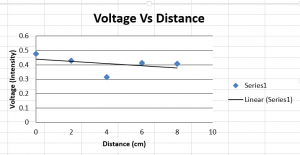
We then concluded that the voltage of the light and the distance of the light source were inversely related based on the graph we had.
Then, we moved on to the next set of the experiment. in this set of the experiment, we were asked to discover the relationship between the color of the light and the voltage. Therefore, we used color film filters to completely blocked the light from the flashlight. But this time, we kept the distance fixed for all types of color, which are red, green, purple and blue. After we performed each color of light for 30 seconds, we gathered all of the data and constructed a graph on Excel again.
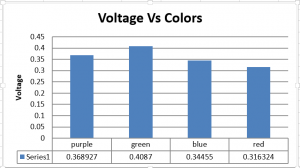
Based on the chart above, we saw that green light generated the most voltage, followed by purple, blue and red. The experiment was very interesting, and I really enjoyed working on it.
One Response to Solar Cell Lab