Author Archives: rbernardo

FINAL SCIENCE EXPERIMENT

For our final science experiment, my group and I decided to do a solar energy experiment.  We chose this topic because the idea of solar energy fascinated all of us.  We conducted an experiment using a solar panel, capacitors, and resistors to test which capacitor had the slowest energy leak.  The reason we wanted to test this topic can be seen in our lab handout which is copied below, our powerpoint presentation can be viewed at:

.

Solar Energy Experiment

Rebecca Bernardo, Lo-Ammi DoNascimento, Victoria Azar

Phil Garceau, Isabelle Atkinson, Matthew Byrne

Purpose of Experiment: To produce energy using a solar panel, and observe how much energy is lost between the three different sized capacitors. (45 microfarad, 4 microfarad, and one microfarad)

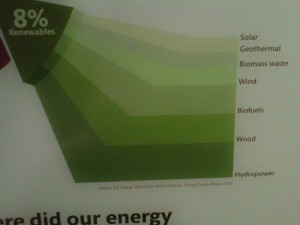
Background: One of the biggest problems we face with renewable energy is that it is not constant. Meaning, that the wind is not always blowing or there is no way to produce solar energy during the night. Because of that, we need to find efficient ways to store this energy for when it is needed.

A capacitor is a device that is used to store electricity. But because of the resistive nature of capacitors, they are not the most efficient devices and leak some of the energy that was generated.

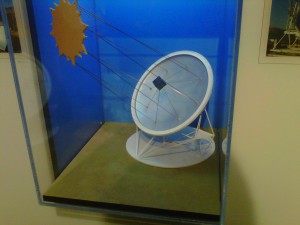
In this lab, you will use a solar panel to generate electricity from a handheld flashlight and measure the voltage using NXT to understand how capacitors lose energy.

By analyzing the relationship between capacitors and collecting solar energy, our goal is to understand through this experiment how to store solar energy in the most efficient way, and how to keep its leak at a minimum in order to sustain our planet.

Procedure:

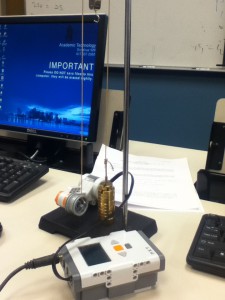
Setup: You will need a solar panel, flashlight, circuit board, three different sized capacitors (45 μF, four μF and one μF), wires, and an NXT with two probes. From there, you will create a circuit across a capacitor via a circuit board. You will then attach probes before and after the capacitor and measure the voltage using NXT.

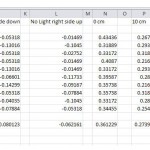
Data Collection: Run NXT while shining the light on the solar panel to ensure the circuit is properly set up. Immediately after NXT is done recording, turn the solar panel over and press run again. Record your results and repeat twice more with the other two capacitors.
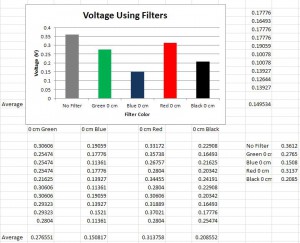
Data:

Voltage in circuit as time elapses

1 sec

2 sec

3 sec

4 sec

5 sec

6 sec

7 sec

8 sec

9 sec

10 sec

45 μF (V)

4 μF (V)

1 μF (V)


Analysis:

1. What is the most efficient sized capacitor?

2. Do you think that renewable energy can sustain a community’s energy needs if it lacks the technology to efficiently store energy? Why or why not?

3. What renewable source of energy do you think is less dependable for a constant source of energy, wind or solar? Why?

4. After conducting this experiment, would you consider converting to solar powered energy? Why or why not?


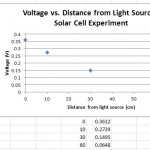
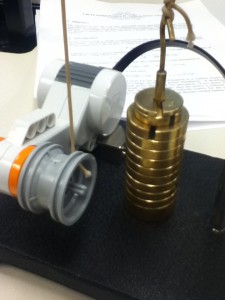
Our experiment showed that the largest capacitor, 45, had the slowest leak and when we traded our experiment to the other group, they also got this result, showing the consistency in our findings.  The experiment that we got to try from another group dealt with wind energy, which was fascinating to work with since we had been focusing on solar energy and this allowed us to see another aspect of it.  For their experiment we tested a wind turbine they built in different wind conditions (different distances, wind strength, etc) and we judged which was the most powerful by recording the joules.  In our conducting of their experiment we found that the most effective wind power came when the turbine was as close to the wind source as possible and it was on high intensity, that elicited the largest joules. Overall, we all really enjoyed this project and we enjoyed conducting and sharing our own experiment.  Sustainability was such a big part of this class because it is such an important and vital issue in our world, and making sure we continue to have a world, so it was very educational and fun to be able to do experiments dealing so specifically with sustainability.

Demand Response

Up until writing this blog I had absolutely no idea what demand response was and now that I do know I would like to make as many people aware of it as possible. The world’s energy use, sources of energy, sustainable energy, and all sorts of energy talk are always a serious discussion because to put it simply the world will not be able to function if we run out of ways of harassing and using energy.

Right now when we use electricity, we turn on a switch and boom there it is right in front of us. But few know the process energy had to go through to reach us.  Electricity is first generated at a power plant and then it is transmitted to a local substation where it is turned into usable voltage by a transformer.  From the transformer it is then distributed to our home through the grid which is comprised of high voltage transmission lines. When we turn on our light switch or our coffemaker we are demanding energy.  But what happens around 5 in the evening when everyone is getting home from work and turning on lights and televisions and all other types of appliances? That increases the demand load on the grids, and its rising more and more. But demand response helps to store energy for use during those prime times when the demand load is high. According to technologyreview.com “Demand response helps meet that climbing need for energy during the day through reductions, such as adjusting thermostat settings, dimming lights, or changing when hot water heaters run.”

Looking over it, the concept makes so much sense.  We are able to trim our usage of electricity throughout the day so we are able to have enough during those peak hours or in the bigger picture, in times of emergency like a blackout.  Demand response can help reduce overload and it also is incredibly beneficial due to the relief it is providing “to relieve the increased stress on the aging grid.” Programs like demand response can also help both the provider and the consumer save money, which with the rising cost of electricity (I’m shocked every month I get my bill) is always a plus. With help from demand response providers could avoid having to build new power plants or fix an overloaded grid and lower energy costs.

A new piece of technology that is being used for demand response is a smart grid, which unlike current grids, provide a 2 way communication between the consumer and the provider.  The smart grid would automate the flow of electricity is needed.  I, for one, am very excited at the prospect of demand response and look forward to learning more about it and seeing it develop further!

Sources:

http://www.technologyreview.com/view/513356/turning-off-the-power-to-run-the-grid/

http://www.greentechmedia.com/articles/category/demand-response

http://science.howstuffworks.com/environmental/green-science/demand-response.htm


Team Meeting

When I first found out I was captain for one of the teams for our final science project I was a bit hesitant.  But once I reviewed the requirements for the assignment, met with my team, and went to the Museum of Science I began to not only feel more comfortable in my responsibilities as captain but much more excited for the overall project.

I am captain of Team 1, my fellow teammates are: Victoria Azar, Matthew Byrne, Lo-Ammi Donascimento, Phillip Garceau, and Isabelle.  At our first team meeting only Victoria, Isabelle, and Lo-Ammi were present but even then we came up with some great ideas, many of which I then discussed with Phillip at our field trip to the Museum of Science.  Our first goal at our team meeting was to get to know each other and then begin to come up with ideas for a potential project.  I had class with Isabelle before so it was great to see a familiar face and Lo-Ammi and Victoria were great and very eager to come with an idea that would not only be beneficial for the rest of the class but that would also be fun to do.  The first thing we did was to exchange email addresses and phone numbers so contacting each other would never be an issue.  Our next step was to visit the suggested websites provided to us by the professor.  We knew that we did not want to pick our project idea completely off of that though because we wanted to make it our own, we only wanted to find inspiration at the websites.  After viewing many topic ideas we kept finding that the ones that interested us the most had to do with solar energy.  Everyone in the group thought this was a very interesting topic because none of us had actual experience with it or a lot of knowledge about it.  We knew some basic stuff from our previous blog posts but we wanted to know more.  So we typed ‘Solar Energy Experiments’ into google and quite a few of them had to do with testing a solar energy car.  We had never heard of this and started to wonder out loud to each other things like “I wonder how you make it?” or “I wonder if it actually works” and right then we all knew we had found our topic for the experiment.  We would like to build and test a solar energy car.  Not only would we be learning (and thus able to teach fellow students about the topic) but it seems like it will also be really fun, which is always a plus for projects.

When we went to the Science Museum my first priority was to learn more about solar energy and I most certainly did! I decided to photo blog my experience at the Museum of Science to show what I learned and how it relates directly to my project about solar energy.

1

The above picture illustrates a type of solar collector that is used to, you guessed it, collect energy from the sun’s rays.  This is a parabolic dish.2

The picture above illustrates the overall potential energy of solar power.  I was shocked when I learned that the sun provides about a thousand times more energy than the world actually needs.  There is no doubt that solar energy would be a great substitute, it is just a mater of overcoming the challenges of harnessing the power.3

The above picture illustrates how due to these challenges only 8% of our energy is solar energy.4

The above picture is a beautiful description of what I believe should be everyone’s attitude about sustainable energy.5

The above picture tells us about the photovoltaics (which we learned about in science class) that the Museum of Science actually uses.

Solar Cell Lab

This experiment was intended to show us how solar cells conduct and produce electricity. Specifically, we were testing how changing the intensity of a light source affected the amount of voltage generated by the solar cell. We couldn’t change the intensity of our light source (a simple flashlight), so instead we ran a number of trials in which we moved the flashlight beam farther away from the cell before running the LabView program. Once again, the LabView program recorded the results of the voltage produced and wrote them into an Excel document so we could calculate and graph our final data.

We ran six trials to test how light intensity affects the voltage produced. The first two tests were without using a light source, a control to see if our solar cell was functional and hooked up to the NXT properly. We ran the test once with the cells light-conducting side face down on the desk, and once with it face up. Without a light source in either test, the results showed that negligible amounts of energy was generated by the cell, as to be expected. We then conducted four tests with the flashlight concentrated on the cell from four different distances: 0 cm away (directly on top of the cell), 10 cm away, 30 cm away, and 60 cm away. The results are shown in these two graphs:

science graphscience light


As we expected, as the intensity of the light source was moved farther away, the amount of volts produced by the solar cell decreased steadily. The most amount of energy was produced when the light source was directly on top of the cell at 0 cm. The least amount of energy (besides the tests with no light source) was when the light was a full 60 cm away from the cell.

A second part of this experiment had us test out the amount of energy produced by the solar cell when the light source was focused through four different colored filters. We used a black, a green, a red, and a dark blue filter. We placed one filter at a time on top of the solar cell and then concentrated our light source at 0 cm (directly on top) from the solar cell for each trial. We also did one trial without a filter (also at 0 cm) as a control. The results are shown in this graph:

Color graphThis test showed that every filter we used cut down on the amount of voltage produced by the solar cell. The most energy was created when we used no filter, and the dark blue filter inhibited energy production the most.

This lab helped us understand the process of solar power, and how solar cells are used to create energy. We also learned a bit about how different wavelengths of light create varying amounts of energy in a solar cell.

Generator Lab

In this lab, we tested how Faraday’s Law of magnetic flux affects the generation of electricity. Our tool used to generate a varying magnetic flux.was a modified flashlight that creates a charge by shaking a magnet inside the flashlight past copper wires. Rather than using this energy to power a light bulb like a normal flashlight, the charge was led through two wires and into our NXT robot, which recorded the voltage created through a LabView program and wrote the results to an Excel document. We were to test how changing the shake rate of the flashlight affected the output of energy. It was hypothesized within our group that as we shook the flashlight more intensely, the amount of electrical voltage created would increase.

We ran three trials with the flashlight. First, we let the flashlight sit still without any shaking. Second, we shook the flashlight about 25 times at a medium intensity, and finally we shook the flashlight about 50 times at a very high intensity and then calculated the sum of the voltages recorded within Excel. The results were reflected in the following graph:

data

The results show that what we predicted turned out to be true. When we didn’t shake the flashlight, almost no voltage was recorded. As we increased the number of shakes, the voltage produced by the flashlight also increased. The results were also pleasantly consistent, as seen by the trend line within the graph.

The relevance of this experiment was to show that Faraday’s Law correctly demonstrates how increasing magnetic flux also increases the amount of electric voltage produced.

Tom Vales Visits Our Science Class

Professor of electrical engineering Tom Vales came to class to show us different alternative energy machines that he had collected and built. Each one displayed a different method of creating electricity. His visit gave us great insight into how science and technology is striving to find the best ways to create energy without harmful effects on the environment.

The first machine he showed us was called a Stirling Motor/Engine. This machine was particularly interesting because it was operating solely on steam created by a pot of boiling water. The steam from the water creating a shifting airflow within a tube, which in turn drove a piston, which could then be used to generate a form of essentially free energy. He said that this technology was utilized in emergency generators in Maine.

Next, Mr. Vales showed us a machine that was invented by physicist Jean Peltier. The machine incorporated two types of electricity conducting metal, copper and bismuth, fused together. An electric charge is sent through one side of the machine, heating up the other end which can then be used for different purposes.

The next machine was referred to as a Mendocino Motor. This device was very impressive, as it used nothing but solar energy to operate and resulted in a long metal rod actually floating and spinning freely in a magnetic field. This was accomplished by attaching four solar panels to the rod and concentrating a light source over the cells. The cells generated a charge that each turned the rod 90 degrees, and since there are four cells the rod spun in a full circular motion for as long as the light source was turned on. This demonstration impressed me because it showed solar energy could create a type of perpetual motion machine in a small scale machine.

Lastly, Mr. Vales demonstrated a Tesla Coil that he built himself. The Tesla Coil works by creating an alternating current of electricity through tightly spun copper wire. This demonstration showed us how AC power flows through different devices, which is how electricity flows from electrical outlets in our walls to any type of device we plug into the outlet. The Tesla Coil was very impressive and interesting, and Mr. Vales demonstrating how the electricity flowed through various devices he brought helped me better understand the concept of alternating current.

Picture Examples of the Machines

KONICA MINOLTA DIGITAL CAMERA

Example of a Stirling Engine

An example of Tom Vales' Peltier Engine

An example of Tom Vales’ Peltier Engine

mot2

A Mendocino Engine

Tom Vales' homemade Tesla Coil in action

Tom Vales’ homemade Tesla Coil in action

Fukushima Daiichi Nuclear Disaster

When reading about the Fukushima Daiichi Nuclear Disaster one is overwhelmed with information.  Even now we are still learning about this disaster, and most importantly ways to prevent it in the future.  I will not be able to cover the entire disaster or even go into great detail regarding the results of this disaster but below is an overview of what many consider to be the most tragic occurrence in our recent history. In March 2011 when the northeast coast of Japan experienced a very serious 9.0 earthquake and damaging tsunami very few could predict how bad things would get.  The tsunami caused severe damage to the nuclear reactor at Fukushima Daiichi which caused Fukushima Daiichi to become the cause of deaths (of all ages), some of the worst long term health issues, and the site of one of the worst nuclear accidents that the world has ever known.

At least 20,000 people died as a result of the earthquake and tsunami.  As tragic as it is, even more deaths are predicted as a result of the Fukushima Daiichi Nuclear disaster.  It occurred when the tsunami knocked out one of the cooling systems which caused the nuclear reactors to melt.  But due to the fact that roads, bridges, utility lines, power, and many forms of communication were down the Nuclear Regulatory Commission was not able to make fast progressive decisions because they were not able to be provided with any data. For days after the disaster they were desperate for information on what was happening.

What was happening occurs as follows: the day after the tsunami occurred, a spark ignited the pressurized atmosphere of hydrogen and steam within the containment building that surrounds Reactor Unit No. 1 which caused the containment building at Unit 3 to explode the very next day causing a huge release of radiation.  On March 16th orders went out from Japan demanding an evacuation from all areas within a dozen miles of Fukushima which equaled around 160,000 people. From the beginning the results of this disaster appeared very bleak. A month after the disaster occurred the government of Japan announced that the severity of the Fukushima Daiichi nuclear disaster had reached a level 7.  A level 7 is the highest on the International Nuclear Event Scale, which had only been reached once before in the 1986 Chernobyl Disaster. Even two months after the incident, TEPCO and the government still struggled to bring the reactors under control.

Although the speed of evacuation and the radius of evacuation is a critique many critics make against the government, no one can critique the fact that the government knew how serious and dire this situation was and treated it as so.  Regardless of how serious the government understood the situation to be, the results from this disaster are incredibly tragic. Even years later we are still learning more about this disaster and about the damage that it still threatens. The biggest health threat this disaster caused was radiation exposure.  According to Jan Beyea, who is from the US expert consulting service Consulting in the Public Interest, believes that the number of deaths that will come from cancer as a result of the radiation exposure is higher than originally predicted.  He says that “although an individual’s risk is small, the mid-range, predicted number of future mortalities from cancer is closer to 1000 than the 125 figure calculated without considering long-term groundshine [gamma radiation emitted from radioactive materials deposited on the ground].” The number of expected mortalities has increased over the year due to the fact that land is now contaminated with caesium-134 and caesium-137 and can cause cancer years after initial exposure that was not originally calculated.

RSC.org illustrates the importance of this situation when they illustrate that “if nuclear power is to have a future, its proponents must indicate how they can make such reactors fail safe and how they will assure that siting decisions do indeed take account of possible, or even likely, natural events.”

Sources:

http://www.rsc.org/chemistryworld/2013/01/reassessing-health-effects-fukushima-daiichi-nuclear-accident

http://www.marketplace.org/topics/sustainability/japans-quake/lessons-fukushima-daiichi-nuclear-disaster

http://www.globalresearch.ca/the-severity-of-the-fukushima-daiichi-nuclear-disaster-comparing-chernobyl-and-fukushima/24949

Pulley Experiment

This experiment had us observe a pulley system as it lifted a set of weights. The LabView program recorded certain data for us, but some data (like total height lifted) we had to record ourselves with a ruler. The point of the experiment was to see firsthand how some important laws of physics work, and how we can change an expected outcome by manipulating certain variables.

Here are some pictures of the experiment set up:

NXT 001NXT 002NXT 003

Our group first experimented with Newton’s 2nd law, which is F = MA (Force equals mass multiplied by acceleration). We did two different tests to observe this law: (1) Keeping the mass of the weights that the pulley will lift constant while changing the power level and (2) Keeping the power level constant while decreasing the mass of the weight lifted three times. In both cases, we were measuring how the variables affected the acceleration. The results were showed that both power level and mass have a direct effect on acceleration. When the mass is increased, the acceleration decreases, as shown in this graph:

Accel-v-mass

And when power level is increased, there is a direct increase in acceleration, as shown in this graph:

Acc-v-Force

For the next part of the experiment, we explored the law of conservation of energy through two tests: (1) Measuring the output of the battery on the NXT (measured in battery discharge) as mass is increased and (2) Measuring the power of the battery as power level is increased.

The output of the battery increased directly with an increased mass, signifying more battery power was needed to lift an increased load. As shown by this graph:

discharge-v-mass

And to conclude our experiment, we found that the power of the battery did indeed increase when we increased the power level, as shown by this graph:

power-v-power-level

Solyndra Scandal and the wisdom of clean energy subsidies

The scandal of Solyndra, a California based solar panal manufacturer came about when this company declared bankruptcy even after a $528 million in federal loan grants, laid off 1,100 workers, and was suspected of fraud by the FBI.  This scandal caused, according to the New York Times, “a highly partisan debate in Washington over the benefits or failings of Mr. Obama’s stimulus program and the wisdom of clean energy subsidies in general.”

The failure of Solyndra can be based off of a plethora of issues.  Although the design of the solar panels sought to cut cost with new cylindrical design that, while being innovative, also reduced the labor that was required for installation, the capital costs for manufacturing was still high along with the product and its success looking much better in the beginning design stages rather than when it hit the market.

What bothered the public most of all in the midst of this scandal was the governments involvement in it.  The loan guarantee of $535 million was the Obama administration’s first loan guarantee. “The administration, seeking to forge a “clean energy” economy and provide jobs in the face of a growing recession, picked the project partly because it was what government officials were then fond of calling “shovel ready” according to the New York Times.  Due to this blind faith in Solyndra the government allowed them to borrow from the Federal Financing Bank which is part of the Treasury Department.  So Solyndra was actually getting money directly from the government, which they collected $528 million of the $535 million promised before filing bankruptcy.

Although the end result for Solyndra was bad and damaged the public’s opinion of clean energy subsidies, it shouldn’t completely shift the public opinion of clean energy subsidies, not all are doomed to failure. As we have learned in extensive research we do need to find new forms of renewable energy for our world to last but since we are finding them that means that there will be “challenges of scaling up new technologies in tumultuous, unforgiving global markets,” according to the Huffington Post. As Mark Muro reported “it would be a serious mistake to over interpret regarding the Solyndra crack up, whether to generalize about the solar industry and cleantech or to broadly indict particular technology and development policies.”

Although pressure should be on the government to fully research and develop a plan with the company in question before giving out loans, our economy needs to be considered in these times as well, we should not forget the strides that have been made in clean energy thanks to subsidies from the government.  According to The Washington Post, “solar, wind, plug in vehicles- they’ve all benefited from billions of dollars in subsidies from Congress…as a result, many industries, like solar, have taken lengthy strides.” We cannot give up on funding clean energy altogether, perhaps we just need a better plan.

But according to a report from April 2012, clean energy subsidies are disappearing, possibly due to significant and public failures such as Solyndra.  By 2014 the subsides will shrink to $11.1 billion instead of the $44.3 billion they received in 2009, showing that clean energy subsidies are at a serious risk of disappearing almost all together. But thankfully people are not giving up on clean energy altogether and instead are looking for ways to fund them that don’t present such a potential damage to the economy, such as “feed in tariffs”, as seen in Germany’s green energy policy, in which the money given decreases over time which forces technology to keep improving in order to stay profitable.

Sources:

http://www.washingtonpost.com/blogs/wonkblog/post/clean-energy-subsidies-are-vanishing-what-should-replace-them/2012/04/18/gIQApCUYQT_blog.html

http://www.huffingtonpost.com/mark-muro/solyndra-solar-bankruptcy-solar-power-_b_947046.html

http://topics.nytimes.com/top/news/business/companies/solyndra/index.html

Hydro-Fracking

When first reading the blog topic for this week, I had no idea what hydraulic fracturing was, I had never heard of such a term and most certainly had never heard of hydro fracking.  But after researching this issue I immediately understood why this is such an important issue not only in the science community but in society because this is something that is affecting all of us. Hydro fracking is blasting high powered water to get at natural gas and other resources within the earth.  This process offers the threat of contamination and other serious drawbacks but it also offers us a less damaging fossil fuel, in the form of natural gas.
According the thinkbeforeyoufrack.org; “Hydrofracking is a…economical and technological method, which enables natural gas producers to recover natural gas from dense shale formations. During the drilling process, the drill will bore deep down into the earth and then horizontally for approximately 8,ooo feet in each direction.”  By doing this we would not only use a less damaging fossil fuel but we would also be obtaining it domestically instead of internationally which would decrease our dependence on international oil.
But significantly more water and chemical additives are used to fracture the rock and release the gases as compared to other methods and these are the points of concern as it can lead to more environmental and long term issues.  Although we need less damaging fossil fuel, which will decrease greenhouse gases and be cleaner to burn than coal or oil, is it worth the risk?
One of the biggest issues with hydro fracking is the issue of contamination. As previously mentioned, a drill is going deep down into the earth to recover these gases but by doing that there is a chance that it might hit a water source, and with all the chemical additives, contaminate our water source.  According to peacecouncil.net “some of the chemical additives frequently used include: diesel fuel, biocides, benzene (an additive to gasoline and industrial solvent), and hydrochloric acid.” This becomes a terrifying issue when considering that.  Although our world will not survive if we don’t change our handling or use of fossil fuel, we will not survive long enough to see that if all of our drinking water becomes contaminated. According the NCBI, “Although the EPA issued a 2004 report concluding there is very little risk that fracking can contaminate drinking water, there are some documented contamination incidents. For example, in August 2006, drilling fluids and methane were detected emerging from a hillside in Clark County, Wyoming, from a gas well surrounded by a rural housing development. Ultimately 8 million cubic feet of methane were released.”
The idea of hydro-fracking seems good, it is a process we have figured out how to properly use to find less damaging fossil fuels, the process of which and the benefits of I have illustrated.  But I have also shared the potential negatives that could result from this which makes us all wonder…is it worth it?
Sources:
http://www.thinkbeforeyoufrack.org/about-hydrofracking/
http://www.peacecouncil.net/NOON/hydrofrac/HdryoFrac2.htm
http://www.ncbi.nlm.nih.gov/pmc/articles/PMC1817691/