This experiment was intended to show us how solar cells conduct and produce electricity. Specifically, we were testing how changing the intensity of a light source affected the amount of voltage generated by the solar cell. We couldn’t change the intensity of our light source (a simple flashlight), so instead we ran a number of trials in which we moved the flashlight beam farther away from the cell before running the LabView program. Once again, the LabView program recorded the results of the voltage produced and wrote them into an Excel document so we could calculate and graph our final data.
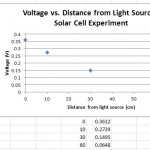
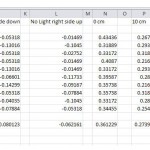
We ran six trials to test how light intensity affects the voltage produced. The first two tests were without using a light source, a control to see if our solar cell was functional and hooked up to the NXT properly. We ran the test once with the cells light-conducting side face down on the desk, and once with it face up. Without a light source in either test, the results showed that negligible amounts of energy was generated by the cell, as to be expected. We then conducted four tests with the flashlight concentrated on the cell from four different distances: 0 cm away (directly on top of the cell), 10 cm away, 30 cm away, and 60 cm away. The results are shown in these two graphs:
As we expected, as the intensity of the light source was moved farther away, the amount of volts produced by the solar cell decreased steadily. The most amount of energy was produced when the light source was directly on top of the cell at 0 cm. The least amount of energy (besides the tests with no light source) was when the light was a full 60 cm away from the cell.
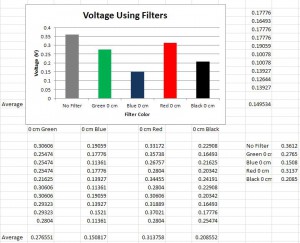
A second part of this experiment had us test out the amount of energy produced by the solar cell when the light source was focused through four different colored filters. We used a black, a green, a red, and a dark blue filter. We placed one filter at a time on top of the solar cell and then concentrated our light source at 0 cm (directly on top) from the solar cell for each trial. We also did one trial without a filter (also at 0 cm) as a control. The results are shown in this graph:
 This test showed that every filter we used cut down on the amount of voltage produced by the solar cell. The most energy was created when we used no filter, and the dark blue filter inhibited energy production the most.
This lab helped us understand the process of solar power, and how solar cells are used to create energy. We also learned a bit about how different wavelengths of light create varying amounts of energy in a solar cell.

