Monthly Archives: March 2013

Solar Cell Lab

This experiment was intended to show us how solar cells conduct and produce electricity. Specifically, we were testing how changing the intensity of a light source affected the amount of voltage generated by the solar cell. We couldn’t change the intensity of our light source (a simple flashlight), so instead we ran a number of trials in which we moved the flashlight beam farther away from the cell before running the LabView program. Once again, the LabView program recorded the results of the voltage produced and wrote them into an Excel document so we could calculate and graph our final data.

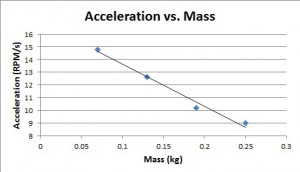
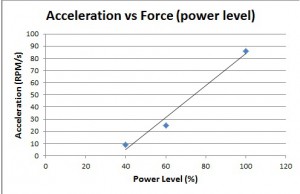
We ran six trials to test how light intensity affects the voltage produced. The first two tests were without using a light source, a control to see if our solar cell was functional and hooked up to the NXT properly. We ran the test once with the cells light-conducting side face down on the desk, and once with it face up. Without a light source in either test, the results showed that negligible amounts of energy was generated by the cell, as to be expected. We then conducted four tests with the flashlight concentrated on the cell from four different distances: 0 cm away (directly on top of the cell), 10 cm away, 30 cm away, and 60 cm away. The results are shown in these two graphs:

science graphscience light


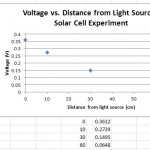
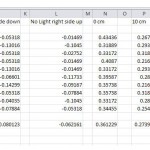
As we expected, as the intensity of the light source was moved farther away, the amount of volts produced by the solar cell decreased steadily. The most amount of energy was produced when the light source was directly on top of the cell at 0 cm. The least amount of energy (besides the tests with no light source) was when the light was a full 60 cm away from the cell.

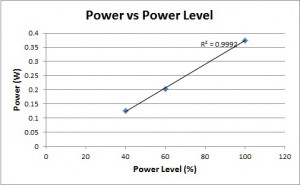
A second part of this experiment had us test out the amount of energy produced by the solar cell when the light source was focused through four different colored filters. We used a black, a green, a red, and a dark blue filter. We placed one filter at a time on top of the solar cell and then concentrated our light source at 0 cm (directly on top) from the solar cell for each trial. We also did one trial without a filter (also at 0 cm) as a control. The results are shown in this graph:

Color graph
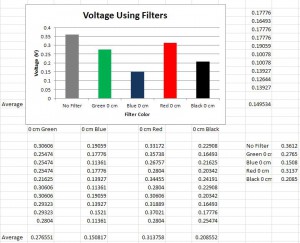
This test showed that every filter we used cut down on the amount of voltage produced by the solar cell. The most energy was created when we used no filter, and the dark blue filter inhibited energy production the most.

This lab helped us understand the process of solar power, and how solar cells are used to create energy. We also learned a bit about how different wavelengths of light create varying amounts of energy in a solar cell.

Generator Lab

In this lab, we tested how Faraday’s Law of magnetic flux affects the generation of electricity. Our tool used to generate a varying magnetic flux.was a modified flashlight that creates a charge by shaking a magnet inside the flashlight past copper wires. Rather than using this energy to power a light bulb like a normal flashlight, the charge was led through two wires and into our NXT robot, which recorded the voltage created through a LabView program and wrote the results to an Excel document. We were to test how changing the shake rate of the flashlight affected the output of energy. It was hypothesized within our group that as we shook the flashlight more intensely, the amount of electrical voltage created would increase.

We ran three trials with the flashlight. First, we let the flashlight sit still without any shaking. Second, we shook the flashlight about 25 times at a medium intensity, and finally we shook the flashlight about 50 times at a very high intensity and then calculated the sum of the voltages recorded within Excel. The results were reflected in the following graph:

data

The results show that what we predicted turned out to be true. When we didn’t shake the flashlight, almost no voltage was recorded. As we increased the number of shakes, the voltage produced by the flashlight also increased. The results were also pleasantly consistent, as seen by the trend line within the graph.

The relevance of this experiment was to show that Faraday’s Law correctly demonstrates how increasing magnetic flux also increases the amount of electric voltage produced.

Tom Vales Visits Our Science Class

Professor of electrical engineering Tom Vales came to class to show us different alternative energy machines that he had collected and built. Each one displayed a different method of creating electricity. His visit gave us great insight into how science and technology is striving to find the best ways to create energy without harmful effects on the environment.

The first machine he showed us was called a Stirling Motor/Engine. This machine was particularly interesting because it was operating solely on steam created by a pot of boiling water. The steam from the water creating a shifting airflow within a tube, which in turn drove a piston, which could then be used to generate a form of essentially free energy. He said that this technology was utilized in emergency generators in Maine.

Next, Mr. Vales showed us a machine that was invented by physicist Jean Peltier. The machine incorporated two types of electricity conducting metal, copper and bismuth, fused together. An electric charge is sent through one side of the machine, heating up the other end which can then be used for different purposes.

The next machine was referred to as a Mendocino Motor. This device was very impressive, as it used nothing but solar energy to operate and resulted in a long metal rod actually floating and spinning freely in a magnetic field. This was accomplished by attaching four solar panels to the rod and concentrating a light source over the cells. The cells generated a charge that each turned the rod 90 degrees, and since there are four cells the rod spun in a full circular motion for as long as the light source was turned on. This demonstration impressed me because it showed solar energy could create a type of perpetual motion machine in a small scale machine.

Lastly, Mr. Vales demonstrated a Tesla Coil that he built himself. The Tesla Coil works by creating an alternating current of electricity through tightly spun copper wire. This demonstration showed us how AC power flows through different devices, which is how electricity flows from electrical outlets in our walls to any type of device we plug into the outlet. The Tesla Coil was very impressive and interesting, and Mr. Vales demonstrating how the electricity flowed through various devices he brought helped me better understand the concept of alternating current.

Picture Examples of the Machines

KONICA MINOLTA DIGITAL CAMERA

Example of a Stirling Engine

An example of Tom Vales' Peltier Engine

An example of Tom Vales’ Peltier Engine

mot2

A Mendocino Engine

Tom Vales' homemade Tesla Coil in action

Tom Vales’ homemade Tesla Coil in action

Fukushima Daiichi Nuclear Disaster

When reading about the Fukushima Daiichi Nuclear Disaster one is overwhelmed with information.  Even now we are still learning about this disaster, and most importantly ways to prevent it in the future.  I will not be able to cover the entire disaster or even go into great detail regarding the results of this disaster but below is an overview of what many consider to be the most tragic occurrence in our recent history. In March 2011 when the northeast coast of Japan experienced a very serious 9.0 earthquake and damaging tsunami very few could predict how bad things would get.  The tsunami caused severe damage to the nuclear reactor at Fukushima Daiichi which caused Fukushima Daiichi to become the cause of deaths (of all ages), some of the worst long term health issues, and the site of one of the worst nuclear accidents that the world has ever known.

At least 20,000 people died as a result of the earthquake and tsunami.  As tragic as it is, even more deaths are predicted as a result of the Fukushima Daiichi Nuclear disaster.  It occurred when the tsunami knocked out one of the cooling systems which caused the nuclear reactors to melt.  But due to the fact that roads, bridges, utility lines, power, and many forms of communication were down the Nuclear Regulatory Commission was not able to make fast progressive decisions because they were not able to be provided with any data. For days after the disaster they were desperate for information on what was happening.

What was happening occurs as follows: the day after the tsunami occurred, a spark ignited the pressurized atmosphere of hydrogen and steam within the containment building that surrounds Reactor Unit No. 1 which caused the containment building at Unit 3 to explode the very next day causing a huge release of radiation.  On March 16th orders went out from Japan demanding an evacuation from all areas within a dozen miles of Fukushima which equaled around 160,000 people. From the beginning the results of this disaster appeared very bleak. A month after the disaster occurred the government of Japan announced that the severity of the Fukushima Daiichi nuclear disaster had reached a level 7.  A level 7 is the highest on the International Nuclear Event Scale, which had only been reached once before in the 1986 Chernobyl Disaster. Even two months after the incident, TEPCO and the government still struggled to bring the reactors under control.

Although the speed of evacuation and the radius of evacuation is a critique many critics make against the government, no one can critique the fact that the government knew how serious and dire this situation was and treated it as so.  Regardless of how serious the government understood the situation to be, the results from this disaster are incredibly tragic. Even years later we are still learning more about this disaster and about the damage that it still threatens. The biggest health threat this disaster caused was radiation exposure.  According to Jan Beyea, who is from the US expert consulting service Consulting in the Public Interest, believes that the number of deaths that will come from cancer as a result of the radiation exposure is higher than originally predicted.  He says that “although an individual’s risk is small, the mid-range, predicted number of future mortalities from cancer is closer to 1000 than the 125 figure calculated without considering long-term groundshine [gamma radiation emitted from radioactive materials deposited on the ground].” The number of expected mortalities has increased over the year due to the fact that land is now contaminated with caesium-134 and caesium-137 and can cause cancer years after initial exposure that was not originally calculated.

RSC.org illustrates the importance of this situation when they illustrate that “if nuclear power is to have a future, its proponents must indicate how they can make such reactors fail safe and how they will assure that siting decisions do indeed take account of possible, or even likely, natural events.”

Sources:

http://www.rsc.org/chemistryworld/2013/01/reassessing-health-effects-fukushima-daiichi-nuclear-accident

http://www.marketplace.org/topics/sustainability/japans-quake/lessons-fukushima-daiichi-nuclear-disaster

The Severity of the Fukushima Daiichi Nuclear Disaster: Comparing Chernobyl and Fukushima

Pulley Experiment

This experiment had us observe a pulley system as it lifted a set of weights. The LabView program recorded certain data for us, but some data (like total height lifted) we had to record ourselves with a ruler. The point of the experiment was to see firsthand how some important laws of physics work, and how we can change an expected outcome by manipulating certain variables.

Here are some pictures of the experiment set up:

NXT 001NXT 002NXT 003

Our group first experimented with Newton’s 2nd law, which is F = MA (Force equals mass multiplied by acceleration). We did two different tests to observe this law: (1) Keeping the mass of the weights that the pulley will lift constant while changing the power level and (2) Keeping the power level constant while decreasing the mass of the weight lifted three times. In both cases, we were measuring how the variables affected the acceleration. The results were showed that both power level and mass have a direct effect on acceleration. When the mass is increased, the acceleration decreases, as shown in this graph:

Accel-v-mass

And when power level is increased, there is a direct increase in acceleration, as shown in this graph:

Acc-v-Force

For the next part of the experiment, we explored the law of conservation of energy through two tests: (1) Measuring the output of the battery on the NXT (measured in battery discharge) as mass is increased and (2) Measuring the power of the battery as power level is increased.

The output of the battery increased directly with an increased mass, signifying more battery power was needed to lift an increased load. As shown by this graph:

discharge-v-mass

And to conclude our experiment, we found that the power of the battery did indeed increase when we increased the power level, as shown by this graph:

power-v-power-level