Tom Vales Presentation

Even though I was late for Mr. Tom Vale’s presentation I had the chance to see some of the tools he was using to show how electricity is conducted. The only experiment I was able to see was the florescent light bulb the he put close to an instrument that replicate a Tesla Coil. The bulb was thiner on one half and due to this availability of space, the particles inside the bulb would react by showing off two different colors on each half of the bulb. Mr. Tom Vales talked about the following topics that I am going describe based on some research:

1) The Peltier Junction:

When we think of Peltier effect we refer to the cooling of one joint and the heating of the other. When a flow of electric charge is kept in a circuit of two different conductors, and the effect can be even stronger in circuits with different semiconductors. Peltier found that junctions of different metals could be heated or cooled, depending on which direction an electrical current passed through them. If the electrical current was to be reversed, heat would be absorbed.


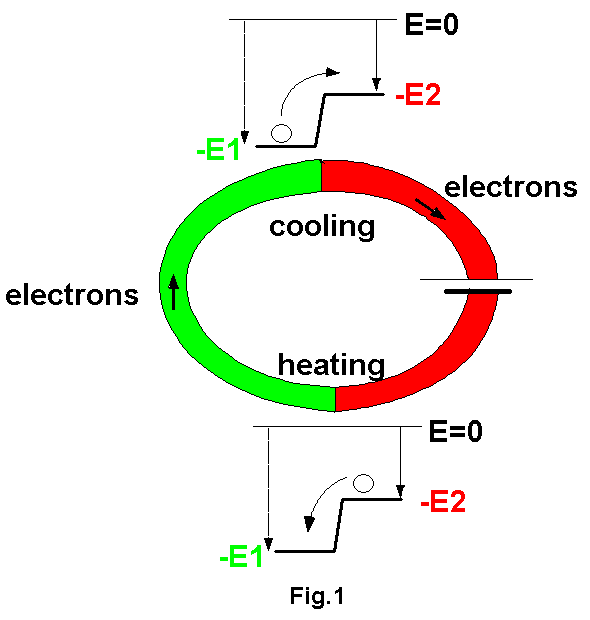
Here we have an example of the Peltier effect:  consider the circuit shown here. Under these conditions it is observed, as indicated in the picture above, that the right-hand junction is heated, showing that electrical energy is being transformed into heat energy (where the black arrow on the heat side is). Meanwhile, heat energy is transformed into electrical energy at the left junction, thereby causing it to be cooled. When the current is reversed, heat is absorbed at the right junction and produced at the left one.

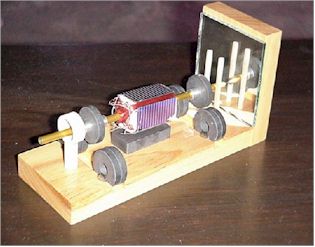
2) The Stirling Engine:

The Stirling engine was invented by Robert Stirling back in 1816. It has the potential to be much more efficient than a diesel or gasoline engine. However, there hasn’t been a mass market boom for the Stirling engine. Its uses, rely mostly in very specialized applications such as in submarines or auxiliary power generators for yatchs, because they require silent operations.


According to howstuffworks.com ”A Stirling engine uses the Stirling cycle,­ which is unlike the cycles used in internal-combustion engines. The gasses used inside a Stirling engine never leave the engine. There are no exhaust valves that vent high-pressure gasses, as in a gasoline or diesel engine, and there are no explosions taking place. Because of this, Stirling engines are very quiet.The Stirling cycle uses an external heat source, which could be anything from gasoline to solar energy to the heat produced by decaying plants. No combustion takes place inside the cylinders of the engine”. I particularly like loud stuff when it comes to motors, but for those vehicles that are made to be silent, their best choice is to have a Stirling engine.

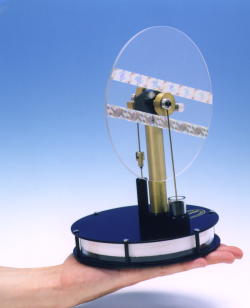
3) The Mendocino Motor:

Even though I missed the description of this one, I had the opportunity to actually see a Mendocino Motor. Thanks to solar energy, the motor would keep moving a small generator that needed a little spin at first, but then would rotate non stop (until light would be blocked).

Fortunately, I found a picture of the Mendocino Motor that Mr. Vales has. It is on his website:


The Mendocino motor’s base has 5 sets of magnets. 4 Magnets are located in the base that provide a levitation force against the magnet in the rod. The 5th one, provides the magnetic field for the rotor. According to stelmos-fire.com ”The rotor consists of a shaft with a point on one end, magnets and rotor block. On the rotor block, there are four solar cells; one cell on each of the four sides and two sets of windings”. It works in the following way: The rotor is levitated (as described before with the magnets) and it provides a forward thrust to maintain the pole’s point against the plate. When the light hits the solar cells, it generates an electric current that energizes the rotor. What causes the rotor to turn is the creation of an electromagnetic field that reacts with the magnets in the base. So when the rotor turns, it gives the chance to another cell to get energy, creating the process simultaneous.

4) Tesla Coil:

What I heard the most when I came in the classroom was Mr. Vales talking a lot about Nikola Tesla and his inventions, specially the Tesla Coil. The Tesla Coil is one of Nikola’s most famous inventions. It is a high-frequency air-core transformer. Accoring to teslasociety.com ”It takes the output from a 120vAC to several kilovolt transformer & driver circuit and steps it up to an extremely high voltage. Voltages can get to be well above 1,000,000 volts and are discharged in the form of electrical arcs.” I am very glad I had a chance to actually see Mr. Vales turn that coil on and see how the electricity would come out the peak of the coil, like a lot of lightnings going on, and in fact the create extremely powerful.

Sources:

http://stelmos-fire.com/mendocinomotor.html

http://www.daviddarling.info/encyclopedia/P/Peltier_effect.html

http://www.howstuffworks.com/stirling-engine.htm


MIT Nuclear Reactor Tour

Last monday we went on a tour that helped develop our understanding on nuclear energy. Massachusetts Institute of Technology’s Nuclear Reactor is one of the two reactors used in an academic institution in the United States. Even though it is used only for research purposes for the students of MIT, safety measures must be kept priority at all times due to radiation. In their website, the recall ”The MIT Nuclear Reactor Laboratory (MIT-NRL) as an university laboratory that conducts interdisciplinary research in the areas of advanced fuel and materials for nuclear energy systems, nuclear science, nuclear medicine, and radiation science and technology”

When I first got there, I was not very impressed with the infrastructure of the building; however, I said to myself that the big thing to see was the reactor, not the administration offices. After meeting with my classmates and Dr. Sonek, we were given radiation meters that we were supposed to keep in our pockets at all time in order to compare the levels of radiations before and after we exited the facility. Before we were introduced to our guide, a faculty staff gave us a little explanation of how nuclear energy worked. Even though she seemed extremely nervous about speaking to a crowd but she accomplished her job. In fact, what she said was basically ”The MIT reactor is a tank-type reactor, having in fact two tanks: an inner one for the light water coolant moderator and an outer one for the heavy water reflector. The fuel elements of uranium are positioned in a hexagonal core structure, 38 cm (15 inches) across, at the bottom of the core tank. Power is controlled by six shim blades and an automatic regulating rod. The pressure in the system is practically atmospheric, and the maximum temperature approximately 50 C (120 F). An exterior shield of dense concrete makes it possible for research workers and students to conduct experiments and training without radiation hazards”. Our tour guide was a senior student whose name I do not remember. I was somehow afraid and uncomfortable of getting exposed to radiation because I have never been so close to a nuclear reactor or radioactive material but it eased when at the end the radiation meter pointed 37, the same level when I entered the facility.

There was something though that caught my attention. A room in which they would expose to radiation people with  brain cancer in order to erradicate the tumor. However, it was not successful because the radiation would not only get to the head, but it would go as far as the lungs, causing the opposite of what it was planned, and tumors could generate, causing problems instead of fixing them. With all its creepiness, the medical room is not longer in use.

I particularly was fascinated when I saw the reactor, like I said I have never seen one before and I am very glad Dr. Sonek brought us there. After going around the reactor, we entered the control room, which I though was the most interesting part of the tour. I was fascinated with all the buttons, the electricity, heat, and radiation indicators. Below are some pictures of the MIT nuclear reactor:


Control Room


View from outside the reactor


This is the room where they would expose patients with cancer to radiation.


Inside the reactor

I appreciated the tour and I am very glad I didn’t miss out on this activity. Learning about fission in a nuclear reactor doesn’t happen everyday. I can now see how catastrophic a nuclear disaster can be after looking at the precautions this MIT team uses. Nuclear energy can be clean, but it requires extreme care because it can cause terrible things.

Sources:

“MIT Nuclear Reactor Laboratory: Home.” MIT Nuclear Reactor Laboratory: Home. N.p., n.d. Web. 27 Oct. 2012. <http://web.mit.edu/nrl/www/>.

Fukushima Daiichi Nuclear Disaster and Japan’s New Energy Strategies.

Fukushima Daiichi was once the 15 largest nuclear reactor station in the world. The plant, consisted of 6 boiling water reactors that were designed by General Electric that would generate energy to fulfill the electricity needs of the citizens in the region. The reactor is split into two groups, on the picture below we can see: on the left, containing units 4,3,2, and 1 going from left to right; on the right, we have the newest, 5 and 6 units.

The Fukushima reactor was plugged into a power grid by four lines. These lines, according to wikipedia.com, were ”the 500 kV Futaba Line, the two 275 kV Ōkuma Lines, and the 66 kV Yonomori line”.

In March 2011, Japan was about to enter a radiation nightmare. Measured by the Japanese Meteorological station a 9.0 earthquake shook the whole country. Skyscrapers were shaking and buildings collapsed, the most powerful earthquake ever recorded in Japan. Even though the epicenter was 130 kilometers of the sea, devastation began instantly in the north of the country, with buildings collapsing, explosions, and more catastrophic events, such as people dying very fast. More devastating than that, a massive tsunami was approaching the coast of japan very rapidly. The devastation caused by both the tsunami and the earthquake was tremendous: these are some pictures of what was occurring:


What happened in the Fukushima Reactors?

The Fukushima nuclear power station bares the full force of the tsunami. It began flooding and almost all power was lost along with workers getting killed instantly while the water began entering the station. Unfortunately, the cooling system failed, and they needed power very quickly to cool the reactors down because the radiation levels were beginning to rise (this may have happened due to cracks in the reactors caused by the earthquake). In the damaged control room, workers were trying to figure out what was happening inside the factor number 1, by using car batteries (used as the primary source of energy due to shortage of power) connected to the computers, they found out that the pressure levels were increasing and so they had to find a way to bring the pressure down.

All reactors have pressure release valves that are used to release pressure, and so, according to the Prime minister of Japan, in a youtube documentary ”He ordered the valves to be open so that pressure would be released into the air”. However, inside the plant, scientists opposed this plan because they argued that if steam was to be released into the air, this steam would bring along radioactive material. Under orders, they have to do what the Minister says and so they go on to find the valves which was not an easy task because there was no power and they only had lanterns to guide them. A post-quake, makes reactor number one explode, and  radiation levels increased dramatically (1,000 times higher than usual around reactor 1). Two days later, an even larger explosion blows reactor number 3 causing radiation levels to rise even higher. Clearly, there was no control over the reactors. On the next day, reactor 4 explodes, everything was melting down.

What really happened inside the reactors:

According to Akira Omoto (engineer involved in the construction of the Fukushima power plant) who was featured in a video on youtube (Fukushima Nuclear Reactor Explained) said that ”the water that was used to cool down the fuel rods leaked out the reactors due to cracks caused by the earthquake, allowing high temperatures to rise in the reactors”. As one of the safety measures, control rods entered to stop fission so the reactor stopped operating; however, water, that should have been circulated to sopped the heating was not circulated because of the power outage caused by the earthquake. A second safety system would spray water to cool down the rods, but at this time, the tsunami hit the power plant, causing the safety generator fail. After that, a third safety system began which converts steam, traveling from the pipe, into water. This cooled the rods, but the water levels went down so it was not sufficient and the temperature continued to rise. All three safety measures failed. The following image shows the reactor’s melted core:


According to fukushimaupdate.com ”Fukushima fish may be indible for a decade”, the post effects are devastating. Unfortunately, radiation takes a very long time to disappear, causing serious contamination to the wildlife, water, and residents of the region affected. Another article featured on this website mentions that ”The EU began restricting Japanese food imports in late March last year after the start of the nuclear crisis triggered by the Great East Japan Earthquake”, so what happened here was a very serious disaster that affected not only infrastructure, and lives of the Japanese people, but also the entire economy of Japan.

Japan’s New Energy Strategies:

The number one strategy is to decrease reliance on nuclear energy, however:

According to an article in the NY Times on Japan’s crisis ”The government had been considering several options: whether to close all the plants over time or to maintain enough reactors to provide a smaller but still substantial percentage of the country’s electricity needs. Before the nuclear accident at the Fukushima Daiichi plant, Japan depended on its reactors for about 30 percent of its electricity and had planned to raise that share to more than 50 percent by 2030”, it seems that the citizens became traumatized from this event. I do not understand how Japan, being an high earthquake zone, would allow companies to build nuclear power plants. The Government, in order to regain the trust of its citizens, replaced the whole nuclear energy commission, but this topic is still very delicate, and any decision could cause problems. Also, according to yomiuri.co.jp ”If the nation abolishes nuclear power generation, it would likely find itself at a disadvantage in negotiations with resource-rich nations to purchase resources such as liquefied natural gas for thermal power generation”. Because 30% of its energy is from nuclear sources, it is very difficult to know what the future of Japan will look like if they decide to shut down all the nuclear energy facilities. If they do so, what is going to happen with all the reactors? will they be a threat for future natural disasters? or will they still be operated regarding the Fukushima Disaster?, the future will tell.

Sources:

“Fukushima Daiichi Nuclear Power Plant.” Wikipedia. Wikimedia Foundation, 25 Oct. 2012. Web. 27 Oct. 2012. <http://en.wikipedia.org/wiki/Fukushima_Daiichi_Nuclear_Power_Plant>.

Kanashima, Hironori, and Yomiuri Shimbun. “Govt Energy Strategy Causes New Concerns.” Daily Yomiuri Online. The Yomiuri Shimbum, n.d. Web. <http://www.yomiuri.co.jp/dy/national/T120915002677.htm>.

“Seconds From Disaster – Fukushima [Documentary].” Seconds From Disaster – Fukushima. Youtube. 6 July 2012. YouTube. YouTube, 06 July 2012. Web. 27 Oct. 2012. <http://www.youtube.com/watch?v=_NeOhd_Z3LA>.

Tabuchi, Hiroko. “Japan Sets Policy to Phase out Nuclear Power Plants by 2040.”The New York Times. N.p., 14 Sept. 2012. Web. 27 Oct. 2012. <http://www.nytimes.com/2012/09/15/world/asia/japan-will-try-to-halt-nuclear-power-by-the-end-of-the-2030s.html?pagewanted=all&_r=0>.

Solar Energy efforts around the world, and the wisdom of clean energy subsidies in general.

According to national geographic ”Every hour the sun beams onto Earth more than enough energy to satisfy global energy needs for an entire year. Solar energy is the technology used to harness the sun’s energy and make it useable. Today, the technology produces less than one tenth of one percent of global energy demand”. For many years humans have been utilizing the power of the sun to satisfy their needs. The ancient civilizations used to build their structures in correlation with the sun in order to obtain its light to illuminate rooms and heat well of course to keep them warm. Nowadays, a team of researchers has developed the largest solar boat, known as the MS Turanor, which is owned by German entrepreneur Immo Stroher.

According to an announcement from the Planet Solar team, the vessel has begun a journey around the world from Monaco. As we are moving into a renewable resources era, the sun represents a vital source of energy.“More than ever, we need to harness the power of the sun, the source of the most abundant renewable energy on earth,” said UNIDO’s Director-General, Kandeh K. Unfortunately, solar technologies is very expensive and it requires big land space in order to satisfy most of the population. Also “At the moment solar energy, like all renewables, still represents a relatively small portion of the total energy production anywhere in the world. Some places have promoted it more than others, but in the developing world, there aren’t many countries that have a strong presence in solar,” says Clarence-Smith from UNIDO. Lets now take a look at the solar energy efforts around the world:

China: according to Edward Clarence-Smith, UNIDO’s representative in China, says that “China is leading the way in certain segments of the solar energy market, for instance in solar water heaters for domestic use and it’s growing rapidly in others such as photovoltaics. But more importantly for UNIDO, China has available solar energy technologies that can be easily transferred to other developing countries with the necessary skills to use them.”

Vert fortunately China has available solar energy technologies that can be easily transferred to other developing countries with the necessary skills to use them. The Chinese government has realized that renewable energy is the energy of the future and that using renewable resources represents a more secure way of obtaining energy. As an example, we have the UNIDO International Solar Energy Center (ISEC) which is operated between the chinese government and promotes and facilitate the use of solar energy around the world. This center itself is a remarkable example of efficient use of solar energy, because the lighting, heating and hot water systems are all operated using the sun’s power.

United States: solar cells generate energy for far-out places like satellites in Earth orbit and cabins deep in the Rocky Mountains as easily as they can power downtown buildings and futuristic car. Solar Energy USA , a company that dedicates to solar energy, has provided photovoltaic solar energy systems and energy efficient solutions for clients in a wide variety of categories including medical office buildings, warehouse facilities, schools, churches, gas stations, automotive companies, automobile dealerships, manufacturing facilities, and many residences. Below, a chart that shows the residential, commercial and utilities installations of solar energy:


According to solarenergy-USA.com ”The U.S. solar industry grew by 125% from Q2 2011 to Q2 2012, making it one of the fastest growing sectors in the U.S. economy. The industry installed 772 MW of solar electric (PV and CPV) capacity in Q2 2012. SEIA forecasts the solar industry will maintain its rapid growth with 2,100 MW of solar electric (PV, CPV and CSP) capacity projected to be installed during the second half of 2012”.

The average pre-incentive cost of going solar decreased 17% in 2010 alone, the most significant annual reductions since the data has been tracked. Costs declined another 11% in the first half of 2011, (Source: Lawrence Berkeley National Lab’s Tracking the Sun IV). Shown below, the cost of solar energy graph:


This same website says that (according to this graph) ”Solar power in the U.S. now exceeds 5,700 megawatts (MW), enough to power more than 940,000 homes”.

Also ”Solar investments create more jobs per megawatt than any other energy resource,  (Source: UC Berkeley Energy Resources Group). 100,237 Americans are currently working in the U.S. solar industry (more than coal mining or steel & iron manufacturing). Solar businesses added 6,735 new workers in all 50 states since August 2010, which represents a 6.8 percent growth rate. During the same 12-month period, jobs in the overall economy grew by a mere 0.7 percent, while fossil fuel electric generation lost 2 percent of its workforce, (Source: Solar Foundation’s National Solar Jobs Census – 2011)”.

We can argue that the Unite States is moving in the right path for using solar energy as a resource. Now, some interesting facts about solar energy around the world and the U.S. provided by solarenergy-usa.com:

  • While the United States pioneered clean energy technologies like solar power, Germany and China now lead in solar panel manufacturing. Further, China attracted $54.4 billion in private finance in 2010 while Germany attracted $41.2 billion and the United States was third with $34 billion.
  • A sunny location (like Los Angeles, California, US) receives an average of 5.5 hours of sunlight per day each year.
  • A cloudy location (like Hamburg, Germany) receives 2.5 hours per day of sunlight each year.
  • Solar modules produce electricity even on cloudy days, usually around 10-20% of the amount produced on sunny days.
  • Monthly average residential consumption of electricity in the US in 2008 was 920 kilowatt hours. Monthly average residential electricity bill in the US in 2008 was $103.67 (Source: US DOE).
  • Over the last 20 years the cost of solar energy systems has come down seven fold. As the demand for systems rises and manufacturing volume increases, costs will decrease and the economic payback time will also decrease.
  • In 2009, the United States was the third largest solar photovoltaic market in the world, after Germany and Italy.  Despite a challenging domestic economic environment, the US market still delivered a growth rate of 36%, strong but not nearly as strong as the 62% growth in 2008.
  • The US market is forecasted to grow to between 4.5-5.5 GW over the next five years, around ten times the size of the 2009 market and an average annual growth rate of 30% per annum.
  • The solar industry employs more than 100,000 Americans, more than twice as many as in 2009. They work at more than 5,000 companies, the vast majority being small businesses, in all 50 states.

Germany: German solar power plants produced a world record 22 gigawatts of electricity per hour – equal to 20 nuclear power stations at full capacity. No other country in the world has ever achieved this record. This shows that Germany, is able to meet a large share of its electricity needs with solar power.”


here we have the Erlasse solar park.

Japan: According to the NY Times ”Japan is poised to overtake Italy and become the world’s second-biggest market for solar power, as incentives starting July 1 propel sales. It could eventually top Germany, which holds the No. 1 spot”. This is also attracting many players that will enter the market for solar energy. “We no longer have enough electricity, especially during the day, and that is when solar power can help,” said Mikio Katayama, chairman of the electronics manufacturer Sharp and the Japan Photovoltaic Energy Association. “This is a very good rate to promote investment and megasolars.”

About 1.6 per cent of the energy generated in Japan last years constituted of renewable resources, they were the smallest ones compared to other industrialized countries like the U.S. or germany. The shift toward solar reflects concern that the cost of fossil fuels will rise in the coming decades.


Sources:

Bloomberg. “Japan Poised to Become Second-Biggest Market for Solar Power.” The New York Times. NY Times, 19 June 2012. Web. 20 Oct. 2012. <http://www.nytimes.com/2012/06/19/business/global/japan-poised-to-become-second-biggest-market-for-solar-power.html?pagewanted=all>.

Kirschbaum, Erik. “Germany Sets New Solar Power Record, Institute Says.”Reuters. Thomson Reuters, 26 May 2012. Web. 20 Oct. 2012. <http://www.reuters.com/article/2012/05/26/us-climate-germany-solar-idUSBRE84P0FI20120526>.

“Promoting Solar Energy around the World.” Unido.org. UNIDO, 29 Feb. 2010. Web. 20 Oct. 2012. <http://www.unido.org/index.php?id=7881>.

“Solar Energy.” National Geographic. N.p., n.d. Web. 20 Oct. 2012. <http://environment.nationalgeographic.com/environment/global-warming/solar-power-profile/>.

“Solar Facts.” Solar Energy USA. N.p., n.d. Web. 20 Oct. 2012. <http://solarenergy-usa.com/about-solar-energy-solutions/solar-facts/>.
Website

Solar Energy Lab

Working tools:

  • One solar cell
  • One voltage probe
  • One NXT adaptor
  • NXT with light sensor
  • One light source
  • Labview VI
  • Ruler
  • Colored film filters (I refer to as color prints)
  • Excel sheet

For our in class experiment we measured the relationship between light intensity and the voltage output of the solar cell, as well as the relationship between the wavelength of light and the voltage output of the solar cell. On top of that, we measured the intensity of the light by using different color prints to see how color affects the voltage produced. We base on the fact that the higher the intensity, the more photons generated, hence, greater current and voltage

First, we applied no direct light to the solar panel, and the result was clearly reflected as a poor voltage production. Secondly, we applied direct light with no distance from the solar panel obtaining a high (the highest) intensity of voltages. Then we proceded to take 3 attempts increasing distance, so by  using a ruler we first measured 1 inch distance, then 3, and lastly 6 inches of distance. In the graph that I will show below, you will be abble to appreciate how intensity diminishes as distance from the light and the solar panel increases (please note that for each attempt we got a voltage average):

For our next task, we did not use distance, but we used direct light using different color prints, surprisingly, i did not know that colors had such a big influence on the intensity of the voltage. We used 4 different colors: blue, green, orange, and pink. This is what happened:

Interestingly (remember, applying direct light with no distance), we found out that the highest intensity was generate by the light passing through the orange print (.14 voltages), the next more intense one was blue (.12+ voltages), followed by pink not so different with .117 voltages, and the one that generated less intensity was the green color with only .06 voltages

After concluding our experiment we were able to see how light and distance affect the intensity of the energy (voltages) generated in solar cell. We also studied how colors significantly affect he intensity  by blocking some of the energy coming directly from light.

Hydrofracking

Natural gas hydraulic fracturing or ”Hydrofracking” is a more economical/newer gas extraction process than regular extraction methods. Hydrofracking was first developed by Halliburton Incorporation and Messina Incorporation. According to epa.gov, ”Natural gas plays a key role in our nation’s clean energy future. The U.S. has vast reserves of natural gas that are commercially viable as a result of advances in horizontal drilling and hydraulic fracturing technologies enabling greater access to gas in shale formations”. This process is thought to be another conventional way of obtaining resources without harming and polluting the environment so much. Unfortunately, hydrofracking consumes vast amounts of water (nearly 6 to 8 million gallons of freshwater per fracking) and it uses some chemicals that are toxic which have a long term impact and are indeed harmful. On top of that, epa.gov conducting a study to determine the impacts that hydrofracting does to drinking water.

Let us begging by understanding what hydrofracting is all about. Slick water fracturing (hydrofracting) involves drilling a hole downwards, until it reaches the natural gas source, then a the drill is oriented horizontally, extending as long as eight thousand feet in each direction. In this following image we can easily see how the system works:

In the Hydrofract zone described in the bottom right of the picture, is when the action begins. 6-8 million gallons of water run down the pipe with enormous pressure and force to generate the so called fractures in the rock to create a passage for the natural gas to flow and follow. The natural gas is then extracted (as much as needed/available) and it becomes ready to be transported.  But is it only water what fractures the rocks? NO, several chemical-base additives are added to the water to facilitate and accelerate the fracturing processes. These chemicals are mixed with water and sand to produce a slurry that is injected into the shale formation, 6 to 9 thousand feet below the surface. hydraulicfracturing.com provides a list of chemicals used and their description and usage. here it is:


FRACTURING INGREDIENTS
Product Purpose Downhole Result Other Common Uses*
Water and Sand: ~ 98%
Water Expand the fracture and deliver sand Some stays in formation, while the remainder returns with natural formation water as produced water (actual amounts returned vary from well to well) Landscaping and manufacturing
Sand
(Proppant)
Allows the fractures to remain open so that the natural gas and oil can escape Stays in formation, embedded in fractures (used to “prop” fractures open) Drinking water filtration, play sand, concrete and brick mortar
Other Additives: ~ 2%
Acid Helps dissolve minerals and initiate cracks in the rock Reacts with minerals present in the formation to create salts, water and carbon dioxide (neutralized) Swimming pool
chemicals and cleaners
Anti-bacterial Agent Eliminates bacteria in the water that produces corrosive byproducts Reacts with micro-organisms that may be present in the treatment fluid and formation; these micro-organisms break down the product with a small amount of the product returning in the produced water Disinfectant; sterilizer for medical and dental equipment
Breaker Allows a delayed breakdown of the gel Reacts with the crosslinker and gel once in the formation, making it easier for the fluid to flow to the borehole; this reaction produces ammonia and sulfate salts, which are returned to the surface in produced water Hair colorings, as a disinfectant, and in the manufacture of common household plastics
Clay stabilizer Prevents formation clays from swelling Reacts with clays in the formation through a sodium-potassium ion exchange; this reaction results in sodium chloride (table salt), which is returned to the surface in produced water Low-sodium table salt substitutes, medicines and IV fluids
Corrosion inhibitor Prevents corrosion of the pipe Bonds to metal surfaces, such as pipe, downhole; any remaining product that is not bonded is broken down by micro-organisms and consumed or returned to the surface in the produced water Pharmaceuticals, acrylic fibers and plastics
Crosslinker Maintains fluid viscosity as temperature increases Combines with the breaker in the formation to create salts that are returned to the surface with the produced water Laundry detergents, hand soaps and cosmetics
Friction reducer “Slicks” the water to minimize friction Remains in the formation where temperature and exposure to the breaker allows it to be broken down and consumed by naturally occurring micro-organisms; a small amount returns to the surface with the produced water Cosmetics including hair, make-up, nail and skin products
Gelling agent Thickens the water to suspend the sand Combines with the breaker in the formation, making it easier for the fluid to flow to the borehole and return to the surface in the produced water Cosmetics, baked goods, ice cream, toothpastes, sauces and salad dressings
Iron control Prevents precipitation of metal in the pipe Reacts with minerals in the formation to create simple salts, carbon dioxide and water, all of which are returned to the surface in the produced water Food additives; food and beverages; lemon juice
pH Adjusting Agent Maintains the effectiveness of other components, such as crosslinkers Reacts with acidic agents in the treatment fluid to maintain a neutral (non-acidic, non-alkaline) pH; this reaction results in mineral salts, water and carbon dioxide — a portion of each is returned to the surface in the produced water Laundry detergents, soap, water softeners and dishwasher detergents
Scale inhibitor Prevents scale deposits downhole and in surface equipment Attaches to the formation downhole with the majority of the product returning to the surface with the produced water, while the remaining amount reacts with micro-organisms that break down and consume it Household cleansers, de-icers, paints and caulks
Surfactant Increases the viscosity of the fracture fluid Returns to the surface in the produced water, but in some formations it may enter the natural gas stream and return in the produced natural gas Glass cleaners, multi-surface cleansers, antiperspirants, deodorants and hair colors


This is what the slurry looks like:

I was amazed when I learned that in order for hydrofracting to function faster and more efficiently, all of these mostly toxic chemicals have to be used. It certainly becomes a concern now not only to me but to the people and the environment. The same website argues that ”The environmental/ water quality/public health problem arises when the slurry is withdrawn. One to 3 million gallons of used slurry will be ‘produced’ per well. There will be hundreds, possibly thousands of wells. Where is all this water going to come from? How will the used slurry be stored? What will the fate of the slurry be?” These are all questions that the incorporations that operate hydrofracting should take into account. Inmense amount of water is being used, thousands of drills and wells are being made, and several long-term-life chemicals (toxic) are released and could contaminate drinking water sources. EPA is now studying whether the water is being contaminated and if so, how are they going to stop it. Something has to be done in oder to preserve and take care of the environment we live in. We also have to take into consideration what happens before the drill is made. Suppose there is a wood, and thousands of feet underneath lies a vast source for natural gas, the incorporations that do hydrofracting are not going to think about how petty the trees are, they are going to chop all of the trees down, and clear the area in order to have easy access to the gas resource; moreover, when they are done, they go home and leave the area damaged and makes it incredibly hard for life to grow back in there due to all the chemicals used.

On the positive side, hydraulicfracturing.com says that ‘Hydraulic fracturing is a proven technological advancement which allows producers to safely recover natural gas and oil from deep shale formations. This technology has the potential to not only dramatically reduce our reliance on foreign fuel imports, but also to significantly reduce our national carbon dioxide (CO2) emissions and accelerate our transition to a carbon-light environment” Both arguments are clearly valid, the first one being reduced reliance on foreign fuel imports and second, the reduction of CO2. As bad as it could look, this methods is cleaner than the regular processes. Now, I apologize for my ignorance on how to upload a video on the blog but I highly reccomend you watch this video (even before you start doing your own blogs about this topic) it will be very helpful and its easy top follow:

chesapeake energy hydraulic fracturing method

Sources:

“Hydraulic Fracturing.” Fracturing Ingredients. Chesapeak Energy, n.d. Web. 07 Oct. 2012. <http://www.hydraulicfracturing.com/Fracturing-Ingredients/Pages/information.aspx>.

“Natural Gas Extraction – Hydraulic Fracturing.” EPA. United States Environmental Protection Agency, n.d. Web. 07 Oct. 2012. <http://www.epa.gov/hydraulicfracture/>.

“What Is Hydrofracking?” Peacecouncil.net. Neighbors of the Onondaga, n.d. Web. 07 Oct. 2012. <http://www.peacecouncil.net/NOON/hydrofrac/HdryoFrac2.htm>.

Generator Experiment

October 1st, 2012.

The experiment that we worked on monday was about how energy is produced by using a tube that had a magnet and by shaking  the tube the magnet would travel back and forth through a coil of wires generating energy. The goal of our experiment was to correlate the number of shakes of the generator using a thirty second time interval along with the sum of the squares of the voltages in order to see how the number of shakes related to the amount of energy generated. In other words, to see how by shaking the generator faster within that time interval, more energy would be generated than applying less shakes.

We used 5 attempts in order to provide the information to a scatter plot on excel so we would appreciate much more easily the fluctuations of the voltages given certain rates of shaking.

To get started, we plugged the wires from the generator to the robotic computer and this one would process the voltages to report them in the generator lab. on the main PC. my classmate and I had some difficulties at the beginning with the computer connection but we solved the problem to perform our task.

We did not use an increasing rate (shaking it faster each time), instead we did random rates of shaking so that our scatter plot would fluctuate on a six-sag form. This is what we obtained after doing the five attempts and calculating the sum of the squares of the voltages that were reported in the Generator Lab.


On this chart we have the number of shakes on our X axis, and the voltage on the Y axis. The blue dots represent each five attempts of shaking within a 30 second window. We first did 0 shakes, then we did about 95 of them and resulted in the highest ammount of voltage. Now, you may think that something is wrong with the chart, because the other 3 attempts generated such little voltage with much more shakes. What we believe happened is that since we shook the generator so fast, we did not do it in an horizontal proper way so the magnet did not have sufficient contact with each end of the generator. When we did it 95 times, it was in a consistent back and forth motion, thus, generating more voltage.

That concluded our experiment for that day.

Ways Used By The Automobile Industry To Increase Gas Mileage

Ever since gas prices began to rise, people became concerned about increasing gas mileage. Companies are fighting to show who is better off at getting further at the lowest price possible. This issue has also motivated companies and engeneeres to develop the so called hybrid and electric cars. On top of that, a variety of products have been developed in order to make the engines more efficient and to improve fuel economy. Encyclopedia.com mentions ”Automakers around the globe are also engaged in developing new technologies and products, such as electronic fuel cells, navigational systems that manage congestion problems, and “telematics”(telecommunications capabilities)”, all of these new ways that have been developed are contributing significantly to help with fuel economy and become less pollutant.

The fuel cell uses fuel hydrogen and oxygen from the air in order to produce energy while a hybrid car has a symbiotic relationship in its internal engine (as an example from fuel economy.gov ”The electric motor applies resistance to the drivetrain causing the wheels to slow down. In return, the energy from the wheels turns the motor, which functions as a generator, converting energy normally wasted during coasting and braking into electricity, which is stored in a battery until needed by the electric motor”.

One of the ways used by the automobile industry to increase gas mileage is to develop better cars. Nowadays in Boston, most of the taxies that we see in the street (toyota Camry as an example) are electric cars. These electric vehicles can be plugged into a power outlet in order to fill the power levels just like a regular gas-based car. When these vehicles come to a stop (in a traffic light) the engine shuts down to preserve energy, and when the driver hits the gas pedal ,the engine automatically turns on to continue its touring. Not only cab companies have these cars though, also car rentals and dealerships offer electric cars.

The government has also made a big impact in the car industry. For example, President Obama declared new rules and regulations for the automobile industry in order to promote an increase in the gas mileage, as an article in the NY Times says ”President Obama announced new automobile fuel-efficiency standards that require an average 54.5 miles per gallon by 2025”, The main standard was to increase the fuel economy to 54.5 miles per gallon for regular cars and small trucks by 2025. Achieving this goal is not going to be easy and it will required great deal of technology advances along with better ideas in order to create the perfect car. The same article also shows that these new standards are set to ” make consumers will save $1.7 trillion at the pump, $8K per vehicle by 2025”, and to create ”Incentives for electric vehicles, plug-in hybrid electric vehicles, and fuel cells vehicles; Incentives for advanced technology packages for large pickups, such as hybridization and other performance-based strategies;Credits for technologies with potential to achieve real-world CO2 reductions and fuel economy improvements that are not captured by the standards test procedures”. We can see in the commercials on TV nowadays how the car companies induce us to buy hybrids or electric vehicles.

Sources:

“How Hybrids Work.” How Hybrids Work. U.S. Government, 27 Sept. 2012. Web. 30 Sept. 2012. <http://www.fueleconomy.gov/feg/hybridtech.shtml>.

“President Obama Announces Historic 54.5 Mpg Fuel Efficiency Standard .”Nhtsa.gov. U.S. Government, 29 July 2011. Web. 30 Sept. 2012. <http://www.nhtsa.gov/About NHTSA/Press Releases/2011/President Obama Announces Historic 54.5 mpg Fuel Efficiency Standard>.

“The Automobile Industry.” Encyclopedia.com. N.p., 2008. Web. 30 Sept. 2012. <http://www.fueleconomy.gov/feg/hybridtech.shtml>.

Energy Experiment 9-24

Today’s experiment was a bit more challenging than the previous one. For this experiment we were required to calculate the acceleration that a pulley produced to a certain weight. Unfortunately, the system of the University did not allow us to view the ”Actual” (computerized) data that was recorded in the computer. What we did instead was use fixed numbers to calculate the acceleration.

For the first task, we had to evaluate acceleration depending upon the force and the mass, and sort of play around with it in order to observe the changes in acceleration.

With my classmate, we obtained the following scatter plot for the first 5 set of calculations:


Here we can see how, using a constant force of 10 (unit in the program), the acceleration decreases as mass increases (kg)

And for the next set:


Here, with a variable increasing force from 10-120, and a constant mass (kg), acceleration increased as force increased (common sense).

As a second task, we had to predetermine the potential energy for each mass (of our pulley system)

Force Mass KG Acceleration Gravity Height Potential energy (Joules)
10 50 0.05 200 9.8 0.27 0.1323
10 100 0.1 100 9.8 0.27 0.2646
10 150 0.15 67 9.8 0.27 0.3969
10 200 0.2 50 9.8 0.27 0.5292
10 250 0.25 40 9.8 0.27 0.6615
10 250 0.25 40 9.8 0.27 0.6615
20 250 0.25 80 9.8 0.27 0.6615
40 250 0.25 160 9.8 0.27 0.6615
80 250 0.25 320 9.8 0.27 0.6615
120 250 0.25 480 9.8 0.27 0.6615

Calculating Potential Energy, requires: Mass x Gravity x Height = Joules. As shown in the last column, potential energy was calculated.

That concluded our experiment.

Lab Exercise 2: Measuring Distance and Velocity

Fortunately, for this lab exercise, my classmate and I were provided a complete lego car already built with all of its pieces in order. At the beginning we did not expect we would accomplish the entire work but thanks to my classmate we concluded the exercise with great results.

The first step was to plug the cables from the engines to the lego car then to the CPU so that the car would run based on the units indicated on the program. On a first attempt, we gave more power to one of the engines resulting into a rotating car. Later, we measured the diameter of the wheel and computed the circumference in meters in order to be abbe to record the distance and turns of the wheel.

Secondly, we manually measure (with a ruler) the distance that the car would tour. This was compared to the actual distance recorded by the computer (which is the actual precise distance) in order to find the percent of error. Our professor was surprised to find that our intervals were not that far apart and we were actually doing a very precise job measuring the distance with a ruler.

After concluding our exercise, we began to experiment with the lego car. First we gave it the maximum power which it was 127, the car just busted almost off the table. We also made it turn three times by giving it power only in one of the engines that moves the wheels. I learned how to calculated the percentage of error and how to use it in further experiments, I found the exercise with the lego fun and interesting and I am looking forward for more exercises like this one.