Keystone XL Pipeline

What is the Keystone XL Pipeline? The Keystone Pipeline already exists. What doesn’t exist fully yet is its proposed expansion, the Keystone XL Pipeline. The existing Keystone runs from oil sand fields in Alberta, Canada into the U.S., ending in Cushing, Oklahoma. The 1,700 new miles of pipeline would offer two sections of expansion. First, a southern leg would connect Cushing, Oklahoma with the Gulf Coast of Texas, where oil refineries exist in abundance. That leg went into operation in January 2014. Second, the pipeline would include a new section from Alberta to Kansas. Here, it will pass through a region where oil extraction is currently booming and take on some of this crude for transport.The southern leg of the Keystone XL ties into the existing Keystone pipeline that already runs to Canada, bringing up to 700,000 barrels of oil a day to refineries in Texas. At peak capacity, the pipeline will deliver 830,000 barrels of oil per day.

What is the current state of the Keystone XL Pipeline addition to Canada? TransCanada has been attempting to get a permit for the pipeline project for more than five years. Since the northern leg of the pipeline crosses international borders, TransCanada needs to obtain a Presidential Permit through the State Department for construction of the portion of the pipeline that goes from Canada to the U.S. Most recently, in mid-April 2014, the Obama administration postponed again a decision on a Presidential Permit, citing uncertainty about a court case in Nebraska over the pipeline’s route. While the northern leg stalled, TransCanada went ahead on the southern leg. In the image below the blue dashed line is the section in question.

Keystone-Map

How many jobs will the pipeline create? The numbers vary largely, so there is not a clear consensus on how many jobs will be created. TransCanada estimates the pipeline would bring 20,000 new jobs to the US. The State Department released a report in March 2013 stating that the pipeline could (directly or indirectly) create up to 42,000 jobs, including 3,900 construction jobs. But President Obama refuted that in July 2013, claiming “the most realistic estimates are this might create maybe 2,000 jobs during the construction of the pipeline, which might take a year or two, and then after that we’re talking about somewhere between 50 and 100 jobs in an economy of 150 million working people.” Some estimates have gone as high as 500,000, but that number seems very unrealistic.

What are the environmental impacts? One of my resources, the Natural Resources and Defense Council opposes the pipeline, largely due to the environmental impacts. They are not alone, as there are many who agree that the pipeline is damaging to the environment. A large issuse comes from the use of tar sands found in the deposits in Canada. The scientific name for tar sand is bitumen, a mixture of clay, sand, water, and oil that with modern technology can be refined into usable oil. Critics say that it is more corrosive than conventional oil. A report by a coalition of critics that include the Sierra Club and the Natural Resources Defense Council claimed that “bitumen blends are more acidic, thick and sulfuric than conventional crude” and “contain significantly higher quantities of abrasive quartz sand particles.” There are worries that it could cause corrosion and therefore leaks in the pipeline. There have been leaks in the past, however, they have been due to faulty fittings and seals at pump or valve stations. Environmentalists also point to the process of refining tar sands oil, saying it will create large amounts of greenhouse gas emissions, though the exact percentage increase is debated.

References:

1. Natural Resources Defense Council

http://www.nrdc.org/energy/keystone-pipeline/

2. TransCanada

http://keystone-xl.com/about/the-keystone-xl-oil-pipeline-project/

3. State Impact

https://stateimpact.npr.org/texas/tag/keystone-xl-pipeline/

Brainstorming Session #1

My partner for the experiment project is Jill Swan. Jill came up with an idea relatively early on in our brainstorming process to do an experiment relating to the energy use of different kinds of light bulbs. We hear everywhere that LED’s are the best, most efficient light bulbs, but we want to put that to the test.

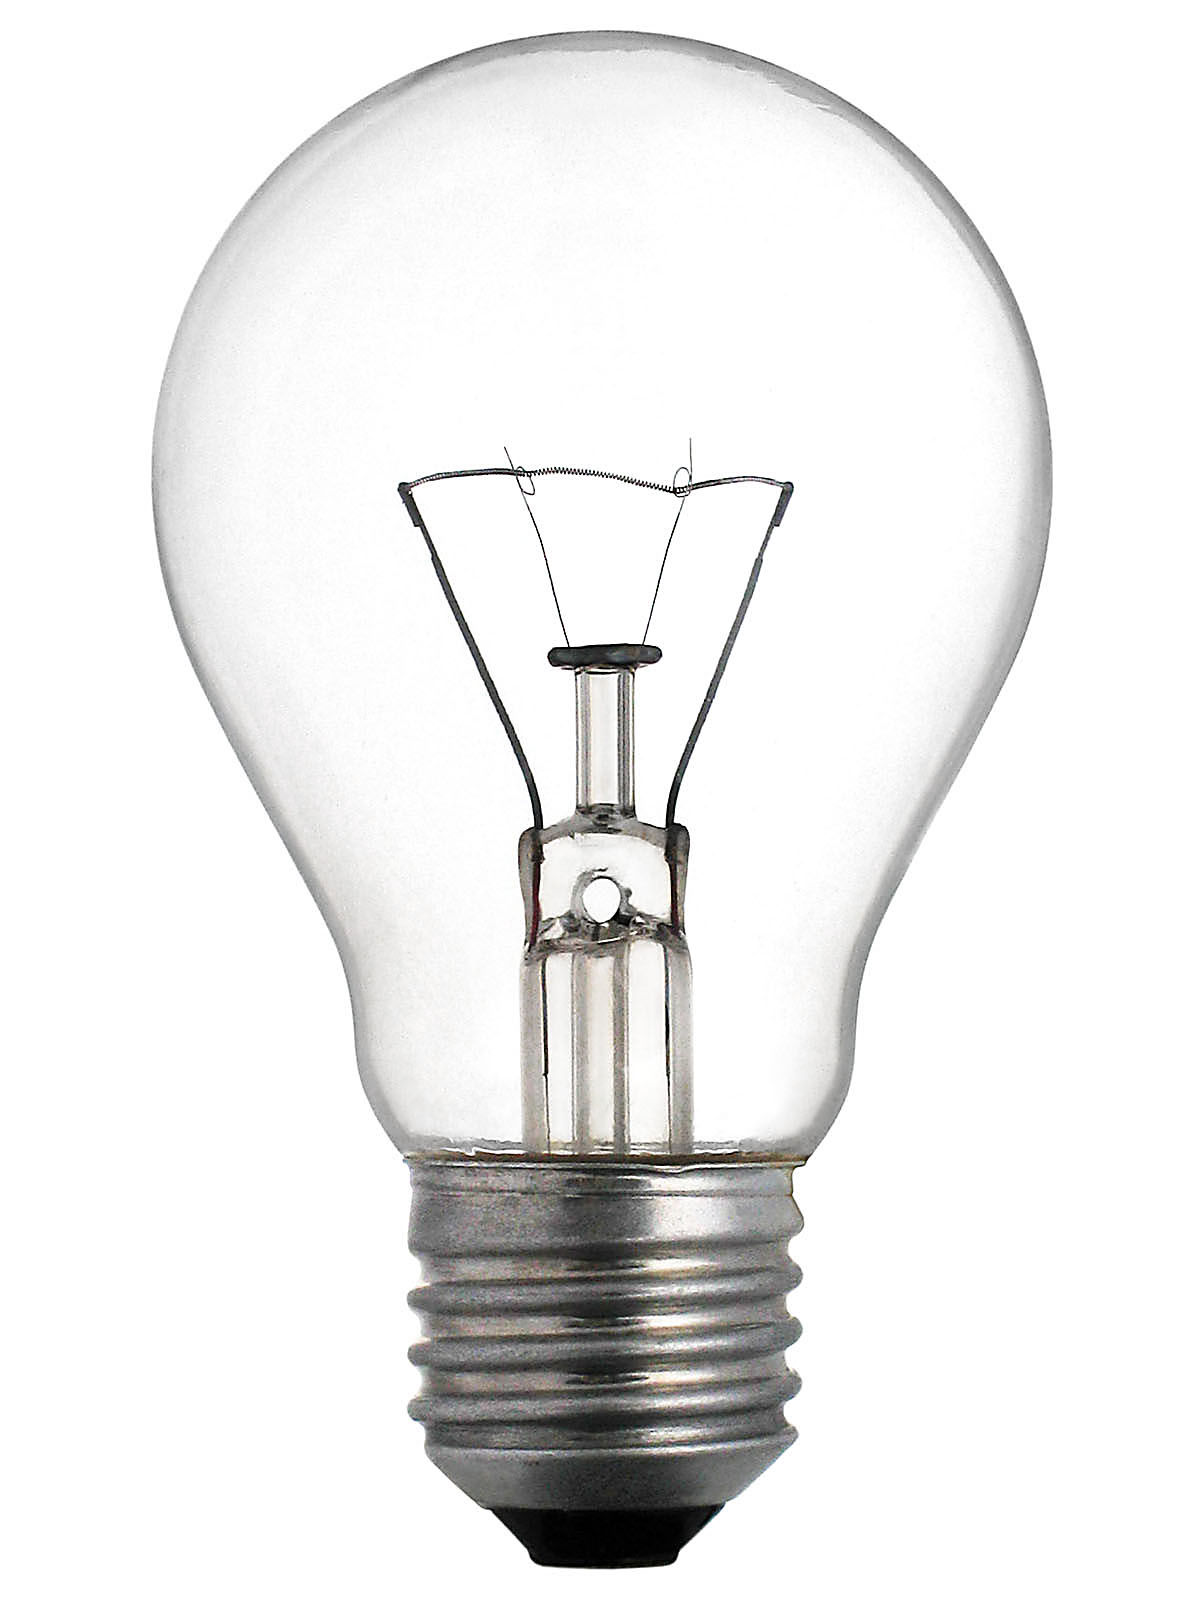
The plan for the experiment is to power a socket that is connected to a switch and an outlet. Three types of light bulbs will be screwed into the socket one after the other- compact fluorescent, LED, and incandescent (pictured below in that order).

06_Spiral_CFL_Bulb_2010-03-08_(white_back) Feit-LED-7.5-Watt-40-watt-replacement-Dimmable-A19-in-Warm-White-3000K incandescent


Two things will be evaluated in our experiment- a multimeter will be used to measure the electricity being used and a solar cell will measure the light output. The bulbs are all the same wattage (60). Like the previous experiments in class, the student will take the average of 3-5 trials and use those numbers to graph the information to determine the efficiency of the light bulbs. Jill and I hypothesize that the LED will be the most efficient, followed by the CFL, with incandescent being the least efficient.

Since our brainstorming session we have gathered the needed materials at Home Depot and have a plan for how we are going to assemble all the pieces to make a working circuit. We met a very helpful man at Home Depot who assisted us and have also done research on the internet. One of the biggest concerns for us is the safety of ourselves and the other students who will be handling the experiment. We are not familiar with the wiring for electrical circuits and so we have purchased some items to keep everyone safe. We have electrical tape to cover the exposed wires so that no one can touch them and be electrocuted and we have a box to hold the switch as a back-up safety measure.

We have divided the work up as follows: Friday during class we are going to try and assemble the experiment. We will communicate over google drive to work together on the experiment handout. Over Thanksgiving break I will make the powerpoint. I will send it to Jill to make sure she agrees with what I have out together. Jill will write the final blog post and she will send it to me to make sure I agree with what she has written.

MIT Nuclear Reactor

The MIT Nuclear Reactor has been in commission for 54 years. “NRL has provided a safe and reliable neutron source and the infrastructure to facilitate use of that source. During its long and distinguished history, the NRL has supported educational training and cutting-edge research in the areas of nuclear fission engineering, material science, radiation effects in biology and medicine, neutron physics, geochemistry, and environmental studies.”

The nuclear reactor does not produce energy. It is for research purposes only. It also does not do any research into information that relates to weaponry. The reactor allows for student interaction, a great benefit to MIT and other students who want a hands on experience in regards to nuclear reactors.

The reactor there today is the second generation model, referred to as the MITR-II. In 1973, the MITR-I was shut down to allow conversion to the MITR-II, which offered a higher neutron flux level. The current reactor is a heavy-water reflected, light-water cooled and moderated nuclear reactor that utilizes flat, plate-type, finned, aluminum-clad fuel elements.

There are many safety precautions at the nuclear reactor lab- background checks, signatures at the reception desk, radiation measurements in multiple forms, full-time operator, pressurized chamber, metal and concrete containers to hold radioactive material, just to name some of the many ways the lab ensures the safety of its employees and the people and systems that could be affected. There are many fail safes to ensure no radioactive material gets released from the lab. The reactor is in a special containment building, so if anything were to happen, the material would be kept from leaving the lab.

One thing I found interesting during the visit was that the lab helped make radioactive “seeds” for cancer treatment. I think it is great they are using the resources to contribute positively to the community.

I was not aware until this class that a nuclear reactor was so close to where I live. The trip reinforced my thoughts that nuclear reactors can be very safe when the proper precautions are taken.


Pandora’s Promise

Pandora’s Promise is a documentary covering the debate over nuclear power. It presents the aspects of both sides, pro and anti-nuclear and many of the pro-nuclear interviewees were at one time anti-nuclear. This provides an interesting perspective on how some very enthusiastic environmentalists publicly condemning nuclear power can now be very much so in support of nuclear power.

Overall the documentary presents a position in support of nuclear power and does so by “debunking” many of the myths associated with nuclear power. These myths mostly center around the danger nuclear power presents such as the history of nuclear accidents- Three Mile Island, Fukushima, Chernobyl… They addressed the fact that the death toll is thought to be very high, with some extremists (as shown in the documentary) when that is actually not the case at all. Nuclear power has one of the lowest amount of deaths in regards to energy types, an even lower position than solar energy.

I was not aware of the varying levels of background radiation that exists everywhere in varying quantities. Radiation is a naturally produced substance and it is different when one goes to different locations, such as being higher in high altitudes. Chernobyl had a lower amount of radiation than many other locations, so what does this mean? Many people who lived in the area before the accident have returned and, as far as they are aware, no one has suffered any deaths related to the radiation.

One of the most interesting parts of the documentary in my option was when the fine print of an anti-nuclear add was read and it turned out to be sponsored by the oil and gas industry. It is true that solar and wind energy at this point are not capable of making up for the energy production fossil fuels contribute, at least not today and maybe not ever.

The fact is that the world’s energy needs are continuing to grow, especially as third world countries develop. Electricity brings a higher quality of life to people and the people of developing countries are making strides in gaining access to electricity. As this energy demand grows, so does the strain on the environment as we use resources (fossil fuels) that produce emissions. Nuclear is a very clean producer of energy and it can reuse its fuel! The dangerous products that nuclear energy produces are very minimal and can safely be stored. New models of reactors can even use this stored material as fuel.

While I was in support of nuclear energy before this documentary, it did a clear and concise job of explaining many of the key issues people, including myself, associate with nuclear power- weapons, toxic material, safety… I feel it is very informative and addresses the issues in ways that the general public can understand. There are many misconceptions when it comes to nuclear energy and it is an interesting take having people who used to believe in those misconceptions take part in the explanation of why they are inaccurate.

Solar Energy Experiment

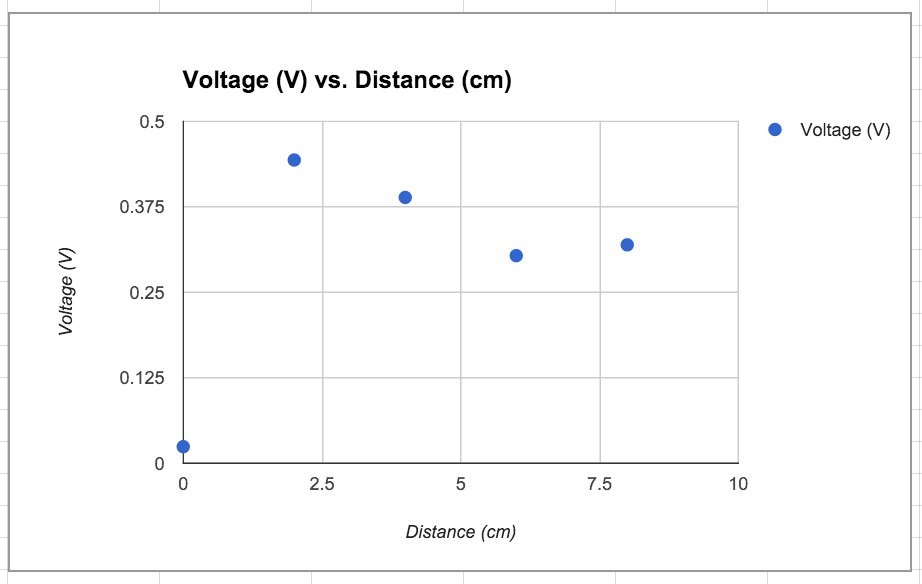
In the Solar Energy experiment, I worked with my partner to experiment with the effect distance has on voltage as well as how filter color affects voltage.

The first chart demonstrates the results we got in regards to distance and voltage. We had a flashlight and a small solar cell and held the flashlight at different distances from the solar cell. The distances were 0 cm, where the solar cell was turned upside down against the table in an attempt to block all light from it, 2 cm, 4 cm, 6 cm, and 8 cm. For the most part, each time the flashlight got farther from the solar cell, the amount of voltage decreased. This makes sense with what we learned in class, as the closer the light source is to the solar cell the higher the voltage.Screen Shot 2015-11-07 at 4.48.47 PM The second graph represents our results in regards to the filters. We experimented with four filter colors, yellow, red, blue, and purple. Yellow allowed for the highest amount of voltage while red allowed for the lowest. Second and third highest were purple and blue respectively. Screen Shot 2015-11-07 at 4.48.55 PM

Solar Energy Efforts Around the World

There are many interesting ways to harness solar energy. These ideas come from all over the world. I will be discussing three of them in this post.

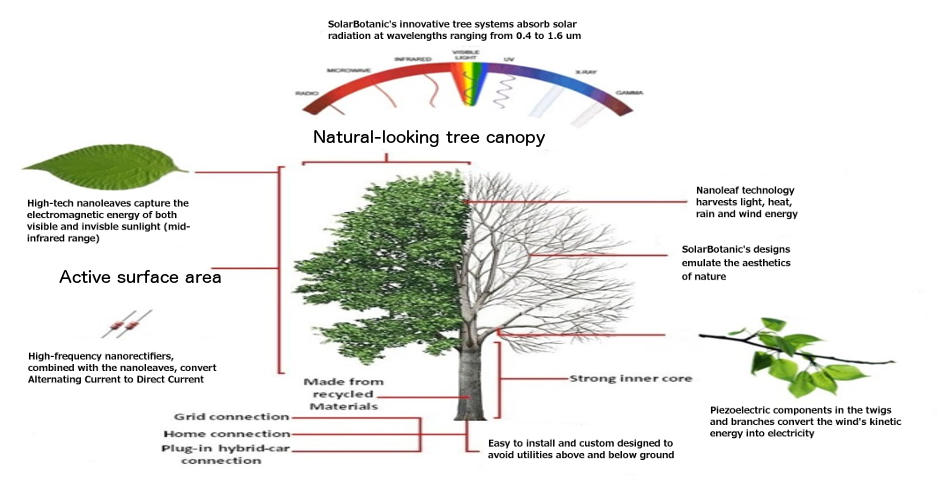
1. Solar Botanic is a company in London that creates “trees” that people can “plant” aka install on their property to harness the energy from the sun, as well as the power of the wind. While the artificial trees from Solar Botanic don’t exactly have the ability to remove carbon emissions and pollution like a natural tree, these trees can directly provide power to your car and your home. Nanoleaves, composed of nantenna electromagnetic collectors, convert both “visible” and “invisible” radiation into electricity. This sophisticated approach allows for energy to be gathered at a high efficiency even after the sun has set, or on a cloudy day. The image below represents how the product works.

tech-tree

2. Scott and Julie Brusaw have created and are still in the research and development stage of Solar Roadways. They are a startup company founded in 2006 in Sandpoint, Idaho. If immediately implemented, an entirely unrealistic prospect even by the company’s own admission, with commercially produced solar panels available today, the resulting energy savings gained from not burning fossil fuels could cut the nation’s greenhouse gas emissions in half, according to  Solar Roadways projections. Solar road panels are made with layers of super-strong glass embedded with photovoltaic cells, electrical wiring and LED lights, which can be used to create signs on the surface directing traffic or alerting motorists to hazardous conditions. The picture below is a rendering of what a Solar Roadway would look like.

Sandpoint Sidewalk - small

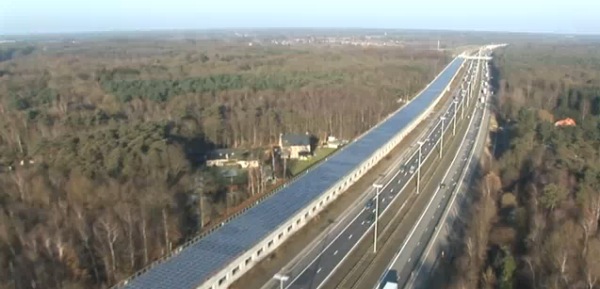
3. Engineers in Belgium officially switched on Europe’s first solar powered train tunnel, spanning a 2.1-mile stretch of the rail line connecting the City of Lights to Mokum. The installation’s 16,000 solar panels will be used to provide 50 percent of the energy needed to power nearby Antwerp Central Station and to provide extra juice for both high-speed and traditional trains. Originally developed to help protect travelers from falling trees in an ancient forest, the project is expected to produce up to 3,300 megawatts hours per year, while decreasing annual CO2 emissions by about 2,400 tons.

solar-tunnel


References:

1. Solar Botanic

http://solarbotanic.com/how-it-works/

2. Biofriendly Corporation

http://biofriendly.com/blog/solar/10-inventive-ways-to-use-solar-power/

3. How Stuff Works

http://science.howstuffworks.com/environmental/energy/solar-roadways.htm

4. Engadget

http://www.engadget.com/2011/06/07/europes-first-solar-powered-train-tunnel-goes-live-on-belgian-h/

Self-Study of Nuclear Energy

The details of how nuclear energy works has been discussed in previous posts, but as a refresher, the following paragraph is a summary.

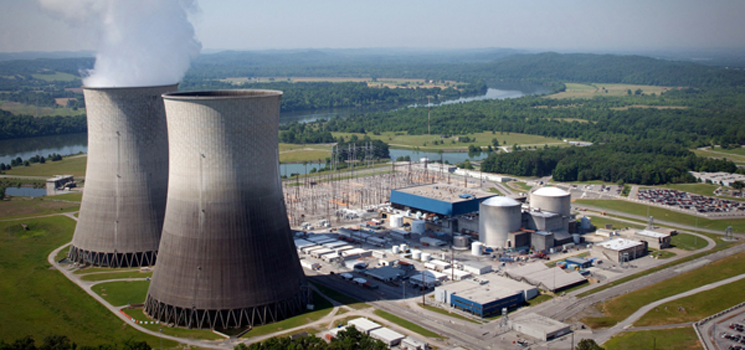
A nuclear reactor produces electricity in much the same way other power plants do.  Some form of energy creates heat, which turns water into steam.  The pressure of the steam turns a generator, which produces electricity. The difference is in how the heat is created. Power plants that run on fossil fuels burn coal, oil or natural gas to generate heat.  In a nuclear energy facility, heat is produced from splitting atoms – a process called nuclear fission.  Enriched uranium is the fuel for nuclear reactors.  Uranium is an abundant, naturally radioactive element found in most rocks.  As uranium breaks down or decays, it produces heat inside the Earth’s crust.  A similar process generates heat inside a nuclear reactor. The image below is a graphic representation of the production of nuclear energy.

process-en

Globally, there have been at least 99 (civilian and military) recorded nuclear power plant accidents from 1952 to 2009 (defined as incidents that either resulted in the loss of human life or more than $50,000 of property damage, the amount the US federal government uses to define nuclear energy accidents that must be reported), totaling $20.5 billion in property damages. Property damage costs include destruction of property, emergency response, environmental remediation, evacuation, lost product, fines, and court claims. Because nuclear power plants are large and complex, accidents on site tend to be relatively expensive. The International Atomic Energy Authority ranks them using an International Nuclear Events Scale (INES) – ranging from ‘anomaly’ to ‘major accident’, numbered from 1 to 7. Some of the worst accidents include:

>Chernobyl, Ukraine- INES Level 7, 1986

>3 Mile Island, Pennsylvania- INES Level 5, 1979

>Fukushima, Japan- INES Level 7, 2011


References:

1. ENEC

http://www.enec.gov.ae/learn-about-nuclear-energy/how-does-nuclear-energy-work/#nuclear-fission

2. The Guardian

http://www.theguardian.com/news/datablog/2011/mar/14/nuclear-power-plant-accidents-list-rank

3. Wikipedia- List of Nuclear Power Accidents By Country

https://en.wikipedia.org/wiki/List_of_nuclear_power_accidents_by_country#cite_note-bksaccident-7

4. Take Part

http://www.takepart.com/photos/11-worst-nuclear-accidents/windscale-pile-great-britain-ines-level-5-1957

Fukushima Daiichi Nuclear Disaster

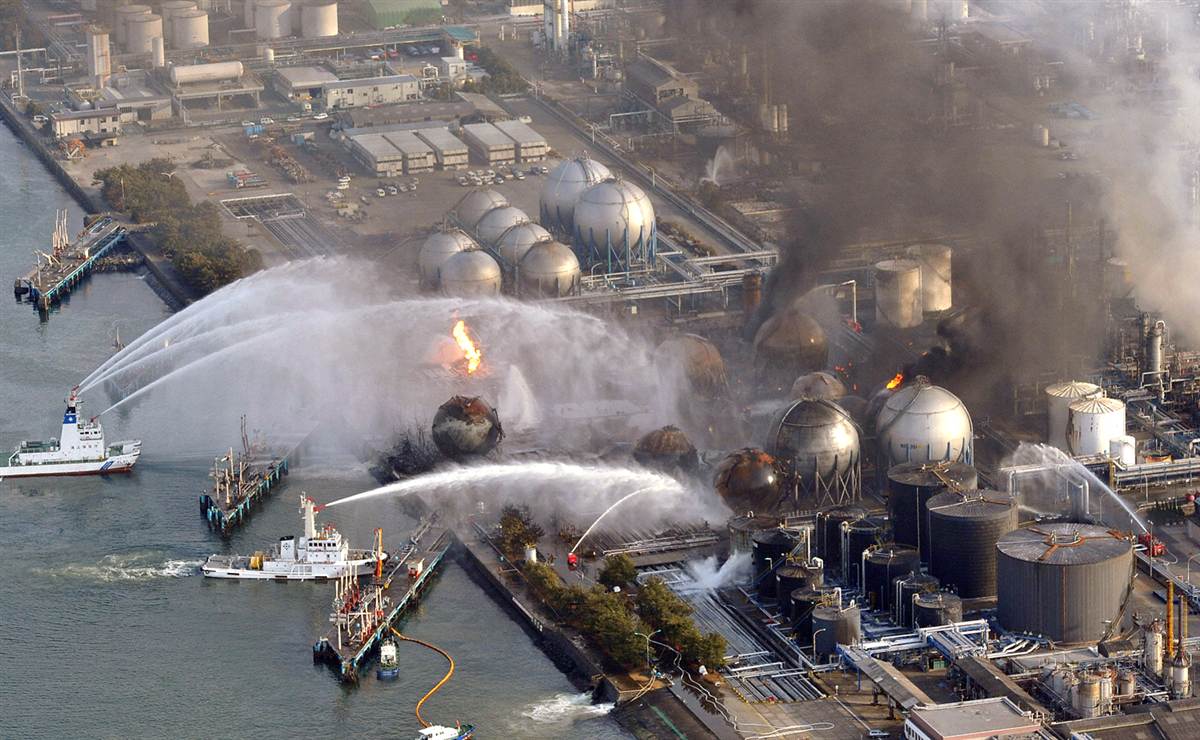
The Fukushima Daiichi Nuclear Disaster- What happened? The Great East Japan Earthquake (magnitude 9.0) occurred on March 11, 2011 at 2.46 pm and did considerable damage in the region. The large tsunami it created caused significant damage as well. Fukushima Daiichi was one four nuclear power plants with eleven  reactors between them in the region operating at the time and all shut down automatically when the quake hit. The reactors held up to the seismic activity of the earthquake, but were vulnerable to the tsunami. Power, from grid or backup generators, was available to run the Residual Heat Removal (RHR) system cooling pumps at eight of the eleven units, and despite some problems they achieved ‘cold shutdown’ within about four days. The other three, at Fukushima Daiichi, lost power at 3.42 pm, almost an hour after the quake, when the entire site was flooded by the 15-metre tsunami. This disabled 12 of 13 back-up generators on site and also the heat exchangers for dumping reactor waste heat and decay heat to the sea. The three units lost the ability to maintain proper reactor cooling and water circulation functions. It took weeks to stabilize the reactors.

FukushimaMeltdown101113

Evacuation and Radiation: The government issued an evacuation instruction for residents within 3km radius in the beginning. Eventually it was expanded to within 20km, and the residents of a range of 20km -30km were instructed to stay indoors. There have been no deaths or cases of radiation sickness from the nuclear accident, but over 100,000 people were evacuated from their homes to ensure this. Government nervousness delays the return of many. As of July 2012, all nuclear energy efforts are suspended. The image below is a map depicting ground radioactive iodine levels based on US aircraft monitoring data.

p1 radio active iodine 20130628

Japan’s New Energy Strategy: Japan has limited domestic energy resources that have met less than 9% of the country’s total primary energy use since 2012, compared with about 20% before the removal of nuclear power following the Fukushima plant accident.t is the third largest oil consumer and net importer in the world behind the United States and China. Furthermore, it ranks as the world’s largest importer of liquefied natural gas and second-largest importer of coal behind China. The image below is a graphic representation of Japan’s energy consumption.

energy_consumption


References:

1. Fukushima on the Globe

http://fukushimaontheglobe.com/the-earthquake-and-the-nuclear-accident/whats-happened

2. World Nuclear Association

http://www.world-nuclear.org/info/safety-and-security/safety-of-plants/fukushima-accident/

3. EIA

http://www.eia.gov/beta/international/analysis.cfm?iso=JPN

President’s Climate Action Plan

The President’s Climate Action Plan was published in June 2013. In his Second Inaugural Address, given January 2013, President Obama stated, “The path towards sustainable energy sources will be long and sometimes difficult. But America cannot resist this transition, we must lead it.” The Climate Action Plan is part of how President Obama will achieve the pledge he made in 2009 that by 2020, America would reduce its greenhouse gas emissions in the range of 17 percent below 2005 levels. His plan can be divided into three pillars-

1. Cut Carbon Pollution in America

2. Prepare the United States for the Impacts of Climate Change

3. Lead International Efforts to Combat Global Climate Change and Prepare for its Impacts

This blog will discuss one initiative from each of the three pillars.

In regards to the first pillar (Cut Carbon Pollution in America), the plan includes deploying clean energy by cutting carbon pollution from power plants as power plants, “are the largest concentrated source of emissions in the United States, together accounting for roughly one-third of all domestic greenhouse gas emissions.” As of the plan being written, there were no federal standards in place to reduce carbon pollution from power plants, although some changes were being made at the state level. Carbon pollution standards for both new and existing power plants are being created by the Environmental Protection Agency.

6a00d83451b96069e201a73dd05450970d-800wi

In regards to the second pillar (Prepare the United States for the Impacts of Climate Change), the plan includes protecting our economy and natural resources in many ways including promoting resilience in the health sector, conserving land and water resources, and identifying vulnerabilities of key sectors to climate change. Promoting resilience in the health sector means providing guidance on affordable measures to ensure that our medical system is resilient to climate impacts, collaboration with partner agencies to share best practices among federal health facilities, and training public-health professionals and community leaders to prepare their communities for the health consequences of climate change.

6a00d83451b96069e201a73dd054c5970d-800wi

In regards to the third pillar (Lead International Efforts to Combat Global Climate Change and Prepare for its Impacts), the plan mainly attempts to work with other countries to take action to address climate change. This is accomplished in numerous ways including expanding clean energy use and cutting energy waste by:

-Financing and regulatory support for renewable and clean energy projects

-Actions to promote fuel switching from oil and coal to natural gas or renewables

-Support for the safe and secure use of nuclear power

-Cooperation on clean coal technologies

-Programs to improve and disseminate energy efficient technologies


References:

1. The President’s Climate Action Plan

https://www.whitehouse.gov/sites/default/files/image/president27sclimateactionplan.pdf

2.The White House

https://www.whitehouse.gov/climate-change

3. Environment and Energy Study Institute

http://www.eesi.org/papers/view/fact-sheet-timeline-progress-of-president-obama-climate-action-plan

Iceland’s Use of Geothermal Energy

Blog about Iceland’s use of geothermal energy for generating heat and electricity.

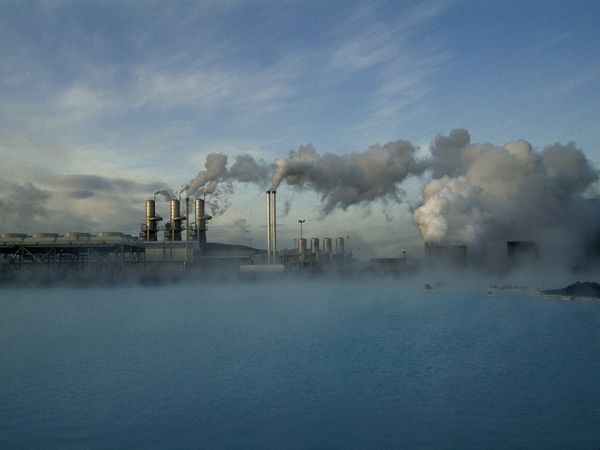
Iceland is largely made of porous basalt at the crack in Earth’s crust where the North American and Eurasian plates are pulling apart. There are enormous underground reservoirs of water that are continually renewed by levels of annual precipitation that range as high as 177 inches over Iceland’s glaciers, and shallow patches of magma that heat the deepest reaches of these reservoirs to temperatures in excess of 750 degrees Fahrenheit. The image below details Iceland’s use of their geothermal energy resources. The largest portion goes to space heating and the second largest percentage goes to electricity generation.

7-utilisation

Generating Heat: There is no national grid in Iceland – harnessing the energy comes via the remarkably simple method of sticking a drill in the ground near one of the country’s 600 hot spring areas, and using the steam that is released to turn the turbines and pump up water that is then piped to nearby settlements. Geothermal water is used to heat around 90% of Iceland’s homes, and keeps pavements and car parks snow-free in the winter. Hot water from the springs is cooled and pumped from boreholes that vary between 200 and 2,000m straight into the taps of nearby homes, negating the need for hot water heating. It’s also purified and cooled to provide cold drinking water.

Geothermal Electricity: Geothermal power facilities currently generate 25% of the country’s total electricity production. There are three basic designs for geothermal power plants, all of which pull hot water and steam from the ground, use it, and then return it as warm water to prolong the life of the heat source. In the simplest design, known as dry steam, the steam goes directly through the turbine, then into a condenser where the steam is condensed into water. In a second approach, very hot water is depressurized or “flashed” into steam which can then be used to drive the turbine. In the third approach, called a binary cycle system, the hot water is passed through a heat exchanger, where it heats a second liquid—such as isobutane—in a closed loop. Isobutane boils at a lower temperature than water, so it is more easily converted into steam to run the turbine. These three systems are shown in the diagrams below.

energy-renewable-geothermal-plant-designs-diagrams

Resources:

1. Orkustofnun

http://www.nea.is/geothermal/direct-utilization/nr/91

2. Scientific American

http://www.scientificamerican.com/article/iceland-geothermal-power/

3. The Guardian

http://www.theguardian.com/environment/2008/apr/22/renewableenergy.alternativeenergy