
In our science class we were asked to follow the procedures of an experiment, which involves shaking a generator. Our aim was to determine the output of the voltage of the generator within certain number of shakes.
We were divided into groups and our goal was to correlate the number of shakes of the generator, (or more precisely the sum of the square of the voltages) which the generator generates. However, we were asked to do more than one trial. For each trial we had different number of shakes. For the first trial it was 10 shakes, second trial 30 shakes, third trial 50 shakes, fourth trial, 60 shakes and finally fifth trial was 70 shakes.
Below I am going to demonstrate the procedures that we followed to accomplish our experiment.
- Shake the generator at a particular rate.
- Count the number of shakes in the data collecting intervals.
- Calculate in excel the sum of the squares of the voltages (SSV’S) the voltages are logged after each second.
- Repeat procedure five times with different number of shakes.
- Plot the SSQV as a function of the number of shakes and fit the result to a linear curve.
|
Number of Shakes |
Sum of the Square of the voltages |
|
10 |
0.383325 |
|
30 |
0.825472 |
|
50 |
53.80327 |
|
60 |
72.50162 |
|
70 |
58.29262 |
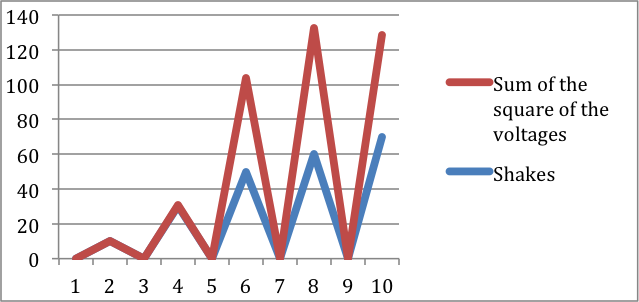 In conclusion, looking at the results above, we can see that as you increase the number of shakes, the sum of the square voltage increases.