This experiment was quite easy. Learning about how solar power worked by shining a light source, solar panel, and our excel file was pretty fun to do. At first, though, we had gotten some in correct readings when we were first testing it with no light:
| No light |
| -0.09167 |
| -0.07884 |
| -0.06601 |
| -0.07884 |
| -0.09167 |
| -0.09167 |
| -0.02752 |
| -0.01469 |
| -0.01469 |
| -0.02752 |
We tried to take the readings once again, and it seemed to be well enough. Once measuring the solar power with no light, we tried again holding the light different distances from the panel, from 2 cm, 10 cm, 18 cm, and 26 cm. After using different lengths, colors were placed over the solar panel to see how the solar panel reads when there is a shade of color over it.
No light
| -0.06601 |
| -0.07884 |
| -0.09167 |
| -0.09167 |
| 0.01097 |
| -0.07884 |
| -0.04035 |
| 0.01097 |
| -0.06601 |
| -0.07884 |
| 2 cm | 10 cm | 18 cm | 26 cm | Purple | Green | Yellow | ||||||
| 0.33172 | 0.25474 | 0.08795 | 0.10078 | 0.07512 | 0.21625 | 0.2804 | ||||||
| 0.42153 | 0.24191 | 0.12644 | 0.11361 | 0.01097 | 0.13927 | 0.2804 | ||||||
| 0.31889 | 0.21625 | 0.1521 | 0.07512 | 0.08795 | 0.13927 | 0.37021 | ||||||
| 0.33172 | 0.20342 | 0.16493 | 0.06229 | -0.00186 | 0.1521 | 0.2804 | ||||||
| 0.38304 | 0.20342 | 0.17776 | 0.1521 | 0.0238 | 0.25474 | 0.33172 | ||||||
| 0.39587 | 0.24191 | 0.08795 | 0.10078 | 0.11361 | 0.21625 | 0.2804 | ||||||
| 0.42153 | 0.21625 | 0.08795 | 0.12644 | 0.03663 | 0.1521 | 0.29323 | ||||||
| 0.31889 | 0.25474 | 0.08795 | 0.12644 | 0.03663 | 0.1521 | 0.38304 | ||||||
| 0.31889 | 0.16493 | 0.17776 | 0.03663 | 0.11361 | 0.21625 | 0.29323 | ||||||
| 0.46002 | 0.20342 | 0.13927 | 0.11361 | 0.04946 | 0.20342 | 0.37021 |
After all of these numbers were taken, for each column, the average number was taken.
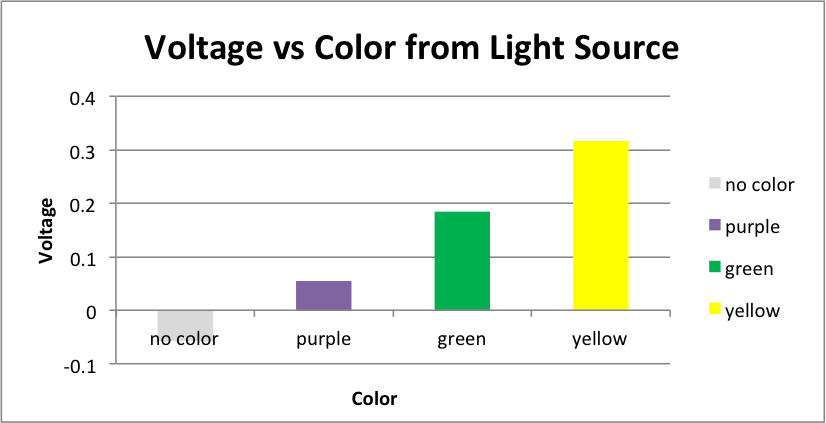
No light – Average -0.0576705
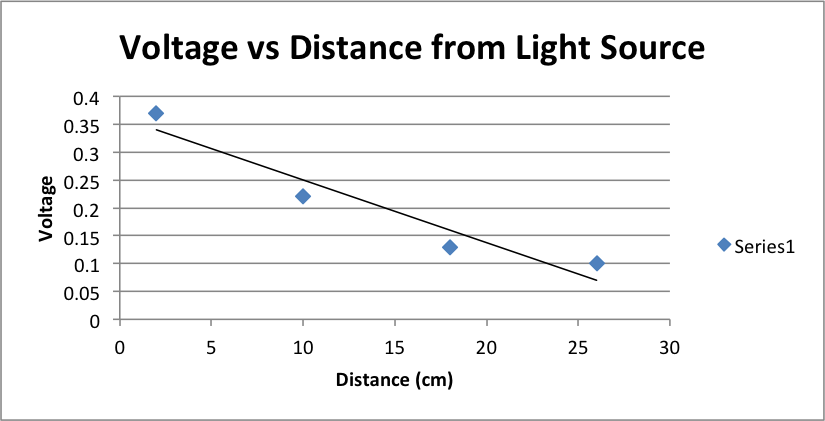
2 cm – Average 0.37021
10 cm – Average 0.220099
18 cm – Average 0.129006
26 cm – Average 0.10078
Purple – Average 0.054592
Green – Average 0.184175
Yellow – Average 0.316324
Using the averages from each of the measurements, graphs were made to show the relationships between voltage and color, and voltage and distance.
This was the end of the experiment. I feel that solar power is a very effective way of power, and it is a good idea to use. Going around the city, I have seen many things that run on solar power, and they seem to work very well.


You explained the lab well and used a lot of information to back up what you did. I like how you put the data and charts into the blog because it helps the reader better understand the information you are talking about!
You clearly explained the process of the solar experiment. I like the neatness of hoe you set up the blog. Nice job and your website looks dope.