The Keystone XL Pipeline

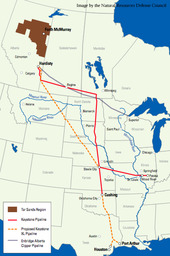
The Keystone XL Pipeline is an oil pipeline that Canadian company, TransCanada, is looking to try to build that will travel down through the United States. This pipeline, if built, will be starting in Alberta, Canada and travel all the way through the Gulf Coast of Texas. This pipeline would be 2,000 miles long. Of course, this is something that TransCanada will be trying to promote, but there does seem to be many down sides to having this pipeline run through the United States.

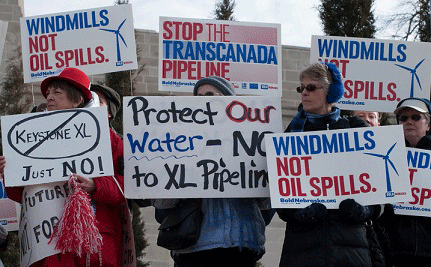
Some people think that the idea of “building the Keystone XL [brining] 830,000 barrels a day of Canadian crude oil to the Gulf Coast where it will be made into gasoline, diesel or aviation  fuel to be sold in the United Staes” is a great idea (BuildKXL). This may seem like a good idea for us as consumers, but what are all the downsides of this if it were to happen?  From the many possibilities, there could be water pollution, forest destruction, and pipeline spills.

Beginning with forest destruction, if this pipeline were to be built, large amounts of forest will have to be destroyed. Yes, this pipeline would be going in to serve a purpose, but the forest is something that serves a much greater purpose. In this quote, Friends of the Earth explain the importance the forests have to us and what would happen if they were destroyed, “The forests not only serve as an important carbon sink, but its biodiversity and unspoiled bodies of water support large populations of many different species. They are a buffer against climate change as well as food and water shortages. However, in the process of digging up tar sands oil, the forests are destroyed” (Friends of the Earth).

Pipeline spills and water pollution can happen together within the same time. If there were to be a pipeline spill, it could pollute the air, water, or even in the ground and kill anything that lives within the ground. Friends of the Earth  again explain how pipeline spills would affect the US when they say, “The probability of spills from this pipeline is high and more threatening than conventional spills, because tar sands oil sinks rather than floats, making clean ups more difficult and costly” (Friends of the Earth). Here they also mention cost. With any pipeline, this is a possibility, but this pipeline travels through many different rivers, states, various land, and many more places. The expense that would have to be paid if it were to spill is an extreme amount of money.

There are other ways we have been getting oil and I do not feel that the Keystone XL Pipeline is something necessary that needs to be built.

 Keystone XL Pipeline Protest

keystonemap

Sources:

http://buildkxlnow.org/

http://www.thegreenmarketoracle.com/2011_09_01_archive.html

http://www.foe.org/projects/climate-and-energy/tar-sands/keystone-xl-pipeline

Brainstorming of Experiment

Within the past week, our group has come up with some good ideas for what we are going to do for our experiment. We are doing an experiment on compressed air energy storage. We have come to the conclusion that our goal for this experiment is to have the high school students learn how to conduct this experiment, in a way that is not too difficult for them to try. We have come up with a slide show just to show how our experiment is going to work. That photo is shown below:

bloggg-300x219


Above is what we are expecting our experiment to look like. Our objective for the students in this experiment is to find an alternate and cheaper way to store energy in other ways than a battery. This will teach the students sustainability, as well as how to be creative to come up with new ideas for energy storage. For this experiment, we have found all of the materials we need, including a high-pressure air tank, pipe, acting cylinder, piston, gears, generator, wires, and a small light bulb. Once all of these materials are together, we are having the students connect one end of pipe to high-pressure air tank, and the other to the acting cylinder. The acting cylinder will push its piston into the gears. The gears will move and turn on the generator. Wires connected to the generator will then turn on the small light bulb.

We will be conducting this experiment ourselves once our materials are shipped. Each group member has some sort of task so that nobody is left with nothing to do. Together, as we each complete our tasks, our experiment will come out a success! I feel that our group is excited to try this out, and have the high school students try it out as well.

Generator Lab

This experiment was done to measure the voltage output of a generator using NXT and lab view on the computer. Every 30 second, we were to shake the generator while counting how many times it shook, and the computer calculated the voltages this put out. This lab was done to as well help us as students to understand Faraday’s Law. This law states that Changing magnetic fluxes through wires that are coiled is a way to generate electricity.

We began by taking the generator, counting for how many times we could shake it for 30 seconds, three times in a row. All of the data was put into an excel file, and we as a group made graphs to go with the data.

Our group personally did four different shakes, not just three. Counting the number of shakes as we were shaking it was probably the most difficult part of this. This started with zero shakes, then 77, to 71, and lastly, 150. The numbers we got after getting our sum for the voltages were rather large, but higher number of shakes meant the voltage number was larger.

bg-300x200          blogg-300x235


MIT Nuclear Reactor

The nuclear reactor at MIT was something that was very interesting to see. It was built in 1958, but upgraded again in 1975. A lot of the speaking was slightly confusing to follow, but I did learn a lot. The reactor itself is only about two feet tall, which is something I did not expect. I would have thought it would have been bigger! This reactor has a two loop cooling system. We learned that without a cooling system, the water could heat up because no heat would be being remove, and the water inside could start to boil which would not be good.

The water used is D2O, heavier for neutron reflection, and graphite is the outer reflection. Enriched U235 VALx metallic fusion is within the reactor as well. The primary loop of the reactor circulates at 2000 gpm while the second loop circulates at 1800 gpm. There are safety channels in the reactor as well, three on the power level and three on the reactor period. While the professor was explaining all of these part of the reactor, he was speaking about the Uranium, and anything higher than that on the periodic table of elements is man made.

One thing he talked a lot about as well was fission and how it works within the reactor. This is when there is splitting throughout the nucleus of atoms. If one neutron falls into the U235, fission is caused, and causes three more neutrons. They continue to multiply while this is happening. The nuclear reactor needs a constant chain reaction, so two of those neutrons must be removed.

440px-Nuclear_fission.svg

When going on the actual tour, it was not what was really expected. Each of us was to wear something that could detect radioactivity, and once we had gone into the reactor it felt weird. It almost looked like a large storage room because there was so much stuff, and so many different buttons and control panels all over the place. We did have a chance to get to try and look into a window of the reactor, but I did not see anything. We got to go into the control room as well. It seems like working in there would be so much responsibility, needing to always be paying attention to what is going on. If anything were to happen, you would have to know what to do. Overall, it was a cool and interesting field trip and I did enjoy it.

control                                                  nuc

Solar Energy Experiment

This experiment was quite easy. Learning about how solar power worked by shining a light source, solar panel, and our excel file was pretty fun to do. At first, though, we had gotten some in correct readings when we were first testing it with no light:

No light
-0.09167
-0.07884
-0.06601
-0.07884
-0.09167
-0.09167
-0.02752
-0.01469
-0.01469
-0.02752

We tried to take the readings once again, and it seemed to be well enough. Once measuring the solar power with no light, we tried again holding the light different distances from the panel, from 2 cm, 10 cm, 18 cm, and 26 cm. After using different lengths, colors were placed over the solar panel to see how the solar panel reads when there is a shade of color over it.

No light

-0.06601
-0.07884
-0.09167
-0.09167
0.01097
-0.07884
-0.04035
0.01097
-0.06601
-0.07884

2 cm 10 cm 18 cm 26 cm Purple Green Yellow
0.33172 0.25474 0.08795 0.10078 0.07512 0.21625 0.2804
0.42153 0.24191 0.12644 0.11361 0.01097 0.13927 0.2804
0.31889 0.21625 0.1521 0.07512 0.08795 0.13927 0.37021
0.33172 0.20342 0.16493 0.06229 -0.00186 0.1521 0.2804
0.38304 0.20342 0.17776 0.1521 0.0238 0.25474 0.33172
0.39587 0.24191 0.08795 0.10078 0.11361 0.21625 0.2804
0.42153 0.21625 0.08795 0.12644 0.03663 0.1521 0.29323
0.31889 0.25474 0.08795 0.12644 0.03663 0.1521 0.38304
0.31889 0.16493 0.17776 0.03663 0.11361 0.21625 0.29323
0.46002 0.20342 0.13927 0.11361 0.04946 0.20342 0.37021

After all of these numbers were taken, for each column, the average number was taken.

No light – Average  -0.0576705

2 cm – Average 0.37021

10 cm – Average 0.220099

18 cm – Average 0.129006

26 cm – Average 0.10078

Purple – Average 0.054592

Green – Average 0.184175

Yellow – Average 0.316324

Using the averages from each of the measurements, graphs were made to show the relationships between voltage and color, and voltage and distance.

voltage dist  color and volt


This was the end of the experiment. I feel that solar power is a very effective way of power, and it is a good idea to use. Going around the city, I have seen many things that run on solar power, and they seem to work very well.

Tom Vales Talk

Tom Vales talk was very quick, only about fifteen minutes, but within that fifteen minutes he did talk a lot. He began talking about Thomas Edison and Tesla. What was first talked about was alternating current versus direct current. At some points of this talk it was a bit difficult to follow along because he was talking quite fast, but he did explain these.

He first explained that alternating current can go up and down, and transformers are used to feed this current into houses. Direct current goes directly to the source of power. He did try to explain that there was something that had to do with these types of currents and Edison verses Tesla. Edison was promoting direct current, and Tesla was for alternating current. Edison’s idea was costly, where Tesla’s idea had a lower cost. He said they had done tests with these currents on animals, although I am not positive how.

One thing that was quite interesting that he had brought along with him was a Tesla coil. This coil could only reach to about a seven inch spark, but he said that he has seen some that can reach up to 50 feet! He first showed us what the spark looked like when he lit it alone:

IMG_3553

Next, he would hold two fluorescent lights next to it, not even incredibly close, and this spark was causing them to light:

IMG_3554

He did the same thing with a light that had multiple colors on it. It would not light up past where he was holding it, because his had would stop the current of the electricity running through the light:

IMG_3556                                           IMG_3557

Fourthly, he took another rod that had a lightbulb in the middle of it. When he touched this rod to the spark, the light bulb in the middle of the rod lit:

IMG_3559

Lastly, he was showing that as he brings the rod closer to the spark, it tried to reach out to the rod as it comes closer. In the photo below, the current has reached out to start to touch the rod:

IMG_3565

It was difficult to see in most photos, but once he was done demonstrating how the spark current can light these bulbs and rods, he made the spark spin, and it formed a circle. It almost looked like a small ring of fire. He completed his talk by saying that Tesla had out shown Edison within their current competition, and that without him there would not be alternating current. I thought that this talk was quite interesting, but it was a lot faster than I had thought it was going to be.


Pandora’s Promise

I felt that this documentary was full of information and helped to understand many things about nuclear power. The movie started pulling you in with the cold vibe it gave against nuclear power. Many opinions were shared about how we should not support this as a country, because there are many dangers within power plants. Some of the issues I have heard of before because there are some basic opinions on nuclear power that everyone seems to know, but there was far more information that I can completely remember.

Radiation is the biggest fear that I hear a lot about in this documentary. Subatomic particles within radiation travel fast and can penetrate the human body, and is very likely to cause damage. If  one of these power plants were to explode, such as Chernobyl in the Ukraine, the radiation can travel and spread extremely far causing lots and lots of destruction to cities, humans, animals, and anything that is in its path.

aaaa

The photo above is Chernobyl after the radiation destruction. There was barely anything left, and this is one reason why people do not agree with nuclear power. The radiation can be cancerous to humans, and there could be many other dangers if a plant were to explode.

Another thing I noticed in this, is that there was also a lot of focus towards solar and wind power. There were scenes that showed fields filled with solar panels, or mountains with wind turbines. Although these ideas harmful it was brought up that it may not always be sunny or windy, in which that would not be in the favor of these sources of energy. Many people do not like the way these look either, especially when there are wind turbines up on mountains. I can agree seeing these would ruin a view, but there aren’t many places that one would be able to hide something this large.

I did feel that this film did help in trying to understand the effects of nuclear power on global warming, but at times it was hard to follow just because there was so much information to try and process. It was a great way to be able to tell people about the dangers of nuclear power because if people were to not watch this, they may not know much about the topic and this was a good way to help.


Pulley Robotics Activity

In this activity, we used a robot to operate a pulley with small weights on it. Each of the weights weighed 20 grams. At first, our robot was not working correctly, so we had some incorrect data at first. This was making our graphs turn out inaccurately and we had to restart to fix our data.

First round of data:

Speed (RPM) Battery Discharge (mV) Mass (kg) Power Level(force) Time (secs) Acceleration (RPM/S) height (m) g(m/s^2 mgh power
70.14904 0 83 0 0.22 0 75 0 2.326 0 30.158659 0.2 9.8 0.4312 0.185382631
39.783803 0 56 0 0.14 0 75 0 3.762 0 10.575174 0.2 9.8 0.2744 0.072939926
70.372399 0 208 0 0.18 0 75 0 1.826 0 38.539101 0.2 9.8 0.3528 0.1932092
41.587302 0 56 0 0.18 0 50 0 3.15 0 13.202318 0.2 9.8 0.3528 0.112
54.378887 0 70 0 0.18 0 62 0 1.983 0 27.422535 0.2 9.8 0.3528 0.177912254
68.133136 0 69 0 0.18 0 70 0 2.023 0 33.679256 0.2 9.8 0.3528 0.174394464

Above is the data that we had to change. All the numbers were going up and down when they should have been either increasing or decreasing, not doing both. When we realized this error, we started again and came up with new data.

Second round of data:

24.332344 0 125 0 0.18 0 40 0 5.055 0 4.81352 0.2 9.8 0.3528 0.069792285
42.253521 0 28 0 0.18 0 40 0 3.337 0 12.662128 0.2 9.8 0.3528 0.105723704
39.649024 0 70 0 0.22 0 40 0 3.552 0 11.16245 0.2 9.8 0.4312 0.121396396
38.39926 0 56 0 0.26 0 40 0 4.323 0 8.882549 0.2 9.8 0.5096 0.117881101
64.925483 0 56 0 0.26 0 60 0 2.259 0 28.740807 0.2 9.8 0.5096 0.225586543
91.717791 0 83 0 0.26 0 80 0 1.63 0 56.268584 0.2 9.8 0.5096 0.312638037

Once we had this data straight, we were able to make our graphs:

AvsM

BDvsE

PvsPL

AvsPl

Each of the graphs goes over different parts of what the robot did with the pulley. The first graph is Acceleration vs Mass. As the mass goes up, the acceleration goes down. Next is the Battery Discharge vs Energy. The battery discharge increases when more energy is being used. For Power vs Power Level, as the power level goes up, the power increases as well. Last was the Acceleration vs Power Level. As the acceleration increases, so does the power level. This turned out well once we were able to use a robot that worked, and take off 20 gram weights increasingly.


Demand Response

The electricity sector is our most used greenhouse gas emission, and of course people want to help to lower it. Demand Response is something that can now give consumers this opportunity. By reducing their electricity usage, consumers can get financial incentives. Using less energy, of course, saves everyone money if people actually consider how much electricity they are using and try to cut back. Demand Response programs have recently become a very valuable resource.

“Advanced metering infrastructure expands the range of time-based rate programs that can be offered to consumers and smart customer systems such as in-home displays or home-area-networks can make it easier for consumers to change their behavior and reduce peak period consumption from information on their power consumption and costs” (Energy.gov). If the consumers can see and get an idea of how much electricity they are using it will help them to change their behavior and how much they use their electricity.

demand

The chart above explains the system that Mitsubishi Electric had come out with to demonstrate their Demand Response resource. One member of the company states, “The system automatically evaluates fluctuating power-generation costs and electricity-market prices to determine optimized incentives for saving power, thereby helping to stabilize supply and demand management while minimizing costs and benefits for utilities and customers alike” (Mitsubishi).

Demand Response is helping to work toward a new goal, and clearly seems to be helping. New technologies, tools and techniques will eventually be created to continue on helping with this, as well as many further goals in wanting to help the power industry design grow further.

Sources:

http://www.pjm.com/markets-and-operations/demand-response.aspx

http://energy.gov/oe/technology-development/smart-grid/demand-response

http://www.mitsubishielectric.com/news/2013/0214-b.html

Sawyer Library Tour

The Sawyer Library, located in 73 Tremont, is the main library for us here at Suffolk University. It is one of the facilities here open 8am-12am Sunday through Thursday, and then 8am-8pm on Fridays and Saturdays. This is great and convenient hours for everyone here. The library carries over 200,00 books, and even has books on reserve so if you need one for a class, you can use it while in the library. For books you can check out, they are able to be checked out for 28 days, almost a month! If a book needs to be found you can ask the friendly librarians to help you because they are all happy to help.

library

If you aren’t only looking for books and prefer to do your reading from your computer, there is an online data base you can access from the library’s website. You can specifically search anything you would like to get the most accurate information you would need. If you need to print something, the library has printers where you can print whatever you need for only 5 cents a page! They have copy machines and scanners that you can use as well. If a student needs to use a computer if they do not own one, they can go into the library and check out a lap top or use one of the desk top computers that they have there.

There are some features of the library some people may not have known about, either. On the ninth floor are the library commons. This is one large area with many chairs and couches people can go hang out at to do work. There are big tables for big groups to do group work, and you can get a nice view of the city if you look out the window. On the third floor of the library there are as well some study rooms that you can get a group and go in to do some work.