Radiation and Absorption in Colors

Today’s class we are working with other group, each of us have to do two experiments that other group created.

I did my two experiments on Fuel Cell and Radiation in colors. So I am going to write about what I did on one of the experiments – Radiation in colors.

Sometimes during summer I wonder why my hair (black color) is always warmer than those people who have blond hair?

This experiment shows how colors will effect on the temperature.


Introduction

Different surfaces with colors will give us different affect on the temperature change. In a green house people use the color glass to absorb the temperature from the Sun and the purposed of the color glass is to maintain the temperature inside the green house with out escaping temperature. This lab we are going to see how much the temperature will change under different cover with different colors.

Materials

4 Thermometers with clear cases

a lamp

4 different color of markers

a timer

Procedure

1. Before we start we need to “reset” all the thermometers into room temperature. Doing so we quickly swing each thermometer back and forth, beware of surroundings.

We found out that the room temperature was around 27 C. This is our initial temperature.

image (1)     one of the instructor is resetting the thermometer.

2. We can now choose what colors that we want to put on the cases so we will have nice color covers for the thermometer.

We choose Red, Green, Blue, and Black.

3. After we colored each case with different marker we place it under the lamp which is our heat source. We place it under the lamp for about 30 minutes and each 5 minute I recorded the temperature.

image (2) when 4 thermometer is under the heat source

4. Record all the data and compare the result with different color covers.

Result

min 5 10 15 20 25 30
Green 28 30.8 32 34.6 36.8 38
Blue 29 31 33.5 35 37.9 39.5
Red 28.5 30 31.5 33 34.8 36.7
Black 30 34 38 40 41 42

As you can see the color black absorb the whole spectrum from the white light but it does not reflect any energy. This means it gets hotter faster and it gets the highest temperature than any other thermometers, this also means that it gets colder faster when there is now heat source. The color black has the extreme change on the temperature it can absorb most heat in short time also can release most of the heat in a short period of time. The result also shows the Green color also efficient to be in a house because it can absorb and reflect  radiation so it keeps the thermal radiation inside the area longer and warms up the area faster. But the color green will not be like the color black, color green actually can keep the heat inside the area. So it keeps warm longer than other colors.

Conclusion

This lab is fun we get to do other groups’ experiment and interact with other classmate. I learned a lot at different group experiment such as the fruits battery and fuel cell which might be the future of our energy source. The radiation and absorption in colors actually proof that colors effect the heating process, and the thermal energy can be used to warm the house faster and longer.


Pandora’s Promises

135312795


The movie Pandora’s Promises was a mind blowing film to me. This film pointed out that our deepest fear is the radioactive that will causes cancers even death. In the 1980, nuclear power was never a popular idea people were still questioning about the entire idea. And  after Chernobyl and Three Mile Island disasters, it was most certainly sure that people are terrifying and lost its appetite for the stuff.

la-et-ct-cnn-continues-acquisition-spree-with--001

Pandoras Promise After 30 years the radiation still at high level.

still_361Tokyo, Japan after the Fukushima disaster the level is rising. But the wind brought the radiation to the other side of the planet.

xelglAfter the disaster the radiation pass thought the pacific ocean.


Although our fear to the nuclear power plant is about the radiation but there are some facts that we need to know. In the stats it shows that no one has actually died in the United States as a consequence of a nuclear power accident, while coal kills more than 14,000 people a year most of them die from pollution. Nuclear is scary, but it kills fewer people per watt of power than coal, oil, and even solar. Chernobyl, took 30 years ago, the worst nuclear accident in history, though it killed many people at the time, it has had surprisingly limited long-term effects, according to scientists. Chernobyl as Hell on earth, most people would agree when they know about the disaster. But within these few years animals and people are actually living there again there are animal activities on the place but the radiation ,as we can see from the above picture, is still at the background. The film is focus on a new breed of scientists and environmental activists, they now  believes that there are no other options. Now a day people are deciding between the green energy or reliable and efficient but dangerous source.

The main point of Pandora’s Promise is that recently people starts to noticed how huge the gap between fossil fuels and renewables energy is. Electricity is the one thing that we can not live without, and it increase the quality of our lives. With the growing development of the technology the need for energy is only to rise; energy consumption of the planet is expected to double by 2050.

Watching this film is uncomfortable, also shocking. Because I had ideas about how bad and how terrible the nuclear energy is. But this file changes lots of ideas that I once believe in. It seems like the nuclear energy is not as bad as we think. Personally, I found out that it can consider as “Green” energy. And also the effect is not as bad as we think it is, during the Fukushima disaster people were killed. But most of them are from the Tsunami or injury. This makes me have changed my opinions about the nuclear energy.

Mendocino Motor

Unfortunately Tom was sick therefore we did not have a presentation from him. Get well soon Tom!

But I did saw his presentation in different class (technical communication). So today I am going to blog about one of devices that he presented – Mendocino Motor.

There are many types of engine that can benefit us in our daily lives. During Tom’s presentation he introduced us 3 different types of motor that can create energy.

1. Stirling engine

2. Mendocino Motor

3. Peltier device

5

Mendocino Motor interested me the most. The other two engines both require the changing temperature to generate energy. Mendocino motor is using the solar panel and also the levitation from magnets that generate movement on the motor.

What is a Mendocino Motor?

The Mendocino Motor is a magnetically levitated, solar powered electric motor.  It was first made by inventor Larry Spring of Mendocino County in California, for which it is named. The motor consists of a spinning shaft that is held up by repelling magnets, stabilized by resting a point against a wall.  It is powered by solar panels mounted on the spinning shaft, which generate currents through coils of insulated wire.


How it works

The motor base consists of five sets of magnets. Four magnets in the base are levitation magnets which provides levitation force against the shaft magnets. The fifth magnet, is a field magnet which provides the magnetic field for the rotor. The back plate has a piece of glass as a bearing plate.

The rotor consists of a shaft with a point on one end, magnets and rotor block. On the rotor block, there are four solar cells; one cell on each of the four sides and two sets of windings.

How it works. The rotor is levitated by the repelling force between the shaft magnets and the levitation magnets on the base. The levitation magnet also provides a forward thrust to keep the shaft point against the bearing plate.
When the light strikes one of the solar cells, it generates an electric current thus energizing one of the rotor windings. The Mendocino Motor floats in its own magnetic field and converts light into electricity and magnetism, which are then converted into the motion of the motor. It provides the satisfaction of creating an amazing bit of technology, and the opportunity to explore magnetism, electromagnetism, electric motors, solar power generation, and personal manufacturing. This produce an electromagnetic field which interacts with the field magnets in the base, causing the rotor to turn. As the rotor rotates, the next solar cell comes in position, This cell now energizes the second winding. The process repeats again.

stability.width


 This picture shows when the Motor is floating in the air.


When the solar panel getting the light it will change the magnetic field and start turning as the picture shown at the left.


In the graphic below, we change the rotating magnet into an electromagnet, represented by the classic example of wire wound around a nail.  In one region, from 45 to 135 degrees of rotation, we run current through the electromagnet in one direction.  To keep trying to rotate the spinning electromagnet in the same clockwise direction, we run current in the opposite direction in the 225 to 315 degree region.Because we run the current in opposite directions, the torque is always turning the shaft in one direction.  During the “off” periods, inertia of the spinning motor has to be enough to get it to the next “on” cycle for it to keep spinning.

rotationforces2


In brushed DC motors, conductive brushes are set up to make contact from an electrical source to the coil of wire.  With brushes setup to only make contact during those times in the rotation cycle that will help it rotate, the motor will spin powered by the electric current provided.


Math:

Solar panels like these have a performance curve that describes what they are capable of.  On this curve is an important point called the, “characteristic resistance.”  If you hook up the panel to a resistor with that value (or some load at that resistance), you’ll get the most power from it.  Therefore we choose a length of magnet wire that had a resistance equal to that spec.We take the electricity from the panel and run it through a coil of thin magnet wire, consisting of many turns around a loop.  When sitting in a magnetic field (near a magnet), a torque can be felt in that loop of wire.  How much torque?  The maximum torque, at the angle where maximum torque is found, can be expressed as T = N x I x B x A, where

  • N = the number of turns of wire
  • I = the current through the wire
  • B = the magnetic field within the loop of wire
  • A = the area of the loop

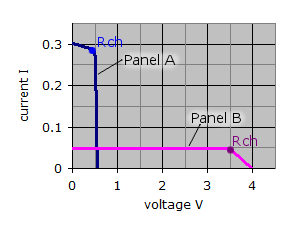
The picture shows resistance occurs right at the bend of each panel spec.  While both panels represented can offer a similar amount of power, one will offer higher currents at a lower voltage, while the second offers a much lower current but at a higher voltage.


“Mendocino Motor.” MAKE. N.p., n.d. Web. 31 Oct. 2013.<http://makezine.com/projects/make-31/mendocino-motor-2/>

“Information on the Mendocino Solar Motor.” Information on the Mendocino Solar Motor. N.p., n.d. Web. 31 Oct. 2013.<http://www.chessplayingrobot.com/id4.html>

“Sign up for Our Monthly Newsletter!” K&J Magnetics Blog. N.p., n.d. Web. 31 Oct. 2013.<http://www.kjmagnetics.com/blog.asp?p=mendocino-motor-1>

MIT field trip

MIT_Nuclear_Reactor_Laboratory_-_Tower_Tech_Cooling_Tower


Today we went to Massachusetts Institute of Technology Nuclear Reactor Laboratory to see a 6 MW nuclear reactor. When we first checked in we were given a meter that can detect the  surrounding uranium radiation level. By peeking through the hole we are were be able to see a ruler that showed us the radiation level sound us, and the changing scale will show how much radiation we are exposed in the environment. When I got mine it says about 23 curies.

IMG_06721

Then we were having a great Lecture by Tom, the head of department, and we had a better understanding about what we should look in the laboratory and what we should avoid in there.

In the lecture he introduce us the process of fission which is a process that a neutron collides with a nucleus and the product will keep reacting with other neutron and other nucleus. The process creates heat in order to heat up the water and change to steam to turn the turbine generator and produce electricity.

fissioncore_diagram

Unfortunately, due to safety issue we were not allow to bring our cell-phone inside the lab. So there is no inside footage.

The MIT nuclear lab still provide the reactor to their student to access and do experiment on it. But they shut down the medical lab which they were using the radiation beam to strike the tumor in patients’ head. The medical examination was hard the patient was not supposed to move while in the process. And also he/she could not fall asleep due to the medical issue, they need a functioning brain. They have to lay there for 12 hours without moving. Then we get into the control room,  which is the second following picture. The control room have overview about everything in the lab. And the personnel can react on any emergency or any unexpected situation at the right moment without more serious damage. As we can see and imaging the further the control the less important it is.

spent-fuel-pool-820 nrc


After we finished the tour we have to exam out of the lab to see if we are under radiation expose. Also when we are returning the radiation meter we still need to check the meter if the meter changes to tell if we were exposed. When I return my meter it says 23 curies which is the same as when I came in.

This tour I have learn a great deal.  And I found out that the reactor lab is not as dangerous as I thought would be. During the lecture Tom told us that even taking the flight from New York to LA has more radiation than in the lab, which I found out quite stunning. But it kind of make sense that with out the “air” and cloud we will be on the higher atmosphere which will give us more radiation from the sun. And in the lab because it is well-protect therefore the radiation should be less than the flight to LA. I have seen a lots on this trip and now I have a better understanding of nuclear plant and how it generate energy. It is quite interesting  that I changed my point of view on the entire nuclear system.

Fukushima Daiichi nuclear disaster and Japan’s new energy strategies


How do Nuclear Plants works?

Nuclear Plants are much like fossil-fueled power plants. The idea of fossil fueled power plant is to heat up the water until it boils and changes to steam, then the steam will turn the turbine generator to produce electricity. The difference between them is the source of heat. Inside of a nuclear power plants, the heat to make the steam is created when uranium atoms split, also known as the fission.

Fission:

fission

Fission is a process that the nuclear reactor to provide heat. It is a process that a neutron, in this case uranium neutron, collides with a target nucleus, in this case is uranium nucleus. After the first collide the products are more neutron and more nucleus then the neutron will keep repeating the collision with other nucleus. The process will create heat and we use the heat to boil water.

Types of Reactor:

There are two types of Nuclear reactor.

First is called pressurized water reactor, known as PWRs. It keeps water under pressure so that it heats, but does not boil. This heated water is circulated through tubes in steam generators, allowing the water in the steam generators to turn to steam, which then turns the turbine generator.

student-pwr


The water between the reactor and the steam are separated.


Second,  called Boiling Water Reactors also known as BWRs. In this type of reactor, the water heated by fission actually boils and turns into steam to turn the turbine generator.

student-bwr

In both PWRs and BWRs, the steam is turned back into water and can be used again in the process.


Fukushima Daiichi Nuclear Disaster

It was March 11, 2011, an earthquake led to major problems at the Fukushima Daiichi Nuclear Power Plant. A 14-m high tsunami triggered by the earthquake disabled all AC power to Units 1, 2, and 3 of the Power Plant, and carried off fuel tanks for emergency diesel generators. The cooling systems did not work and hydrogen explosions damaged the facilities, releasing a large amount of radioactive material into the environment. On April 12, 2011 the Japanese government officially announced that the severity of the Fukushima Daiichi nuclear disaster had reached level 7, the highest on the International Nuclear Event Scale. Before Fukushima, the only level 7 case was the 1986 Chernobyl disaster, whose 25th anniversary was marked on April 26.

14 Fukushima Daiichi Nuclear Disaster


The Fukushima nuclear disaster showed us once again that nuclear reactors are fundamentally dangerous. Not only do they cause significant damage to the environment, the health of populations and to national economies, the heavy financial cost of a meltdown is inevitably borne by the public, not by the companies that designed, built, and operated the plants. None of the world’s 436 nuclear reactors are immune to human errors, natural disasters, or any of the many other serious incidents that could cause a disaster. Millions of people who live near nuclear reactors are at risk.The lives of hundreds of thousands of people continue to be affected by the Fukushima nuclear disaster, especially the 160,000 who fled their homes because of radioactive contamination, and continue to live in limbo without fair, just, and timely compensation. They have only a false hope of returning home, yet the Japanese government is eagerly pushing to restart reactors, against the will of its people, and without learning true lessons from Fukushima.

Fukushima disaster caused Japan at a stroke the country to lose 20% of its nuclear electricity supply. Nuclear produced 300 TWh of power in 2010, and before the March tsunami, the plan was for this to increase by nearly 50% to 447 TWh by 2019. Japan had made aggressive commitments to reduce carbon emissions, and despite broad targets for renewable energy.

New strategy

After the disaster Japan now has couple targets they want to improve on.

1. Target world leadership in energy efficiency

Japan should now embark on a crash programme of energy efficiency, in industrial, commercial and residential applications. Creating large pools of demand for LEDs, building automation systems, smart grids and other efficiency technologies should be accompanied by programmes to support the supply side, so that Japanese companies can become export powerhouses to help fund the investment.

2. Pass a feed-in tariff

In Japan today, there is a need for speed. Restoring the country’s electricity supply is urgent. A feed-in tariff should be the policy-maker’s weapon of choice in giving momentum to a clean energy roll-out.

3. Restructure power markets

Despite much debate about liberalisation, Japan’s power markets are more rigid than in almost any other divided up into 10 regional near-monopolies. Given the extremity of the challenge, the priorities must be innovation, flexibilityand rewards for problem-solving, but the system is biased towards protecting the status quo. In particular, with Tepco, one of the world’s largest privately-owned utilities with 24m customers, bearing massive liability and needing full support from the national government, now would be a good time to advance a broader reform agenda on energy.

4.Start to rebuild trust in nuclear power

It will be hard to erase those images of Japanese toddlers being checked for radiation by masked inspectors. From an engineering standpoint, however, there is no reason why nuclear power cannot meet a significant and even growing part of Japan’s energy needs. The nuclear industry practically invented the science of risk management, and has at its disposal
techniques to understand and manage risk with clinical thoroughness.

5.  Fire up gas generation to bridge some of the gap

Inevitably, ramping up renewables and, especially, rebuilding trust in nuclear power will take years. In the short term, Japan needs quickly to increase its ability to import natural gas and increase gas-fired power capacity, beyond 2010’s figure of just over 60GW.


“How Do Nuclear Plants Work?” -Duke Energy. N.p., n.d. Web. 24 Oct. 2013.<http://www.duke-energy.com/about-energy/generating-electricity/nuclear-how.asp>


“NCBI. U.S. National Library of Medicine, n.d. Web. 24 Oct. 2013.” <http://www.ncbi.nlm.nih.gov/pmc/articles/PMC3246178/>

“Global Research.” Global Research. N.p., n.d. Web. 25 Oct. 2013. <http://www.globalresearch.ca/the-severity-of-the-fukushima-daiichi-nuclear-disaster-comparing-chernobyl-and-fukushima/24949>

Solar Energy and Clean Energy

Solar Energy project around the world:

Solar energy is the cleanest and most abundant renewable energy source available to us. It is no surprise that all around the world, architects and designers are incorporating solar technology into new buildings and projects to make them as green as possible.

1. Sanyo’s Solar Ark

Sanyo-Solar-Ark

Japan, Sanyo aimed to make the largest PV system in the world, a 3.4 MW installation. They use the materials was meant to be thrown away. But there are still some problem within this project. The company’s monocrystalline cell scandal that saw thousands of units recalled, and all of the reclaimed cells were destined for the dump. But Sanyo opted to built a massive monument to their solar technology.  However, they need no apologize, because the Ark can collect 630 kW that has 5000 solar panels and produces over 500000 kWh of energy per year. It produce the energy to power up 75000 colored LEDs that placed on the Ark and also it supply the energy for the inside museum.

2.China’s Solar Powered Office Complex

1274753932703

China are now the world leader in solar cells, it is no surprise to learn that they have the “largest solar-powered office building in the world.” It is located in Dezhou in the Shangdong Province, it is a multi-use building and boasts exhibition center, scientific research facilities, meeting rooms, and a hotel they are all solar powered. The structure enables to save 30% or more energy than national standard.

3.EnviroMission’s Solar Tower

enviromission-solar-tower-arizona-power-17 EnviroMissionTowerSizeComparison

This idea has been passing around since the 1980s. EnviroMission Ltd is aiming big with their proposed project. They are planing to build two massive 2400 ft solar updraft towers (almost tall as the Burj Khalifa) that span hundreds of acres in La Paz County, Arizona. Using Solar draft technology, the towers will generate hot air with a giant greenhouse and then channel the air into the chimney. The warm air then turns a turbine to produce energy. This project is still in the development phase, it will cost about $750 million.

4.The Sahara Forest Project

Conceptual-illustration-of-the-Sahara-Forest-Project-that-will-produce-fresh-water-electricity-and-food-in-the-desert

Designed by biomimicry architect Michael Pawlyn, Seawater Greenhouse designer Charlie Paton, and structural engineer Bill Watts, the Sahara Forest Project aims to enable restorative growth in the world’s most arid regions. The project will hopefully first get the go-ahead in the country. The team have even been invited to the country to discuss a feasibility study.Currently, the project is scheduled to go ahead in 2015, and if it is a success, it will have massive environmental benefits, such as  alleviating food and water shortage, producing biofuels, and contributing to forestation efforts in desert lands.

5. The Desertec Initiative

The Desertec Industrial Initiative is the largest solar project in the world it cost about US$550 billion. The plan aims to develop “a reliable, sustainable and climate-friendly energy supply” in North Africa’s Sahara desert that will be capable of providing the entire MENA region with energy as well as Europe.When the project was first announced in July 2009, it sounded a bit like science-fiction and was dismissed as being “unrealistic” and even exploitative. However, once it was noted that the project could provide 15 percent of Europe’s electricity by 2050, people began to sit up and listen.Currently Desertec’s first solar power plant is under construction. The $822 million Moroccan power plant will be a 150-megawatt, 7.4 square mile solar plant and is the first step in the major 500MW super project.

6.The Vatican

Solar power must be the future if the Catholic Church is getting on board with it. The Vatican has the largest solar power plant in Europe.Although it is the smallest country in the world, the Vatican has spent $660 million to build a massive 100MW photovoltaic installation. The output will be more than enough to provide enough power for the whole country.The main installation is located on a 740 acre site near Santa Maria di Galeria and has seen solar powers placed all over the city.


The wisdom of  clean energy subsidies in general:

Clean tech has enjoyed quite the party these past few years. Solar, wind, plug-in vehicles — they’ve all benefited from billions of dollars in subsidies from Congress, through various energy and stimulus bills. As a result, many industries, like solar, have taken lengthy strides.clean-energy subsidies are disappearing fast, as the stimulus winds down and various laws and tax credits expire. Back in 2009, clean tech got $44.3 billion in federal support. By 2014, that will have shrunk to just $11.1 billion.

The new report, co-authored by researchers from the Brookings Institution, the Breakthrough Institute, and the World Resources Institute, is the first to examine in detail which policies are actually expiring and when. All told, Congress has created more than 92 different programs dealing with clean tech — everything from production tax credits for wind power to advanced manufacturing credits to loan guarantees for nuclear power. And, by 2014, 70 percent of these programs will have vanished.The authors argue that letting all of these programs expire could cause the clean tech sector to “go bust,” as budding energy technologies like solar, wind, and even next-generation nuclear plants are currently facing pressure from ultra-cheap natural gas and from subsidized competitors in China.

Congress should rejigger its clean-energy subsidies in several ways. First, it should focus heavily on research and development. And second, the subsidies that are geared toward deploying new technologies — the credits and policies that help wind turbines sprout up and nuclear reactors get built — should be structured so that they reward improvements in performance. Solar power shouldn’t just get propped up no matter what. It should get money in such a way that manufacturers have incentives to keep putting out more efficient panels that get steadily cheaper. There are plenty of ideas for doing this. Nations like Germany and Denmark offer “feed-in tariffs” for wind and solar power that get smaller over time — which forces the technology to keep improving in order to stay profitable. Japan, meanwhile, has its Top Runner program that sets efficiency standards for appliances that are based on the best-performing leaders in the market. That is, the most efficient firms set the pace for the rest of the industry. A similar program could, in theory, be set up for clean energy sources.The ultimate goal of these policies, the authors note, is to push clean tech so that it can eventually stand on its own and compete with older, more established fossil fuels.The report, titled “Beyond Boom & Bust,” doesn’t, however, set a specific dollar amount for how much the U.S. government should be actually spend on renewable energy, electric vehicles, battery manufacturing, and other clean tech.


http://inhabitat.com/the-worlds-6-coolest-solar-powered-projects/solar-projects/” The World’s 6 Coolest Solar Powered Projects top 6 solar projects around the world”

http://www.washingtonpost.com/blogs/wonkblog/post/clean-energy-subsidies-are-vanishing-what-should-replace-them/2012/04/18/gIQApCUYQT_blog.html “Wonkblog, Clean -energy subsides are vanishing. What should replace them?” by Brad Plumer 4/18/2012

http://www.huffingtonpost.com/mark-muro/solyndra-solar-bankruptcy-solar-power-_b_947046.html ” The blog, Learn from Solyndra”

Solar Cells

Solar_cell

Introduction:

Solar is one of the primary sources. Sun has almost unlimited energy source to supply our solar system. As the green house effect increases we are now start using renewable energy, and solar energy is one of them. This lab we are going to implement a series of testing on a solar panel, using a flash light to represent the sun to generate voltage. A solar panel has two different silicons, n type and p type, and between them we have a semiconductor. A solar panel will absorb sun light and separate positive and negative electron to create the current flow in order to create energy. During this lab we are going to present several test. We are going to use the flash light to light the solar cell at different height to test how much power it will create. Then we will use colored film filters to cover the light source. Then test with different color filter.

solar_cell_diagram

Equipment:

One solar cell

One voltage probe

One NXT adapter with NXT light sensor

Flash light

Ruler

Colored film filters


Procedure:

1. We will have the file, solarlab1.vi,  from backboard. Before we start we will need to understand how the program works, and how to record the measurement.

2. Then we start measuring how much voltage we can get from the solar cell. First we faced the solar cell to the desk, to measure the 0 light voltage. Then we will start using flash light to light the solar cell. We are going to measure five different heights, there are 0, 4, 8, 12, 16 cm.

3.Each measurement we will have 10 seconds for the program to run then we will have 10 data points. Each height we are able to find the average by using Excel.

4. Finally, we will have 4 different colored filters to cover the light source then take measurement at about 12 cm. Record all the data.


Data:


no light Volt (v) with light 0cm (v) 4 cm (v) 8cm (v) 12cm (v) 16cm (v)
 0cm -0.01469 0.38304 0.34455 0.4087 0.46002 0.35738
-0.16865 0.51134 0.46002 0.39587 0.43436 0.48568
-0.02752 0.537 0.39587 0.33172 0.44719 0.30606
-0.11733 0.46002 0.39587 0.39587 0.43436 0.03663
-0.14299 0.51134 0.52417 0.34455 0.31889 0.0238
-0.15582 0.44719 0.34455 0.47285 0.44719 0.07512
-0.11733 0.4087 0.34455 0.33172 0.31889 0.35738
-0.14299 0.37021 0.4087 0.47285 0.31889 0.38304
-0.18148 0.37021 0.49851 0.44719 0.38304 0.30606
-0.16865 0.37021 0.4087 0.46002 0.4087 0.03663
Average -0.12375 0.436926 0.412549 0.406134 0.397153 0.236778

The above data shows that as the distance increase the voltage will decrease. And the graph below will have a better view of their inverse relationship.

Untitled.1


The following table shows the voltage that we  generate with different colored filters.

filter blue pink green peach
0.42153 0.35738 0.43436 0.34455
0.43436 0.43436 0.34455 0.51134
0.34455 0.42153 0.47285 0.37021
0.42153 0.37021 0.51134 0.35738
0.34455 0.44719 0.43436 0.52417
0.33172 0.42153 0.34455 0.37021
0.38304 0.34455 0.34455 0.38304
0.33172 0.35738 0.34455 0.49851
0.42153 0.46002 0.51134 0.47285
0.33172 0.38304 0.51134 0.33172
Average 0.376625 0.399719 0.425379 0.416398


This bar chart shows better view of voltage that we generate.

Untitled.2


Conclusion:

This lab helped us to have a clear view of the future of solar energy. A single solar cell can only generate so much and the procedure of making the solar panel is also damaging the environment. Therefore I do not think that solar penal will be the solution of our current situation. Solar energy is on of the big part of our primary sources, but I think we need to find a better way to use that energy. Also this lab help us to understand different light will give us different result, brighter light gives us better result than the darker one.

Hydro-Fracking

hydrofracking-impacts-water-quantity_175

What is Hydraulic Fracturing?

Hydraulic fracturing also know as Hydro-Fracking is a process, which takes place at natural gas well,  by using millions gallon of water, sand and chemicals to pumped into underground to break apart the rock to release the gas. Scientists are worried that the chemicals used in fracturing may pose a threat either underground or when waste fluids are handled and sometimes spilled on the surface.fracking_graphic_120418


How Fracking works

Vertical well bores are drilled thousands of feet into the earth, through sediment layers, the water table, and shale rock formations in order to reach the oil and gas. The drilling is then angled horizontally, where a cement casing is installed and will serve as a conduit for the massive volume of water, fracking fluid, chemicals and sand needed to fracture the rock and shale. In some cases, prior to the injection of fluids, small explosives are used to open up the bedrock. The fractures allow the gas and oil to be removed from the formerly impervious rock formations.

Although fracking has technically been in existence for decades, the scale and type of drilling now taking place, deep fracking, is a new form of drilling and was first used in the Barnett shale of Texas in 1999.

Risks and Concerns of Fracking

  • Contamination of groundwater
  • Methane pollution and its impact on climate change
  • Air pollution impacts
  • Exposure to toxic chemicals
  • Blowouts due to gas explosion
  • Waste disposal
  • Large volume water use in water-deficient regions
  • Fracking-induced earthquakes
  • Workplace safety
  • Infrastructure degradation

Impacts:

There are some impacts about the fracking.

Air Pollution

Oil Rig Near Glacier National Park

Methane is a main component of natural gas and is 25 times more potent in trapping heat in the atmosphere than carbon dioxide. A recent study by the National Oceanic and Atmospheric Administration (NOAA) monitoring gas wells in Weld County, Colorado,</a> estimated that 4 percent of the methane produced by these wells is escaping into the atmosphere. NOAA scientists found the Weld County gas wells to be equal to the carbon emissions of 1-3 million cars.


A number of other air contaminants are released through the various drilling procedures, including construction and operation of the well site, transport of the materials and equipment, and disposal of the waste. Some of the pollutants released by drilling include: benzene, toluene, xylene and ethyl benzene (BTEX), particulate matter and dust, ground level ozone, or smog, nitrogen oxides, carbon monoxide, formaldehyde and metals contained in diesel fuel combustion—with exposure to these pollutants known to cause short-term illness, cancer, organ damage, nervous system disorders and birth defects or even death .

The Associated press recently reported that Wyoming’s air quality near rural drilling sites is worse than Los Angeles’–with Wyoming ozone levels recorded at 124 parts per billion compared to the worst air day of the year for Los Angeles, at 114 parts per billion. The Environmental Protection Agency’s maximum healthy limit is 75 parts per billion.


Jonah,Wyoming oil fields. Photo credit: J. SARTORE/NATIONAL GEOGRAPHIC STOCK, from Feb.9, 2012 article in Nature.<br />


A 2007 report prepared for the Western Governor’s Association, that inventoried present and future nitrogen oxide and sulfur dioxide emissions from oil and gas drilling in the west, projects Montana to experience a 310% increase in nitrogen oxide pollution (smog).


Crystalline silica, in the form of sand, can cause silicosis (an incurable but preventable lung disease) when inhaled by workers. Sand is a main ingredient used in the fracking process. The National Institute for Occupational Safety (NIOSH)collected air samples from 11 fracking sites around the country. All 11 sites exceeded relevant occupational health criteria for exposure to respirable crystalline silica. In 31% of the samples, silica concentrations exceeded the NIOSH exposure limit by a factor of 10, which means that even if workers were wearing proper respiratory equipment, they would not be adequately protected.

Water Pollution:


Construction and Transport Actvity


Chemical additives are used in the drilling mud, slurries and fluids required for the fracking process. Each well produces millions of gallons of toxic fluid containing not only the added chemicals, but other naturally occurring radioactive material, liquid hydrocarbons, brine water and heavy metals. Fissures created by the fracking process can also create underground pathways for gases, chemicals and radioactive material.

The Environmental Protection Agency (EPA) and United States Geological Survey(USGS) have recently confirmed what residents of Pavillion, Wyoming had been claiming–that hydrofracking had contaminated their groundwater.


The Environmental Protection Agency (EPA) initially under an emergency administrative order forced three oil production companies operating on the Fort Peck Reservation, to reimburse the city of Poplar, MT for water infrastructure expenditures incurred as a result of drilling contamination. The oil companies appealed the EPA order, but were forced to rectify their violations by a federal judge.


Another scenario for contamination to occur is by faulty design or construction of the cement well casings–something that happened in the BP Gulf blowout disaster. Storage of the waste water is currently under the regulatory jurisdiction of states, many of whom have weak to nonexistent policies protecting the environment.

Soil and Oil Spill Contamination:


Oil Spill in Yellowstone River

According to journalists at Pro Publica, oil companies reported over 1,000 oil spills in North Dakota, 2011, with many more going unreported, state officials admit. The Associated Press also recently reported that the amount of chemically tainted soil from drilling waste increased nearly 5,100 percent over the past decade, to more than 512,000 tons last year. Steve Tillotson, assistant director of the North Dakota Health Department’s waste management division, told reporters that trucks are hauling oilfield waste to facilities “24 hours a day, seven days a week.”

An ExxonMobil pipeline rupture spilled 42,000 gallons of oil into the Yellowstone River,near Billings, MT. In the aftermath of the spill, ExxonMobil has disclosed that thepipeline has been transporting tar sands oil from Alberta, Canada, which is a low grade, more toxic and corrosive type of oil. Regulators had not been informed that the pipeline was carrying tar sands oil and the disclosure was a result of the spill. Tar sands oil was not in the pipeline at the time of the spill, though regulators are investigating whether or not it played a role in causing the pipeline to corrode.

Earthquakes

Earthquakes constitute another problem associated with deep-well oil and gas drilling. Scientists refer to the earthquakes caused by the injection of fracking wastewater underground as “induced seismic events.” Although most of the earthquakes are small in magnitude (the strongest measured 5.2), their relationship with the storage of millions of gallons of toxic wastewater does little to ease the fears over fossil energy’s long list of externalities.


http://www.peacecouncil.net/NOON/hydrofrac/HdryoFrac2.htm “Neighbors of Nonodaga nation.”

http://www2.epa.gov/hydraulicfracturing “Natural Gas Extraction – hydraulic Fracturing”

http://www.safewatermovement.org/what-is-hydrofracking/ “Save water movement!”

http://serc.carleton.edu/NAGTWorkshops/health/case_studies/hydrofracking_w.html “Geology and Human Health, Potential Health and Environmental Effects of Hydrofracking in the Williston Basin, Montana” by Joe Hoffman.

Generator Lab

Q: How long it takes to charge up a cellphone with a generator? (answer at the end.)

taschenlampe


Introduction:

This lab we are going to generate power with a hand generator. Inside of a generator there is a magnet that moves back and forth inside a coil of wire. When we are shaking the generator the magnetic field will change as the magnet pass through the coil and the change of magnetic field will generate voltage. According to the Faraday’s Law that changing magnetic fluxes through coiled wires generate electricity also known as current and voltage. The greater it changes, the more power will generate. With NXT adapter we will be able to collect data to see how much power we have generated.

animated-flashlight3

Equipment:

One generator

one voltage probe

one NXT adapter

NXT

labview VI

Excel sheet

Procedure:

1. We are provided a labview file, generator_lab.vi, to record our data. Before we start we need to understand how the file works. Once the program is running we will have 30 seconds to record the data. Each second the program will show the voltage that generated. Then VI will export the data to excel file.

2. After we connect the generator to NXT at the 1 terminal and connect the NXT to the computer we are now able to record the data. First we will shake the tube at a particular rate. As we shaking it we will also need to count the number of shake within 30 seconds.

3. After we run the program and record the data on VI there will be 30 data points each represent how much voltage you create in one second. Then We can export the data to excel, calculate the sum of the squares of the voltages (SSV). Repeat above steps 3 more times but each times with different rates of shakes.

4. After we find each SSV we are going make a plot to show our result with linear curve.


Data:

Untitled
The above data table provide the proof of Faraday’s law. It shows that when the magnet inside the tube is moving forward (upward) the value we get it positive, but when the magnet is moving backward (downward) we will have negative result because the changing magnetic field can be negative. The coil in the tube did not change the direction of current flow therefore when the magnet is moving the opposite direction the data will have negative result. When we calculate the sum of squares of the voltages negative value will become positive. The table also shows us that with the number of shake increase are also increasing the generate energy.

# of shake sum of the squares (v)
16 0.61
26 0.895
40 1.619
80 3.493
100 8.423

This table will have a better view about when the number of shakes increase the sum of the output voltage increases.

Untitled

The graph shows us the generated voltage is directly proportional to the number of shakes. As the number of shakes increases the more voltage we will generate, therefore the graph gives us linear relationship.


We are using about 80 mA and 110 v as input to charge up a cell phone. We need about 3 hours to get it fully charged, therefore 0.08 A*110 v = 8.8 W. With 3 hours 8.8 w *3 = 26.4 watt-hour, and it is about the same that supplying 50 watt light bulb for 30 minutes. As we can see we were be able to generate 8.423 v with 100 shakes in 30 second. So at this rate we will be able to charge a phone in 8.432 v*0.08 A=0.67456 w, and 26.4/0.67456 = 39.16 hours. So with in 40 hours with 200 shakes per minutes and no rest we will be able to charge our phone.

A: 40 hours.

Conclusion:

This lab is helpful to me to have a better view about green energy and also have a better idea how much work needed to provide certain amount of energy. It is interesting to see how much energy we will be able to produce in short amount of time. After this lab we are also be able to know the precious of energy.

Increase Gas Mileage

gas-money


Now a day, gas price is sky high, people need to find an efficient way to increase the mileage for each gallon.

Fuel economy standards which established in 1975, hadn’t changed much since the mid-1980s. But now the Obama Administration is ratcheting up pressure on the auto industry to dramatically increase the average miles-per-gallon of each company’s fleet. Under a rule passed in 2010, carmakers were already on the hook to achieve an average 34.1 mpg across their fleets by 2016. This week, the government raised the bar even higher, to an average 54. 5 mpg by 2025. But the new standards will likely require auto companies to develop more hybrids, plug-ins and natural gas vehicles, while using more lightweight materials and improving traditional gasoline engines.

So far, the new mileage rules have generated tangible benefits for consumers, with few of the downsides opponents have predicted. “Without a doubt, the new rules have been a win-win for everybody,” says Jesse Toprak, of the car-research site TrueCar.com. “It’s a win for consumers, a win for manufacturers, and a win for the environment.”

The “Corporate Average Fuel Economy,” or CAFE standards, will vary by automaker depending on the mix of models they sell. The requirements will be lower for companies such as General Motors, Ford and Chrysler, which offer more pickup trucks. The standards can be lowered by the government if people suddenly start buying less-efficient vehicles in the future, although few expect that to happen.

How the automobile helps the customers to increase the gas mileage?

The very common technology we can see in many new cars, there is a Econ mode in lots of Europe cars. What it does is to shut down the engine while drivers are waiting for the red light of trying to pick up someone and just make a short stop at the airport. This technology benefit not just the user but also the environment, when the econ mode is on the engine shut off when the vehicle stopped, this helps to reduce the emission of carbon dioxide.  And here are some other examples from different companies, with different type of cars that have similar technology to benefit the driver and the environment. The 2013 Kia Rio, for instance, joins the BMW 3-series and Porsche Cayenne in offering a start-stop engine. That technology, once reserved for hybrids, saves fuel by shutting down the engine when the vehicle is stopped. Many cars, including the Mazda CX-5 and Volkswagen Golf, use variable valve timing to maximize fuel efficiency and performance. It was first seen on Acura’s exotic NSX in 1991. Others are offering continuously variable transmissions (CVT), which have no traditional gears but keep the engine at its most fuel-efficient RPM across a wide range of speeds. Cars with CVTs include the Infiniti JX, Nissan Altima and Subaru Outback. Aerodynamics also plays an increasing role in improving fuel efficiency. Modern cars like the Cadillac ATS, Dodge Dart and Ford Escape, for example, have shuttered panels in the grille that allow air to flow more smoothly around the vehicle, depending on speed and driving conditions.You can also buy a car that shuts down one or more engine cylinders when it is coasting, or cruising under a light load, reducing fuel consumption without sacrificing performance. Vehicles that offer this technology include the Audi S8 and Honda Odyssey minivan. Cars like the Buick Encore, Fiat 500 andLincoln MKZ, meanwhile, improve mileage through direct fuel injection, which injects gas directly into the combustion chamber in extremely precise amounts.

Even hybrids have changed. The Ford Fusion, Honda Accord and Toyota Prius are all available as a plug-in hybrid, while General Motors uses a smaller motor and battery pack to give a little electric assist to cars like the Buick LaCrosse and Chevrolet Malibu.

Here, courtesy of Total Car Score, are 10 fuel-saving technologies that will save you money.

http://www.youtube.com/watch?v=HU5RhAN2EGQ

This video gives some tips that you can do to improve gas mileage.


http://www.youtube.com/watch?v=HU5RhAN2EGQ “youtube.com, lessons from a car expert: how to increase gas millage.”

http://www.forbes.com/sites/joannmuller/2012/08/30/10-ways-automakers-are-helping-you-spend-less-on-gasoline/ ” Forbes, 10 ways Automakers Are helping you spend less on gasoline.” by Joann Muller 8/30/2012

http://www.usnews.com/news/blogs/rick-newman/2012/08/27/tough-government-gas-mileage-rules-good-for-drivers-auto-industry “US news, Tough Government Gas Mileage Rules Good for Drivers, Auto Industry” by Rick Newman