Solar Cell Lab

Solar Cell Lab

A) Overview

Today, my friend, Yoshi, and I had another lab based on a solar cell.

B) Equipment

-One solar cell

-One voltage probe

-One NXT adaptor (with light sensor)

-One light source

– Three colored film filters (Red, blue, purple)

C) Procedure

1. Yoshi is responsible for performing experiments to try to gain an understanding of the relationship between light intensity and the voltage output of the solar cell, as well as the relationship between the wavelength of light and the voltage output of the solar cell.

(Be aware: We use red, blue, and purple colored film filters during the experiments.)

2. As for me, I put all the data we got throughout the whole experiments in the Excel file.

D) Results

-We got different results or averages when testing with no lights, red filter, blue filter, and purple filter.

E) Analyzing results, picture sharing

The wavelength and frequency of light are closely related.

(When the frequency is higher, the wavelength is shorter.  Because all light waves move through a vacuum at the same speed, the number of wave crests passing by a given point in one second depends on the wavelength. That number, also known as the frequency, will be larger for a short-wavelength wave than for a long-wavelength wave.)

Lower wavelength -> higher photon energy -> higher intensity

Red light: 650 nm Orange light: 590 nm Yellow light: 570 nm Green light: 510 nm Blue light: 475 nm Indigo light: 445 nm Violet light: 400 nm

F) Sources

http://hubblesite.org/reference_desk/faq/answer.php.id=72&cat=light

The equation that relates wavelength and frequency for electromagnetic waves is: λν=c where λ is the wavelength, ν is the frequency and c is the speed of light.


Trip to MIT nuclear reactor

A) Overview

Today, I had a trip to MIT nuclear reactor along with Dr. Shatz and other friends in my class.

B) Weather

Sunny, nice, comfortable

C) Brief summary about the trip

-Walk to Charles/MGH station from Suffolk University Archer building, then travelling T train and arrive at Kendal/MIT, walk to MIT nuclear reactor for around ten minute

-Arrived there at around 2 p.m and sign ourselves in

-In the next hour, introduction and explanation are talked by two workers

-Leave MIT nuclear reactor at around 3:20 p.m and went home with my friend, Yoshi by train (reversed way)

D) What’s about it? (Their missions and goals: From Brochure)

The MIT Nuclear Reactor Laboratory (MIT-NRL) is a leading university laboratory that conducts interdisciplinary research. MIT-NRL operates a 5 MW nuclear reactor in the United States. Our mission is to provide faculty and students from MIT and other institutions with both a state-of-the-art neutron source and the infrastructure required to facilitate to use of the reactor.

E)Journal Entry

In a sunny and nice weather, I had a trip to MIT nuclear reactor along with Dr. Shatz and other friends in my class.

Gathering in the room we always had class at 1: 10 p.m, we set our trip.  We walked to Charles/MGH station together while Dr. Shatz rode a bike. Our stop was Kendal/MIT, which was only one stop behind Charles/ MGH station. Then, we walked to MIT nuclear reactor for around ten minute.

We arrived there at around 2 p.m and sign ourselves in. There was a woman helped us out. She took out a tool and looked at the lights. I was not sure about the name but it was how she looked at our radiations.

In the next hour, there were some brief introductions and explanations that are shared by two workers. They gave us a brief visit on almost every single thing. They showed us the reactors and control room. What impressed me the most was how we got through from one space to another by using a door. There was a machine that could detect the worker’s eyes and let her go in. We just followed by. Before we left the MIT nuclear reactor at around 3:20 p.m, we had to clean our hands. There was a machine that could clean our hands in five seconds when we put our hands in it. Isn’t it interesting? To leave, I went home with my friend, Yoshi by train by using the reversed way.

It was a wonderful feeling to visit MIT. It was my first time to be there. This experiment could definitely give me have a little recognition the uses of reactors.

F) What are these?

A) Reactor Top View B) Nuclear Reactor Core C) Reactor Floor View D) Reactor core with Cerenkov Radiation #) Sillicon area and Prompt Gamma Facility G) Control Panel for Boron Neutron Capture Therpy Irradiation H) Fission Converter Process System I) The NRL control room

G) Experimental facilities: The MITR operates at full power 24 hours a day, 7 days per week. A typical fuel cycle lasts about 6 weeks. Table 1 is summary of the neutron fluxes of the major experimental facilities.

Table 1.   MITR Neutron Flux Levels at 5 MW

Facility Size Thermal Neutron Flux
(n/cm2-s)
In-core Irradiation Facilities Up to three available
~ 2” ID x 24”
3 x 10¹³, (up to 1 x 10¹⁴ fast)
Medical Facilities:
Fission Converter Beam Variable beam aperture Epithermal: 5 x 10⁹
Thermal Neutron Beam Variable beam aperture up to 1 x 10¹⁰
Ex-core Irradiation Facilities:
Pneumatic Tubes 2” ID tube
1” ID tube
5 x 10¹³, (up to 4 x 10¹²fast)
8 x 10¹²
Vertical Ports 3” ID x 24″ 4 x 10¹²
Beam Ports 12 horizontal: 4” to 12” ID 4 x 10¹² – 8 x 10¹³*
Through Ports 4” Port
6” Port
5 x 1012*
1 x 1013


Generator Lab

Generator Lab

A) Overview

Today, my friend, Yoshi, and I had another lab based on a tube shaking, which has a magnet inside that will travel back and forth through a coil of wires.

B) Equipment

-One generator

-One voltage probe

-Battery, USB

C) Procedure

1. Yoshi shakes the tube at a particular rate.

2. I count the number of shakes in the data collecting interval (set to 30 seconds)

3. We calculate in Excel the sum of the squares of the voltages on the computer.

4. We repeat 1-3 three more times in different rates of shakes.

5.  We plot the SSQV’s as a function of # of shakes and fit the result to a linear curve (See the graph below)

D) Graph and results

Key)

-Title: Sumsq of voltage vs. # of shakes of a generator

-x-axis: # of shakes

-y-axis: Sumsq of voltage (v^2)

E) Results analyzing

When the number of shakes increase, Sumsq of voltages increase.

Lego Mindstorm Experiment


A) Overview

In today’s lab, my friend, Yoshi and I made a program like above to investigate the uses of different formulas or laws

B) Formulas and laws

The following are some formulas and laws we had used in today’s lab.

-Newton’s Second law = Force = mass * acceleration (F=ma)

-Law of conservation of energy = Law which states energy cannot be created or destroyed, but may be changed from one form to another.

-Velocity and acceleration = velocity (speed and direction of an object) ; acceleration (the rate at which the velocity of a body changes with time)

-Power = the rate which work is performed or energy is converted

-Potential energy = mass*gravity*height (P.E.= mgh)

C) Graphs and Results


D) Results analyzing

-When the mass increases, the acceleration decreases.

-When the power increases, the acceleration increases.

-When power level increases, the power increases.

-When matter increases, battery damage increases

Fukushima Daiichi nuclear disaster

A) Introduction

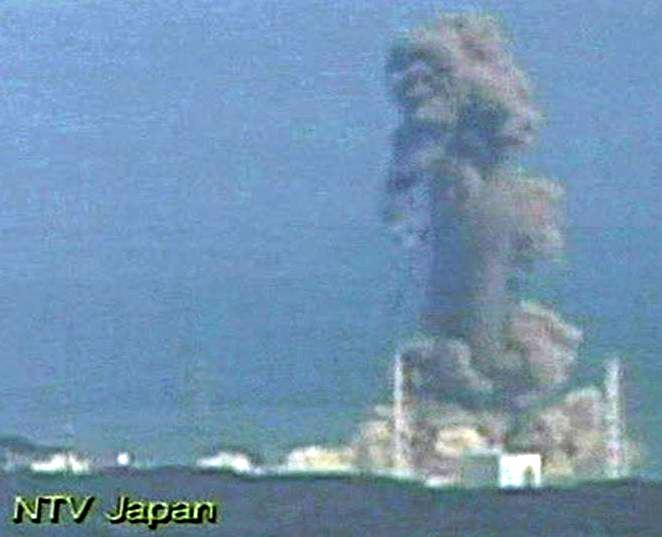
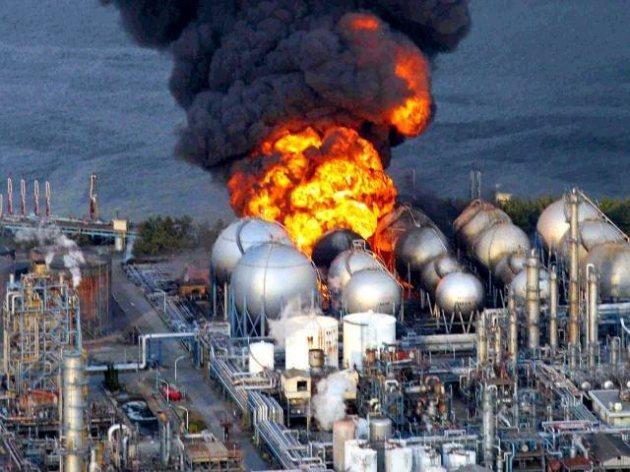
Hello! Today’ blog is about one of the well-known nuclear disasters happened in 2011. It was the Fukushima Daiichi nuclear disaster, which occurred in Japan and the pictures shown above was the incident.

B) Brief summary of this disaster:

1. This disaster happened on March 11, 2011. In Chinese, we addressed it ‘福島第一原子力発電所事故’.

2.The significance of this accident was because there a number of equipment  failures, nuclear meltdowns, and releases of radioactive materials. This event happened after Tohoku earthquake and tsunami.

3. INES (International Nuclear Event Scale) rated this outcome as level 7.

4. Sadly, there were some injuries and casualties found afterwards.

C) Reactors

Reactors played a big role before this disaster. They were either destroyed or under operator after the accident.

Reactors 1 – 6: Boiling water reactor (types), general electric, Toshiba, Hitachi (suppliers)

– Reactor 1: a. damaged after the incident b. supplied by Genetic Electric c. built with Mark I type (light bulb torus) containment structures d. constructed in 1967 e. a 460 MW electric power

-Reactor 2: a. supplied by Genetic Electric b. shutdown after the incident c. built with Mark I type (light bulb torus) containment structures d. constructed in 1969 e. a 784 MW electric power

-Reactor 3: a. supplied by Toshiba b. damaged after the incident c. built with Mark I type (light bulb torus) containment structures d. constructed in 1970 e. a 784 MW electric power

-Reactor 4: a. supplied by Hitachi b. shutdown after the incident c. built with Mark I type (light bulb torus) containment structures d. constructed in 1973 e. a 784 MW electric power

-Reactor 5: a. supplied by Toshiba b. damaged after the incident c. built with Mark I type (light bulb torus) containment structures d. constructed in 1972 e. a 784 MW electric power

-Reactor 6: a. supplied by Genectic Electric b. shutdown after the incident c. built with Mark II type (light bulb torus) containment structures d. constructed in 1973 e. a 1100 MW electric power

-Reactor 7,8: Cancelled after incident occurred b. planned to rebuild in 2016 (reactor 7), rebuild in 2017 (reactor 8)

D) Causes and effects / advantages / disadvantages / solutions ( recommendations)

– Video haring: Some people said this incident is a man-made disaster. Why so?

Click on the website and you will find out:
(Enjoy) http://www.youtube.com/watch?v=VvRMKAk27-U

-Disadvantages for having nuclear power plant: would be the constant argument on the safety standards of nuclear power plants (From this event: the more nuclear power plants are built, the higher the probability of a disastrous failure somewhere in the world)

-Some lessons learn from this incident:

Lesson 1: continued health monitoring

Lesson 2: keep on the effective, long-term cooperation

E) Opinions and comments

Picture sharing: Personally and honestly, I did not want to to see such event like the above picture happen again. Burning and destruction not only cause people’s lives, also wasting money and time to rebuild. I do not care if it is man-made because the accident had occurred already. Be brief, I hope we have a safe industry.

F) Sources / References / Websites

1. http://en.wikipedia.org/wiki/Fukushima_Daiichi_nuclear_disaster

2. http://en.wikipedia.org/wiki/Fukushima_Daiichi_Nuclear_Power_Plant

3. https://sitn.hms.harvard.edu/sitnflash_wp/2011/06/nuclear-chemistry-lessons-from-the-fukushima-daiichi-disaster/

4. http://www.nippon.com/en/features/c00705/

Natural Gas Hydraulic Fracturing (hydro-fracking)


What is Hydraulic fracturing?

Hydraulic fracturing is the propagation of fractures in a rock layer, as a result of the action of a pressurized fluid. Some hydraulic fractures form naturally—certain veins or dikes are examples—and can create conduits along which gas and petroleum from source rocks may migrate to reservoir rocks. Induced hydraulic fracturing or hydro-fracking, commonly known as fracking, is a technique used to release petroleum, natural gas (including shale gas, tight gas, and coal seam gas), or other substances for extraction. This type of fracturing creates fractures from a drilled into reservoir rock formations.


This process was first used commercially by Halliburton in 1949. It involves injecting millions of gallons of water, mixed with sand and chemicals, deep into the ground at high pressure in order to break up dense shale rock formations and release trapped natural gas to the surface.

Geology: Mechanics, veins, dikes (High-level minor intrusions such as dikes propagate through the crust in the form of fluid-filled cracks, although in this case the fluid is magma. In sedimentary rocks with a significant water content the fluid at the propagating fracture tip will be steam.)

Environmental impact: Hydraulic fracturing has raised environmental concerns and is challenging the adequacy of existing regulatory regimes. These concerns have included

ground water contamination, risks to air quality, migration of gases and hydraulic fracturing chemicals to the surface, mishandling of waste, and the health effects of all these.

(Effects -> Water contamination, agricultural production, water use, consumer confidence, rural communities)

The UT study described the environmental impact of each part of the hydraulic fracturing process, which included:

(i) Drill pad construction and operation

(ii) Injection of the fluid once it is underground

(iii) Integrity of other pipelines involved

(iv) Disposal of the flowback

How does a real hydrofracking site look like? The above picture shows.


Specific process of hrdrofracking:

To begin, the drilling company sets up the dill site by cutting down any surrounding trees and ground cover, most likely build an access road and rig, set up their necessary equipment, and truck in water, prop pant, and chemicals.

After the drill site has been set up and prepared, the drill bores a well downward and then horizontally for up to 8,000 feet in each direction. While the drill bears downward, it will drill through the natural aquifer, or water table.


We ban hydrofracking because it is inherently unsafe and we cannot rely on regulation to protect communities’ water, air, and public health.

This is a two minute video about hydrofracking:

http://www.youtube.com/watch?v=urj3EqhZ5U8

(ENJOY!)


Ways the automobile industry is using to increase gas mileage

Question 1: What is the definition of gas mileage?

A gas mileage is the ratio of the number of miles traveled to the number of gallons of gasoline burned.

Question 2: What are the main causes of gas mileage?

-Your spark plugs are responsible for sparking combustion in your engine. If they misfire, or are working poorly, this can effect your gas mileage in a negative way.

-Many people waste gas by idling, which is when you have your engine on, but you are parked and not moving. Common places where this occurs is when you are trying to warm up your car during winter, or while you are waiting to pick someone up.

-Main causes: Gasoline (Gasoline costs can be a major part of a household budget. You use gasoline every time you take the car out to run an errand, get to work or take a trip. Gasoline consumption also contributes to air pollution.)

(i) Under-inflated tires are a common cause of poor gas mileage.

(ii) Not following the recommended schedule for your car’s tune-ups can increase your gas consumption.

(iii) The amount of gas your car consumes is greatly increased by the number of trips you make trying to finish your daily errands.

(The more revolutions per minute you make your engine do, the more gas you will use.)

Question 3: What are the solutions or proven ways of gas mileage?

(i) Drive more efficiently, keep your car in shape, choose a more efficient vehicle

(ii) Keep your engine tuned up. Incorrect fuel ratio

(iii) Use air conditioner less than usual

(iv) Use a good engine oil

(v) Reduce the weight in your vehicle as much as possible


Increase energy sustainability:

Sustainable energy use is energy use that meets the needs of the present without compromising the ability of future generations to meet their energy needs. Achieving sustainable energy use requires that energy be (a) developed from renewable resources (b) produced by cleaner, more-efficient technologies(c) used more efficiently and with greater conservation

Brief information about automobile

History of automobile

The history of the automobile begins as early as 1769, with the creation of steam engined automobiles capable of human transport. In 1806, the first cars powered by an internal combustion engine running on fuel gas appeared, which led to the introduction in 1885 of the ubiquitous modern gasoline- or petrol-fueled internal combustion engine. Cars powered by electric power briefly appeared at the turn of the 20th century, but largely disappeared from use until the turn of the 21st century. The early history of the automobile can be divided into a number of eras, based on the prevalent means of propulsion. Later periods were defined by trends in exterior styling, and size and utility preferences.

An automobile is an example of a complex machine.

Pros of using automobiles: work, school, emergencies

Cons of using automobiles: scumbags, accidents, air pollution

Robotic Lecture (09/20/2012)

Today was September 20, 2012 and there was a great weather outside my classroom. In spite of hanging outside, I had a great time in my class with my partner, Yoshi, to make a robot.

To begin with, we got a battery in order to make the robot move. Meanwhile, we took a box with full of tools in order to make a model.

Our goal of today was to calculate the percentage errors of different powers (25,50,75,100).  To calculate this value, we need to how far can each power go. After our careful observations, we got our satisfying results, as well as the number that the wheel turned.

The formula of calculating the percentage error is:

Percentage error = [ |distance (ruler) – distance (robot) | / Average] * 100%

Average = (distance (ruler) + distance (robot)) /2

(This formula looked familiar to me as I used this formula since I was studying in High School Physics class. I know that the results will be ugly but it is normal. We calculated four percentage errors and the data were listed  below.)

Power(Port A)(Port B) Distance (m) Number of wheel turns Distance PercentageError
25 0.075 159.696 0.07663 2.15%
50 0.175 353.329 0.17246 1.46%
75 0.27 559.332 0.26846 2.40%
100 0.47 2.2333… 0.38509 19.9%

We also had two great photos uploaded to prove we had done a pretty great job today.


It was so glad to have an interesting robotics lecture today with my good pal, Yoshi. I am looking forward for another cooperation time with him.

Germany’s green energy policy

Germany’s green energy policy

A single question about Germany, what energy does Germany use nowadays? Are they using the same energy as the United States of America or other countries? Nowadays, Germany is using wind power, the most important power used by them.

Before we discuss their single energy using at this moment, let’s how the German government announced their new ambitious energy targets by different years

– Renewable electricity: 35% (2020), 80% (2050)

– Renewable energy: 18 % (2020), 30% (2030), 60% (2050)

How does it sound to you?

Now, let’s discuss the main power that Germany is using nowadays:

-wind power: third largest user -> behind China and the U.S.


The following is the recent news about Renewable Energy Investment Attractiveness:

Let’s have a wild guess on Germany, the U.S., and China. Who ranks number 1? Number 2? Number 3?

Number 1: China, dropped 0.2 points from the last index in May, 70.2 points

Number 2: Germany (level with the U.S.), 66 points, huge investments in its offshore wind energy sector and solar sector is the reason behind

Number 3: the U.S. (level with Germany), 66 points, marginally leading Germany in the second spot in the renewable energy investment attractive index

Others: India (64.1 points), UK (55.3 points), France, Italy, Canada, Japan, and Brazil

Shocked? No feeling?

The government in Germany has delivered many successes for jobs in Renewable energy. This though establishes a level of performance which others have failed to achieve. For example, in spite of great effort, the Scottish National Party (SNP) Devolved Government on Scotland has still yet to gain extra Renewable Energy jobs, emulating German government success, in excess of those jobs which already existed when the SNP first took office in 2007.

German taxpayers have backed more than $130 billion in solar subsidies to date, contributing largely to rising electricity costs for households (second highest among European countries). But German businesses may be hit even harder.

Is it failing?

Germany has set higher targets for renewable energy usage than any other industrialized nation. Angela Merkel’s government plans to decommission its nuclear plants by 2022 and to obtain 80 percent of all energy from renewable by 2050. So far, though, too many promises from Berlin have gone unfulfilled.

Bad beginning -> broken promises -> unanswered questions -> a false start? Or is patience needed?


Germany’s Green Energy Policy Hit Households Hard

-Many people in Germany are no longer able to pay their electricity bills. Skyrocketing electricity prices are making electricity unaffordable for a large number of Germans.

– Real paradox: As a result of Germany’s green energy transition, nuclear power is on its way out, but coal, Germany’s dirtiest resource, has become the most important energy source again.

Wind farm and Germany renewable power