It is experiment time (part 2 )

Experiment Time:

Today we were able to present our experiment to the class, and it was embraced with eager minds. During our last lab session, we had the opportunity to share our experiment with two of our classmates who were able to successfully follow the procedures provided to them and calculate all of the required values. And even though this experiment was a bit heavy on formulas they still seemed interested.

As you may recall, initially our experiment was designed to test different types of blades and find the ideal air speed necessary to produce enough electricity to light up a series of LEDs. Unfortunately, this was not possible since the maximum amount of  voltage that we got out of our wind turbine was around 300 mV. In order to light up a single LED we needed at least 1.6 Volts. We considered coming up with some circuit configurations, but ultimately decided against it since circuit configurations are beyond the scope of our class’s spectrum.

After several trials of trying to figure out the best way to conduct our experiment; we finally came up with a comparable idea that will still cover the concepts that we were aiming for: Wind Turbines; Power Efficiency and Electricity Generation.

The Experiment:

First, our classmates will have to calculate the input power from the electric fan to the wind turbine by using some provided information, such as the fan’s speed and air density, and measuring other values  such as the fan’s diameter.

Secondly,  using  a multimeter, students will measure the output voltage and current from the wind turbine. These values will be necessary  to determine and calculate the Output Power.

Finally, after having both values of input and output voltage from the wind turbine, students will then be able to determine the efficiency of the this wind turbine. All of this data was recorded on a table.

Our Results:

To make sure this experiment was actually successful, we performed this experiment  and obtained the following values:

Fan Speed

Radius

Area

Air Speed [m/s]

Power in

Output Voltage

Current

Power out

Efficiency

Low

8.5 cm

.025

m^2

3.5 m/s

318 mW

240 mV

30 ma

7.2mW

2.2 %

High

8.5 cm

.025

m^2

3.8 m/s

407

mW

280 mW

35 ma

9.8

mW

2.4%


Formulas Used:

          Power (input) =1/2 *( Air Density) *(Area)*(Betz Limit)* (Air Speed)^3

          Power (output)=Current *Voltage

          Power Efficiency (%) =(P output /P input)*100

What Was Learned?

Lastly to ensure that our  experiment was fully understood and properly related to the concepts of power and efficiency; we asked the following questions:

  1. Does the experiment prove the concept of power? i.e. does higher fan speed result in greater power generated

  2. Do your results match the definition of  P=IV; meaning, does greater voltage result in a greater amount of power generated.

To both questions, the answer is yes. The air speed is proportional to the power generated  from a wing turbine; also, greater speed results in greater voltage and current generated  which consequently results in a larger value of power generate. We believe that the best way to understand this values was with a  graphical representation. In layman’s terms, the higher the input, the higher the output.

Figure1 : Comparing power efficiency wat two different speeds

The graph clearly demonstrates that at a higher speed 3.8m/s the wind turbine is 20% more efficient than it is when using a low speed 3.5 m/s.  These results prove the concepts of power and make our experiment successful.

Posted in Uncategorized | Leave a comment

President’s Climate Action Plan

As we already know, environmental pollution is a reality around the world that results is global warming and climate changes .  “While no single step can reverse the effect of climate change, we have a moral obligation to future generations to leave them a planet that is not polluted and damaged”[1]  . In June of 2013; the president of the United Stated released a Climate action plan, that has as a main goal to cut  carbon pollution  that cause climate change . This plan consists several action plans but all of these can be grouped into three main areas:

1)   Cut Carbon Pollution in America

2)   Prepare the United Stated for the impacts of climate change

3)   Lead international efforts to combat global climate change and prepare for tis impacts

On this post I will be discussing one action that is related to each one of the categories listed above.  First, in order to protect society’s health and move the United state’s economy towards American-made clean energy sources and consequently create more job opportunities, the Obama Administration has created new rules to cut the carbon pollution. Among these we have: Cutting energy waste in homes, business and factories.  Achieving this goal is not simple and it involves  other smaller objectives such as establishing  new energy efficiency  standards and  reducing barriers to invest in energy efficiency .

Personally I believe this two action plans are one of the most important is we are trying to achieve less energy waste.  If the energy efficiency is regulated , better efficiency, for new appliances and building then the amount of energy consumed by this would be less  which will consequently result in  a decrement on the energy bills. Similarly, in order to be able to improve energy efficiency standards, companies will require more capital for research. For this same reason reducing barriers to investment is Important . This action plan  consists on an “update to the Energy Efficiency and Conservation Loan Program to  provide up to $250 million for rural utilities to finance efficiency investments by business and homeowners across rural America” [1] Additionally,  the Department of Housing and Urban Development’s efforts include a $23 million Multifamily Energy  Innovation  fund designed to enable affordable housing  providers, technology to deliver cost-effective residential angry .

The second goal of this Climate action plan is to prepare the unites stated for the impact of climate change, starting with building stronger and safer communities and infrastructure. It is no secret that extreme weather conditions will cause  a  great amount of damage  if the city   is not prepared for it.  Therefore , the “National Institute of Standards and Technology will convene  a panel on disaster –resilience standards  to develop a comprehensive, community-based resilience framework and provide guidelines for consistently safe building and infrastructure- products that can inform the development of private-sector standards  and codes” [1]. If buildings, houses, and roads are developed following a set of   climate change regulations, accordingly to their location, then  climate  disasters could be prevented  resulting in less amount energy that will be required to recover  the affected area.

Lastly the last aspect of this action plan is to leas international efforts to address global climate change. “The Obama Administration  is working to build on the actions that it is taking domestically to achieve significant global  greenhouse gas emissions reductions and enhance climate preparedness through major international initiatives “ [1]. Working with other countries to take action to address climate change is the first  aspect on this last goal. Among the objectives   reducing emissions form deforestation and forest degradation is an important  area that you be considered internationally.    Greenhouse gas emissions from deforestation, agriculture and other land use  constitute approximately 1/3 of  global emissions. For this reason, the Obama Administration is working to address agriculture-driven deforestation through initiative such  as the Tropical Forest Alliance 2020  [1], which brings together  governments, the private sector, and civil  society  to reduce  tropical deforestation related to key agricultural commodities.


One aspect that really called my attention from the President’s Climate Action Plan is the fact that   improving  the planet’s  is an action that goes beyond  some simple ideas  but it  requires coordination and planning  down to the smallest detail . Every kind of  society group , governmental or non-governmental, should be taken into  account   when implementing a new action.


Posted in Uncategorized | Leave a comment

Before we teach you, we must practice!

Few weeks ago, my team and I came up with an idea of how to proof some of the concepts that we have learned throughout this semester. You may remember that we want to use a wind turbine to test the relationship between power, wind speed and surface area. We will also like to use the basics of Ohm’s Law, power, and efficiency to obtain more information out of our measurements.

Initially we intended to simulate the power and electricity generation by lighting up several types of LED’s. Unfortunately, this was not possible since the amount of voltage and current coming out of our wind turbine was not enough to light them up. So instead of coming up with a crazy circuit configuration that will probably take some time to conned and assemble, we decided to stay with basics: We will use a multimeter to obtain  several measurements and use some formulas to obtain more values. Once we have all these values we will be able to compare  them and  hopefully confirm that our values follow the concepts and laws that we have learned  throughout this semester. Below is an image that provides a  shot review of how wind turbines generates electricity.


Wind-turbines-3


Image1 : Diagram of a wind turbine

Posted in Laboratory sessions | Leave a comment

It is experiment time ! (Part one)

    After a  very entertaining semester we are almost with our classes and hence our  time together; but , before everything is over we have one last chance to  get together into groups and develop a fun and educative experiment that is related to all the  material that we have covered. With this being said we have come to the following concepts that we want cover:  wind turbines; power efficiency and  electricity generation. This is what we have in mind for our experiment: We will like to test the different types of blades and determine that will be the most efficient for electricity and power generation; we will also want to determine the distance (which influences the speed of the wind) that will  produce the largest amount of  electricity; enough to light up a couple of  LED’s; and finally we will like to combine what  we discovered previously and use it to light up as many LED’s as possible.

   We will like to meet again and perform  this experiment a couple of time so we can make sure everything will work correctly and try to solve any possible errors that we may encounter.  We will keep  you posted with any updates on this experiment and hopefully we will not end up like this poor girl

 chemical-experiment-image

Posted in Uncategorized | Leave a comment

Having fun at the Museum of Science

     One of my favorite places to go in Boston is the Museum of Science; I had the opportunity to go for the first time on my freshmen year and since then I had the opportunity to visit the museum several times. Last week, I had another opportunity to  go to the museum one more time. Normally on my visits, I will go straight to the electricity section; but this time I visited new exhibitions. All these exhibitions were related to the topics that we have covered in our class throughout this  semester,such as, green energy and advances in technology that will help the environment. These were the exhibitions that we visited: “Conserve at home”,“Catching the wind”, “Energized”, and “Microrobotics takes flight”

     Our first stop was “Conserve at home”;  this exhibition showed how  by  making simple changes such as the type of light bulbs that we  use  will help us save energy.   This  exhibition had two particular demonstrations that called my attention; the first one  consisted of: a water tank that represents a specific amount of watts and two buttons  that  represents us “turning on” two household devices: a hair dryer and a mixer. By pression one of the buttons the tank starts to drain at particular speed which is equivalent to the  amount of watts consumed by this device. The mixer will drain the tank at a greater speed than the hair dryer; taught us how to be aware of the devices that we use in our household and how using all of the at the same time will have a great impact in out kilowatt/hour consumption.

    The second demonstration consisted on 3 different type of light bulbs and the only way to turn them on was by  using a hand crank generator. The 3 bulbs were an LED (requires at least 8watts  to turn on); an Incandescent bulb (requires 40 watts to turn on); and a CFL bulb(requires  9 watts to light up). As  you might have guessed the incandescent  light bulb  requires a lot more effort and work from the generator to  light up; whereas lighting up the LED was much easier and required much less work. This exhibition demonstrates that a simple change in your houses such as the type of light bulbs that we use  will create a different in the power consumption.

20141031_132028

Picture 1 : Starting our tour with “Conserve at home” light bulb exhibition

    After learning how to conserve energy at home we moved  to the “Energized” exhibition  where we learned about different power generation methods that will  help us in the future such as solar panels and wind turbines.  The museum of science counts with solar panel in the rooftop. These solar panels provide the energy required for some exhibitions and presentations such as  the electricity presentation and  the van de graaff machine that is used on this presentation. This exhibition also provided information on the different types of power plants in the state of Massachusetts  and how the amount of these have incremented  have  increased significantly in the past 10 years.

     The significant increase in wind turbines in Massachusetts  lead us to the next exhibition “Catching the wind”. This exhibition showed us the power of the wind and how it can be used to generate energy. The most interesting part of this exhibition was to learn about the different types  of wind turbines: Skystream, Proven 6, AVX1000 , Swift and Windspire. The exhibitions provided a graphical representation of the power productions for each type of wind turbine. The most efficient is the Proven 6 (see picture below) that produces almost 5000 watts with wind speed of 20 miles/hour. On the contrary, the windspire (see picture below) is the least efficient  type of turbine; it only produces  a little more that 500 watts with a wind speed of 25 miles/hour.

20141031_134145
Picture 2 : Proven 6 power production graph
20141031_134029

Picture 3 : Windspire power production graph

   Finally; our last stop  was the “microrobotics take flight”  exhibition.  Personally I believe this exhibition was one of the most interesting and futuristic from this trip.  This exhibition  talked about some microrobotics devices called Robobees.  “The Robobees research team has been working for years to develop a colony of robotics bees, while also advancing microrobotic technology.  A wide range of  experts from Harvard and Northeastern universities are collaborating to create this tiny, complex, flying robot. The researches are divided into three specialized laboratories developing the Robobee brain, body and colony”

   One of the activities on this exhibition was to combine different types of  sensors and battery values  to  obtain the highest efficiency  for the Robobees. The purpose of  the colony of robobees would be to pollinate   specific  areas. These reason  I find these so interesting  is that  by   a big colony of Robobees then  a larger area can be rapidly pollinated  and therefore  help the environment.

After  learning about Robobees,  our Museum of Science  was over but  I couldn’t  leave    without  visiting and watching the indoor lightning show.

lightning

Posted in Uncategorized | 1 Comment

Geothermal energy in Iceland

     Imagine living  thousands of miles  from  any other  other civilization and  your only option to produce energy would be importing   the raw materials from any other countries.  Now picture that you have in your own country  you also have an active volcano.  This means that your  power and electricity production  are very limited; luckily  for   you the fact that you have an active volcano  in your country is a living proof that   below the Earth’s crust, there is a layer of hot and molten rock called magma. Heat is continually produced there, mostly from the decay of naturally radioactive materials such as uranium and potassium. [3].   Besides the magma ;  pockets of hot water and steam can be found deep underground. Hot water and steam can be piped up through underground wells and used to generate electricity in a power plant all of this is possible  thanks to a Geothermal power plant [1]. There are Three different types of geothermal power plants:

  • Dry steam plants. Hot steam is piped directly from geothermal reservoirs into generators in the power plant. The steam spins turbines, which generate electricity.[1]

    drysteam

Figure 1 : model of a Dry steam  system

  • Flash steam plants. Water that’s between 300 and 700 degrees Fahrenheit (148 and 371 degrees Celsius) is brought up through a well. Some of the water turns to steam, which drives the turbines. When the steam cools it condenses back into water and is returned to the ground[1].

flashplant


Figure 2 : model of a flash  steam  system

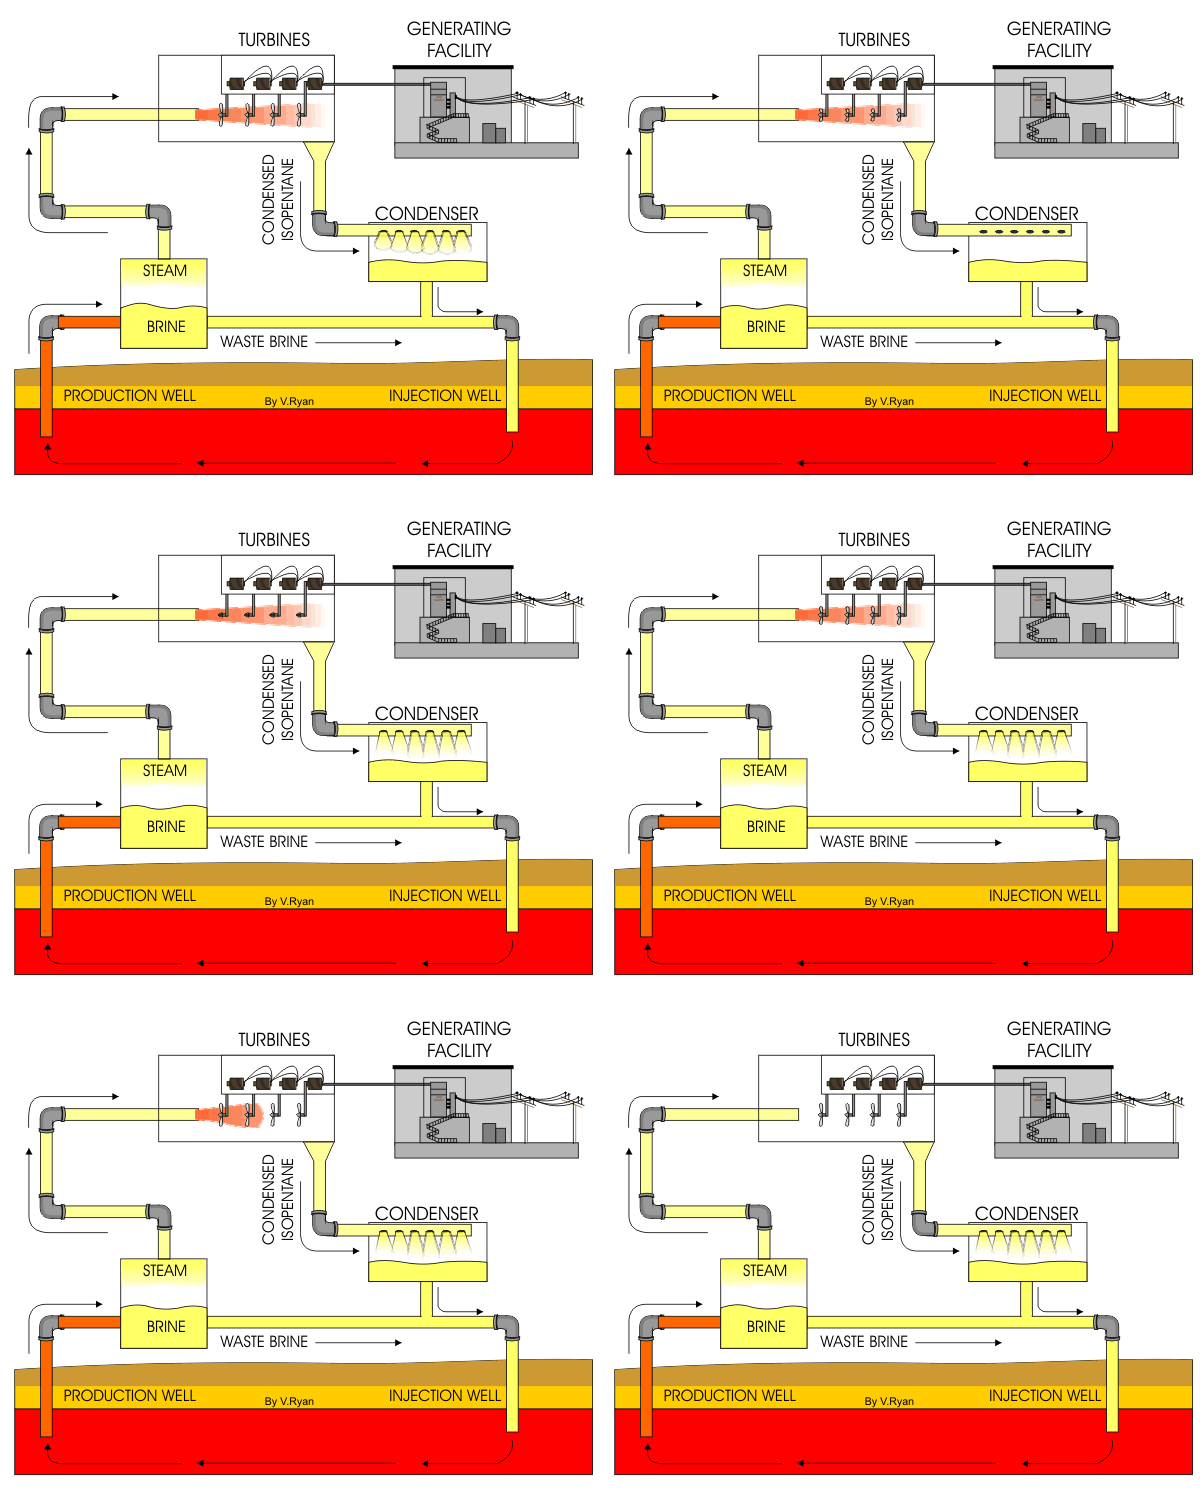
  • Binary cycle plants. Moderately hot geothermal water is passed through a heat exchanger, where its heat is transferred to a liquid (such as isobutene) that boils at a lower temperature than water. When that fluid is heated it turns to steam, which spins the turbines[1].

binaryplant

Figure 3 : model of a Binary cycle system

       Any of these types of power plants make it possible  to have electricity generated  without  needing to import   raw materials. Iceland is a pioneer in the use of geothermal energy for space heating. Geothermal power facilities currently generate  over 25% of the country’s total electricity production [2]Five major geothermal power plants exist in Iceland. In addition, geothermal heating meets the heating and hot water requirements of approximately 87% of all buildings in Iceland.  [4]

The following are the five largest power stations in Iceland[4].

  1. Hellisheiði Power Station (303 MW)

  2. Nesjavellir Geothermal Power Station (120 MW)

  3. Reykjanes Power Station (100 MW)

  4. Svartsengi Power Station (76.5 MW)

  5. Krafla Power Station (60 MW)

All of these are geothermal power plants,and among them  Hellisheiði Power Station is the largest geothermal power station in the world. Each one of there    have a significant contribution on  Iceland’s  power generation . Being able to have a produce energy from a constant natural resource, allows  companies and  countries to  decrease their dependency on fossil fuels , which consequently results in a  positive impact on the environment . Enhanced geothermal systems, have life-cycle global warming emission of approximately 0.2 pounds of carbon dioxide equivalent per kilowatt-hour [5].To put this into context, estimates of life-cycle global warming emissions for natural gas generated electricity are between 0.6 and 2 pounds of carbon dioxide equivalent per kilowatt-hour and estimates for coal-generated electricity are 1.4 and 3.6 pounds of carbon dioxide equivalent per kilowatt-hour [5].

Source

[1] http://science.howstuffworks.com/environmental/energy/geothermal-energy1.htm

[2]  http://www.nea.is/geothermal/

[3] http://www.ucsusa.org/clean_energy/our-energy-choices/renewable-energy/how-geothermal-energy-works.html#.VFJfi74htOR

[4] http://en.wikipedia.org/wiki/Geothermal_power_in_Iceland

[5] http://www.ucsusa.org/clean_energy/our-energy-choices/renewable-energy/environmental-impacts-geothermal-energy.html#.VFODSTTF9L0


Posted in Uncategorized | Leave a comment

Tom talks about radioactivity

     Last week, we had  a special visitor  on our class , Tom Vales. He  introduced us to  radioactivity.  In radioactive processes, particles or electromagnetic radiation are emitted from the nucleus. The most common forms of radiation emitted, have been traditionally classified as alpha particle (α), beta particles (ß), and gamma rays (γ). Elements that are radioactive  are unstable elements; therefore the particles in it will continue to decay until  they have reach stability.All radioactive elements will eventually decay to lead. Alpha particles consists of two protons and neutrons; while  beta particles are   electrons. Gamma rays are the strongest of all and  can penetrate more materials. The picture below  shows a representation of how strong are there types of  radiation:

rays

Image 1: Penetration power of alpha particles, beta particles and gamma rays

       The life expectancy of  these radioactive particles is known as the half life; in other words, its the amount of time that it will take for a particle to decay and reach stability.  Uranium- 238, a common  element in radioactivity, has a half life or  about 4 billion years.  Tom, taught us that even though  Uranium is today mainly used  for nuclear reaction, in the past  it had different purposes.

    People believed hat uranium had healing properties and so radioactive pills where created; the ingestion of these was and still is dangerous. In general  ingestion of Uranium is very dangerous. Other daily used objects contained  uranium as well  such as   fiestaware; this was a set of plates that used uranium on their ingredients to give it  different coloring. Pocket watches and  light poles of the time , also had uranium on  their component since this element will glow in the dark.

        All of the elements that I just mentioned were presented to us  in class by Tom; and in case we didn’t believe what he was saying, he also had a Geiger counter. A Geiger  counter (see picture below) is a device that measures the radioactivity of an object. It  will produce a tone if there is a radioactive element around; the more radioactive the object is the  faster the tone will sound. A constant tone means a very radioactive element and therefore dangerous.  With his own Geiger counter, Tom demonstrated that all the object that he has presented to us were radioactive. The levels of radioactivity that we were exposed were very  low so we had no reason to worry about any  side effects from this presentation.

Geiger_counter_2

Image 2 : Geiger Counter

Posted in Uncategorized | Leave a comment

Power plants ; different methods but same result ; Electricity

    Part of everyone’s daily routine involves the use of electricity; we use it so often that it is easily to forget how interesting and complex is the process that goes behind the generation of electricity. We have previously learned how a generator works, which basically   produces electricity by   rotating a  magnet inside the  a loop of copper wire; the change in the magnetic flux  is what creates the electricity.   Today,  power plants keep using these methods to generate electricity;  they  rotate  what known as the turbine  which contains the magnets.  What differences some power plants from others than is the process used to make that turbine turn. On this blog I will briefly talk  about 3  types power plants: Coal-fired, Natural gas and Nuclear reactors.

    In a  coal- fired plant; coal, as you could’ve guess is  raw material that  is used to  make the turbine rotate . This is how it works[1] :

  1. The coal is pulverized into talcum powder; mixed with hot air and bowl in  the firebox of the boiler.The  coal/air mixture provides the most complete combustion  and maximum heat possible

  2. Highly purified water, pumped through pipes inside the boiler, is turned into steam by the heat. The steam reaches temperatures of up to 1,000 degrees Fahrenheit and pressures up to 3,500 pounds per square inch, and is piped to the turbine.

  3. The enormous pressure of the steam pushing against a series of giant turbine blades turns the turbine shaft. The turbine shaft is connected to the shaft of the generator, where magnets spin within wire coils to produce electricity.

  4. After doing its work in the turbine, the steam is drawn into a condenser, a large chamber in the basement of the power plant. In this important step, millions of gallons of cool water from a nearby source (such as a river or lake) are pumped through a network of tubes running through the condenser. The cool water in the tubes converts the steam back into water that can be used over and over again in the plant.

  5. The cooling water is returned to its source without any contamination, and the steam water is returned to the boiler to repeat the cycle.

    The  following link will  provide you a short    animation of how all the steps from above are  connected.coal_fired_animation

   Because  of the environmental impact , such as the gas emissions  generated  by coal-fired power plants, society have looked to  to alternative ways of generating electricity. Among the new technological developments, natural gas power plants  were created; they are the clean method for electricity generation.

   Initially, wells are drilled into the ground to remove the natural gas. After the natural gas is extracted, it is treated at gas plants to remove impurities such as hydrogen sulfide, helium, carbon dioxide, hydrocarbons, and moisture. Pipelines then transport the natural gas from the gas plants to power plants. Power plants use several methods to convert gas to electricity[2];  The most basic natural gas-fired electric generation consists of a steam generation unit, where fossil fuels are burned in a boiler to heat water and produce steam that then turns a turbine to generate electricity[3]

Figure 1 : Animation of  cycle involved in a  Natural Gas power plant

     Finally, the last  alternative power plant method is the nuclear reactor. This is without  a doubt the most efficient method yet the most delicate and controversial. In general this kind of  method generated high levels of  heat that makes water to  become steam which, consequently, drives the turbine and generates electricity .  This is how it works :

    In the reactor core the Uranium ( U-235 ) isotope fissions or splits, producing a lot of heat in a continuous process called a chain reaction.  The process depends on the presence of a moderator such as water or graphite, to control  this process. The moderator slows down the neutrons produced by fission of the uranium nuclei so that they go on to produce more fissions.The reactor core sits inside a steel pressure vessel, so that water around it remains liquid even at the operating temperature of over 320°C.  Steam is formed either above the reactor core or in separate pressure vessels, and this drives the turbine to produce electricity.  The steam is then condensed and the water recycled.[4]


    There are two main  designs for water  reactor : Pressurized water reactor (PWR) or Boiling water reactor (BWR). The most popular is the PWR which has water in its primary cooling/heat transfer circuit and generated steam in a secondary chamber . The BWR is the least popular style; it creates steam in the primary circuit above the reactor. Below you  can see an animation for both of this  styles; notice how the BWR has one  chamber less that the PWR structure:

Figure 2 : Animation of a PWR (Pressurized water reactor)

Figure 3 : Animation of a BWR (Boiling water reactor)

    From these 3 methods it easy to guess that the cheapest  method to generate electricity is the coal-fired method, and the most expensive and dangerous is the Nuclear reactor. But even though coal is the cheapest  and responsible  for provideo about 46 % of consumed electricity in the United states [1], it also  is the dirtiest when it comes to air pollution  [3]. Natural gas , on the other hand , is one of the leading  clean energy sources for distributed generation[3]. While Nuclear energy  supplies around 12 % of the world’s electricity [4] .

Sources :

[1] http://www.duke-energy.com/about-energy/generating-electricity/coal-fired-how.asp

[2] http://www.epa.gov/cleanenergy/energy-and-you/affect/natural-gas.html

[3] http://naturalgas.org/overview/uses-electrical/

[4]http://www.world-nuclear.org/nuclear-basics/how-does-a-nuclear-reactor-make-electricity-/

Posted in Uncategorized | Leave a comment

A tour around MIT’s Nuclear Reactor

    I have lived in Boston for almost 4 years and I still find myself visiting and discovering  new places. Last week I had the great opportunity to go,with all my classmates, to a nuclear reactor here in Boston, inside the MIT campus (see picture below). I have to confess  that I  didn’t realize how significant it was to have this opportunity. It was until the moment that we were checking ourselves in and we were receiving some basic safety instructions that I realized that we will be exposed to some lower radiation levels. Each of us were handed in a  small device that we had to carry with us all time throughout the tour. The initial value of the  device was recorded; and  after  the tour was over  another final measurement  was taken; ideally the difference between final and initial  values would be  very close or equal to zero. Also before exiting the reactor  we re tested  with a special machine that   detects  any tarce of radioactive dust in our shoes or  hands and arms.

     You may already know that nuclear reactors are another way of generating electricity; in case of the MIT – Nuclear reactor, this is not the case; this reactor is not used to generate electricity and contribute to the grid. This reactor is used for experimental purposes; which means that the reactor does not have to be kept on critical state (you have enough uranium so that I can produce heat by itself) for long periods of time but only for the time that is necessary for experimentation. This reactor receives samples and experiments to perform for multiple research and health institutions such as Mass General Hospital.

     During our tour session we learned a  great amount of things. For example. The MIT reactor “ is a heavy-water reflected, light-water cooled and moderated nuclear reactor that utilizes flat, plate-type, finned, aluminum-clad fuel elements” [1]. One of the main aspects that caught my attention was the water that gets used to heat and cool down the reactor; lucky for us this water is reused and controlled so it doesn’t get spilled or gets in contact with the  outside. In fact, this facility is designed in a way that in case of high level of radiation or any accident, nothing will be able to get in contact with  the outside.  And how is this possible ?  The reactor is contained inside an close air-locked concrete structure. In order to enter to the reactor you will have to go through an  2 door air  vacuum  hall  that  will  lower  the pressure level and  make sure the  inside and outside of the reactor doesn’t get contaminated.

    Inside the dome, where the reactor is located; we were able to observe different  interesting things. Personally, the most interesting one was the crane located in the ceiling. This crane  has 360 degrees access and it is used to open the reactor, move heavy object such as the tanks of gas or any other  substances. The second most interesting point was the control room (see picture below). This room is where the magic happens and where  every single step is being carefully monitored. It is here were it possible to determine if the reactor has reached its critical state.  This room also counts with non  digital devices; meaning that in case of a power failure  while the reactor was being used , these devices  will continue to show the readings  since they are not operated  by  a computer.

         Finally, we also learned about some radioactive experiments that have been going on. One of the most significant one is treatment of a cancerogenous tissue  by  inserting radioactive cells that will attack the infected cells. This kind of treatment can only be applied to specific areas since the  radioactive cells have a low half-life and therefore they will not stay radioactive for a long period of time.

     I am glad to say that upon exiting the reactor  and returning the device that was provided to me,  the difference between the final and initial measurements was zero .

 Sources

[1]http://web.mit.edu/nrl/www/reactor/reactor.htm

Posted in Uncategorized | 1 Comment

The Stirling Engine and Peltier device are still among us

   Have you ever wondered what other methods  exist   besides the  generator that we know and we have previously discussed.  What were  the “other “ ways of making an engine work? If so,then you are in luck, because on this blogs I will talk about two  devices that are not so common, yet they will make an engine run or generate electricity by just taking the temperature difference. The first situation is related to the stirling engine; the second one  refers to the Peltier device.

   The Stirling engine was invented by Robert Stirling in 1816. This engine is  very different from the internal combustion engine that occurs on a regular car[1]. This engine uses what is known as the Stirling cycle; this is how it work:

  1. Heat, from an external source, is added to the gas inside the heated cylinder, causing pressure to build. This pressure causes the piston to move down.

  2. The right piston moves up while the right piston moves down. This pushes the hot gas in the cooled cylinder, which quickly cools the gas to the temperature of the cooling source , lowering its pressure.

  3. The piston in the cooled cylinder  starts to compress the gas. Heat generated by this compression is removed by the cooling source.

  4. The right piston  moves  up while the left piston moved down. This forces the gas into the heated cylinder, where it quickly  heats  up , building pressure and restarting the  cycle.

 You can see a dynamic representation of  these steps below :

Stirling Engine Animation

   Even though this type of engine seems to be really useful its dependency on an external heat source make it less efficient. Depending on an another heat source means that the engine will require some time to warm up before it can produce useful power [1]. It also means that the engine can not change its power quickly. [1] However,  we can still find some uses for this type of engine  such as [2]:

  1. Heats homes in The Netherlands with 50-75 hp engine.

  2. Provides basic power to remote African villages by burning wood (1-5 hp Van Arsdell-Howard University engine).

  3. Power oceanographic exploration submarine for Jacques Costeau, the Saga, so his team can quietly sneak up on the fishies and the whalies.

  4. Power the quietest military submarines in the world—a 1300 hp Stirling engine drives subs in the Swedish and Danish fleets (but not in the American fleet).

   On the other hand, we have another very interesting device that is capable of   taking the electricity as an input and convert it into two  different temperatures. This device is known as the Peltier device (see picture below) and its based on the Peltier effect. This effect is the cooling of one junction (or side) and the heating of the other when electric current is maintained in a circuit of materials consisting of two dissimilar conductors; the effect is even stronger in circuits containing dissimilar semiconductors [3]. “A typical peltier heat pump device involves multiple junctions in series, through which a current is driven . Some of the junctions lose heat due to the Peltier effect, while others  gain heat”[4].

 Real Life Peltier Device

 Image 1: Real life Peltier Device

Structure and Components of a Peltier Device

 Image 2 : Inside structure and components of a Peltier Device

   Today, Thermoelectric cooling uses the Peltier effect to create a heat flux between the junction of two different types of materials. Among some different  applications for thermoelectric cooling we have:  Calorimetry, Infrared detectors, night vision equipments , Water and Beverage Coolers ,among others.[5]

After covering the basics for the stirling  engine and the peltier devices; I believe it its fair to say that even though they are not as broadly used; they still play an important role in people’s lives.

References:

[1] http://auto.howstuffworks.com/stirling-engine.htm

[2] http://www.discoverthis.com/article-stirling-engine-top10.html

[3] http://www.britannica.com/EBchecked/topic/449424/Peltier-effect

[4] http://en.wikipedia.org/wiki/Peltier_effect#Peltier_effect

[5] https://www.ferrotec.com/technology/thermoelectric/thermalRef03

Posted in Uncategorized | Leave a comment