The solar energy lab that we worked on in class tested the solar energy through our robot We would test the solar energy from different lengths of light and then used different colors to see the how the solar energy changed.
The first picture is of Evan using the light at the farthest distance to determine the solar energy from 40cm’s. The second is a picture of determining the solar energy using different colors.
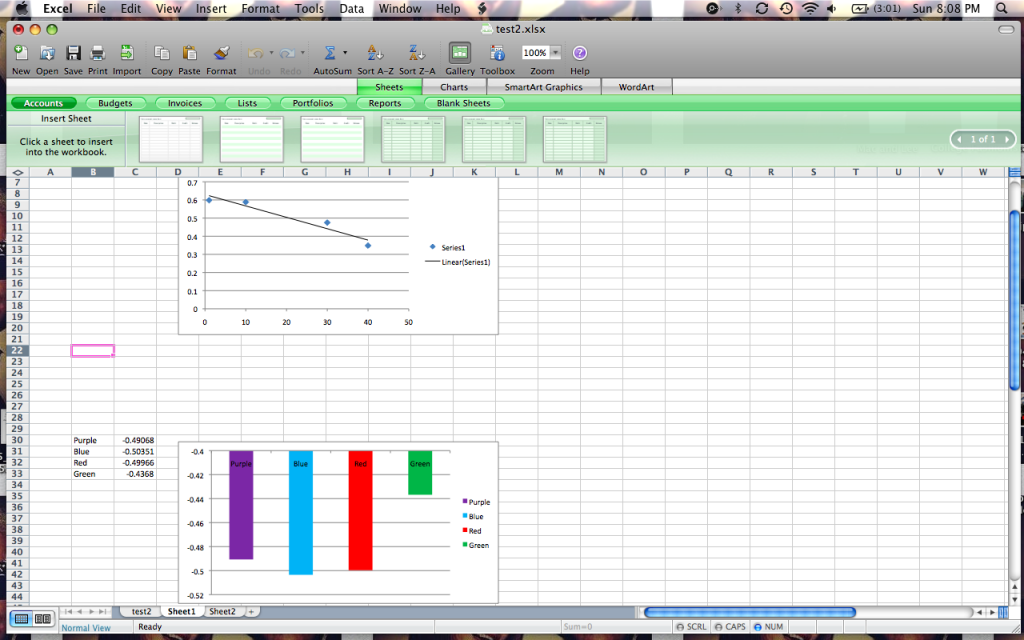
Below are our results:
Our data is all negative numbers because of how the wires were set up with the robot. But, all that was needed to be done was to change the numbers form negative to positive.
With the distance, when the distance got farther away the solar energy got smaller. For example when the light was at 1cm the solar energy was 0.56638, and at 40 cm which was the farthest distance we used the solar energy was at 0.348. The reason for this was because the farther the light was the less solar energy it could give off.
The colors were the most interesting conclusion while keeping the same distance of the light at 10cm. At the averages, purple is 0.49068, blue is 0.50351, red is 0.49966, and finally green is 0.4368. It is obvious that green’s average has the lowest solar energy, and blue is the highest.


I liked how you showed the pictures during the lab! Visiual charts are always great for learning