Heat, Oil and Color

Last Monday we conducted two experiments. The first was used to measure the relative heat of oil and water using the equation H = Cp*m*∆T, which determines the specific heat capacity, or how much energy is needed to raise the temperature of the substance one degree Celsius. The equation breaks down as this:

ΔE: Amount of energy absorbed (J)
m: mass of a liquid (g)
c: Heat capacity: (J/g-K)
ΔT : change in temperature (K)
r: mass density (g/ml)

Before the experiment we found the mass density of oil (.92) and water (1.0) as well as the specific heat of oil (2.0 J) and water (4.184 J).

For the actual experiment we added 80ml of oil and water to their own beakers and placed them on a hot plate, at which point we put in a temperature probe connected to the computer to record the data. Because of some issues with the hot plate where it was not heating as much as it should have the liquids did not change temperature as much as was needed, and according to the data, our water had a higher temperature than the cooking oil. Given the properties of oil and water and how oil heats up faster, we can only determine that this was an error.

After the data was recorded, we calculated the difference of temperature from the start of the experiment to the end, and received a difference of .80978 degrees Celsius for the oil and .201135 degrees Celsius for the water.

We then calculated it further, which required the mass density and specific heat, and received an energy calculation of 67.39621 J for water and 119.1996 J for oil. The difference is 55.52473%, which demonstrates that oil needs more energy than water to be heated one degree. This however makes no sense considering that oil is less dense than water and therefore needs less energy to be heated, once again showing faulty data.

The second experiment focused on solar energy and what colors of light produce the most energy. For this we used a solar panel and sensor and a flashlight, as well as colored pieces of film that we held over the light. We initially experimented with the height of the flashlight to see how the distance between the sensor and the light affected the amount of energy produced. Predictably, with the height we determined that the further away the light was from the sensor, the less voltage was produced.

We used six colors total: teal, orange, pink, indigo, green and white (no filter) held at a height of zero inches from the sensor. By averaging the voltage produced we determined that orange had the highest amount of energy, while unfiltered light had the least.

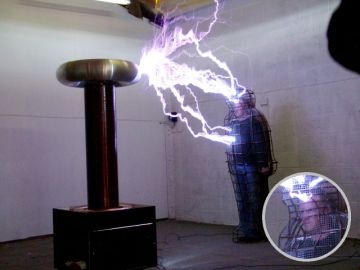
Mr. Vale’s Tesla coils


Our demonstration was not quite this dramatic, but was close

In class we had an electrifying demonstration of Tesla coils courtesy of Mr. Vale, and I think it’s safe to say that it startled just about everyone with how much noise it made. He was able to safely touch the spark on top using a wooden rod without getting shocked, and a few brave volunteers tried the same thing.

Nikola Tesla was a revolutionary inventor who imagine every home having its own Tesla coil, which he invented in 1891, in order to generate electricity for the home. Mr. Vale demonstrated that by holding bulbs and light cylinders near the coil he can make them light up, and Tesla hoped to use this to power entire houses without the need for wires. Unfortunately the coils are not efficient enough and are highly dangerous, but in terms of wireless transmission of energy he was ahead of his time. Tesla was arch rivals with Thomas Edison, and both men worked with electricity in both AC (alternating current) and DC (direct current) forms, though only Edison’s technology caught on in the mainstream.

It’s too bad that the Tesla coil couldn’t be developed, because not having to use wires to power electricity would revolutionize how and where we could use them.

Shake It!

We continued our experiments using the Lego Mindstorm and NXT robotics set, and this time we used a flashlight with magnets inside it to produce energy through shaking, and then measure the output of energy through the robot.

The flashlight has several magnets inside of it, and when shaken the motion produces energy that is then sent to a sensor that measure the output. We did this several times for 30 seconds each at different paces, fast, slow, and just for fun three shakes in a row followed by a pause.

In the first round, Jason counted 85 shakes which came out to 153.4535 volts. Sarah’s trial had a count of 32 slow shakes which was came out to 53.09822 volts. Lastly, my trial had 29 staggered shakes (three shakes, then a moment of rest continued for 30 seconds) which came out to 36.59198 volts.

We  put this data into a graph in Excel and included a linear trendline. The data shows The more shakes,the more energy it produces, so for more energy the flashlight must be shaken longer and more frequently.

Fusion and Foil: MIT’s Alcator C-Mod tokamak

Last Monday we took a trip to the MIT Alcator C-Mod tokamak, where the MIT scientists and students are trying to make nuclear fusion as a source of energy a reality.

a box of Reynold's wrap a few feet away on a stool. They go through a lot of it.
The Alcator C-Mod tokamak. Not visible: a box of Reynold's tin foil on a nearby stool. They go through a lot of it.

The Alcator itself is an impressive machine, and one question I had to ask was what would happen if there was an all out, complete and utter failure of the equipment. Mostly I was curious if there would be a huge mushroom cloud over Cambridge. I was informed, however, that the worst that would happen would be that the machine itself would be destroyed with no ill effects on the surrounding area. This was somewhat surprising because the phrase “nuclear energy” in the wake of Chernobyl tends to invoke fear, but as our visit showed the Alcator is a far different beast.

The basic idea of a nuclear fusion reactor is to mimic the process that naturally occurs in the sun. One way or another all of the energy on our planet comes from the sun, either directly from the sun’s radiation and harvested using solar cells or in more roundabout ways such as through wind power. Even the oil and gas we use is the sun’s energy several steps removed, and oil in particular is the fossilized remains of living creatures that consumed plants that got their energy from the sun.

The fusion reactor works by heating gas to the point that it becomes ionized and turns into plasma, a fourth state of matter. Because plasma is so hot the particles within it are moving extremely fast and contain an incredible amount of energy, and this is why it is so powerful. Plasma makes up 99% of the visible universe, including nebulas and the interior of the sun. While plasma is common in our everyday lives -TVs and electric lights, just to name two – in order to create plasma that can be used to generate power the reactor’s inside rises to millions of degrees, to the point that it no longer matters whether you’re measuring the temperature in Celsius or Fahrenheit, it’s just really really hot. Our guide summed up the tokamak by calling it “the world’s most complex teakettle.”

The amount of energy that can be produced by a fusion reactor is millions of times the number that fossil fuels can produce, and unlike nuclear fission reactors the waste produced by fusion reactors is on par with the medical waste that we commonly deal with and can dispose of safely. Additionally, the fuel source for fusion reactors, hydrogen and deuterium, are incredibly common on Earth, so there is no danger of running out of them any time in the next billion years or so.

The one catch when it comes to using fusion to produce energy is that it doesn’t work – yet. It has come a long way from when it was invented over 50 years ago, but even the highly advanced Alcator is only used in two second bursts and is not yet hooked up to the grid. There is an international team being assembled to work on the International Thermonuclear Experimental Reactor, or ITER, which will the most advanced machine of its kind when it is finished in the next decade or so. So while fusion energy is not yet here it is being worked on, and when and if they finally succeed it has the potential to solve almost all of the world’s energy problems for the next billion years or so.

Physics tests and Energy with Robots

In class, we tested how adding and subtracting weights would make a difference in the amount of power that was used by the engines of the NXT robots to demonstrate several principles of energy usage and physics. Below are the results.

The first test was to show the relationship between mass, the total weight of the object being moved, and how it affects the amount of acceleration, or the increase in speed of the object as it travels. The higher the mass you are trying to move, the slower the acceleration will be since it takes more energy to move the object the same distance against the force of gravity, while the less mass you have will make the acceleration faster because it has an easier time fighting gravity.

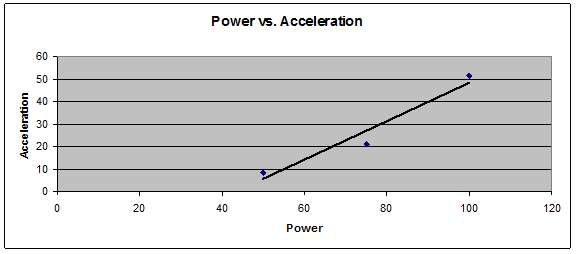
The next test was the power versus the acceleration. Power is defined as the amount of work done over the amount of time it takes to accomplish the defined task, in this case measured in power level of the motor, which were 50%, 75% and 100% in each trial. An increase in the power of the motor dramatically increases the amount of acceleration, even when done for the same amount of mass each time, in this case, .25kg. The more power, the more acceleration, because more energy is being put into moving the same amount of mass.

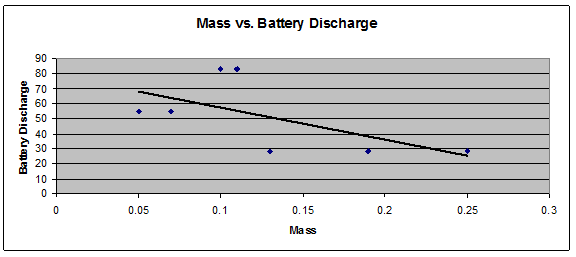
The next test was to measure the amount of energy discharged by the battery versus the mass being moved. Despite some outliers in our data, which were possibly caused by problems with the equipment, the opposite seems to be true of the mass versus the total energy discharge of the battery, where the more mass you have means that the battery puts out less energy to move it. This does not make sense when you look at the physics of it, where it takes more energy to move more mass, so it’s best to discard the data from this test as faulty.

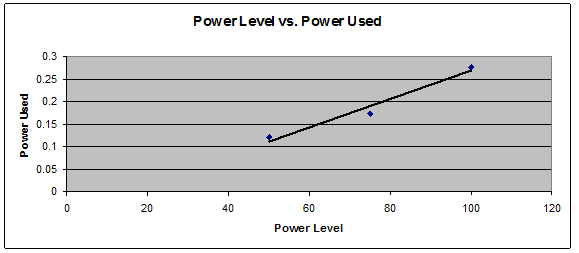
The last test was the amount of power used by the engine versus the power level with a consistent mass of .25kg, and again the relationship is positively correlated. The higher the power level of the motor the more power is used, because the engine is being told it needs to do more work even if the mass remains the same.

These tests shows that it takes more energy to move larger masses, and that acceleration is inversely tied to mass, and the higher the power level the higher the amount of energy consumed. With the exception of the one faulty test this data is in line with the laws of physics and explains why our greatly increased use of energy over the past century has increased our global energy demands, since we want to do more at the same time, and without energy saving technologies and new ways of creating energy we will very quickly deplete our supply.

Demand Response

Demand response is a method of maintaining a balance between the amount of power produced and used, and works mainly to prevent shortages of power during critical times.

This is referred to as Emergency Demand Response, and is not used very often. During times of extreme weather and temperature the electric grid is often strained, and the result of too much demand can be “rolling blackouts” where certain parts of the grid are intentionally shut down by the power company to prevent a system wide meltdown. This was the case in Texas in early February of 2011, when a brutal winter storm put extra strain on the grid due to the shutdown of several generators due to the extreme weather. During the storm real-time power prices peaked around $3,000/MWh during some intervals Wednesday afternoon, 30 times the normal level of $100/MWh[1].

A newer system of demand response that is being implemented by an increasing number of electric companies is what is referred to as a Smart Grid, which uses digital systems to communicate in real time to different nodes and match the demand quickly[2]. This allows producers to “forecast” demand and adjust in real time, and it’s predicted many more companies will adopt this technology as “plug in” electric cars like the Chevy Volt become available and more strain is put on existing systems and technologies[3].

Another important aspect of demand response is Economic Demand Response, and it affects how much an individual pays for their electricity. However, the amount of an electric bill delivered to the consumer does not reflect the actual rate of demand and cost of delivering electricity, which constantly fluctuates, but rather a rate calculated for the entire year, and the electric company absorbs the cost of turning on more expensive generators during peak demand times. As a result many electric companies provide incentives for their customers to use electricity during the off-peak hours as opposed to on-peak hours, when it is less expensive to produce the electricity helps make up the cost difference[4].

Economic Demand Response makes electricity cheaper, and many developing countries are now trying to acquire this technology to help fuel economic growth. In the United States there is also an increasing emphasis on using energy efficient technologies, with Federal Tax Credits available for many new appliances with Energy Star certification. The Energy Star program has been hugely successful, and saved enough energy in 2009 to avoid greenhouse gas emissions equivalent to those from 30 million cars, and saving nearly $17 billion on customer’s utility bills[5].


[1] ERCOT blackouts came about from a trio of events as Texas struggles to cope with brutal winter storm
[2] How Smart Is The Smart Grid?
[3] On the impact of SmartGrid metering infrastructure on load forecasting
[4] What Is Demand Response?
[5] About Energy Star

どうもありがとう Mr. Roboto

This week and last we focused on building and programming the NXT robots to do simple tasks and knowledge of radius, diameter and circumference to calculate how far they traveled in centimeters.

The initial building of the robots proved to be somewhat frustrating for me because of the number of small parts involved, but after some initial difficultly finding the right sized pieces I got it up and running. Our first task was to make them go forward, back, and stop at varying speeds through the controls, as well as download the programs into the robots so they could move independently of the USB cables. We also had the option to program them to either play notes or a song, and program the duration of each individual command. We could also change the speed at which each individual wheel rotated, allowing them to go in a circle.

Though interesting, I found the computer interface to be somewhat hard to use and had to ask for assistance several times, and when I did get it working it didn’t always go as planned. More than once I thought my robot would only go forward a very short distance but wound up chasing it across the room until it either stopped or I picked it up, and I’m not sure I completely understood that aspect of the program. I also barely managed to catch my robot at one point because it overshot the edge of the desk, but aside from some minor repair work on the front wheel it was fine.

Later, when our task was to calculate the distance traveled by the wheels based on the diameter and simple math to determine the circumference. My calculations proved to be very close to the actual distance it traveled, though off by a few fractions of a centimeter. This was most likely due to human error or related to the surface the NXT was on.

After playing with the robots for a while Mr. Vale gave a presentation on several types of simple motors, most of which have been around for over a century. The Sterling Engine was first invented in 1816 as a substitute for the steam engine, and works due to a temperature differential of 30 degrees between the air and the water below that causes the fan to spin. This type of engine is used to pump water in areas that do not have electricity, and have a 40% efficiency.

A Peltier Device works using two dissimilar metals where one side is heated and the other is cooled, creating electricity at the junction. These devices are commonly used to cool drinks or make fans that cool the insides of computers.

A BiC lighter uses a small piece of quartz inside to create a spark using the piezoelectric effect, which is the result of pressure applied to the quartz. This technology has been around since 1880, and is most commonly used in lighters and in lighters for gas stoves.

Finally, a Mondiccino motor is a small motor that uses magnets that cause the center shaft to float and light to generate a charge from several solar cells on the shaft. While cool to look at it does not have much practical application, but is frequently made by hobbyists from kits, including ones Mr. Vale sells.

The Aftermath of the BP Oil Spill

On April 20th, 2010, the Deepwater Horizon oil rig exploded and set off the largest oil spill in US history, and nearly a year later the full impact of the estimated 4.9 million barrels of crude oil that spilled into the ocean are still being discovered.[1]

Besides the immediate effects on wildlife in the wake of an oil spill, scientists are still discovering just how much damage the oil will do to the ocean ecosystem as a whole, particularly the effects of gases like methane on oxygen levels in the water, which in turn affects how quickly microbes are able to break down the oil. It’s already known that runoff from commercial fertilizers can create “dead zones” of low oxygen, which can affect marine life for decades to come. So far scientists have not found any areas of low oxygen that are at levels unable to support marine life, but the oil presents another danger in that it creates complex chains of molecules that are much harder to break down, and can even cause bacteria to mutate.

However, mother nature has shown versatility during the disaster, particularly when it comes to that methane gas. Scientists estimated that it would take the better part of a year for the methane to disappear, but to their surprise 5 months in the methane was almost completely gone thanks to increased bacteria count in the water. This is particularly important because increased methane gas in the atmosphere is thought to contribute to global warming, but the planet’s own system of regulation has so far been able to deal with the methane from the spill on its own. Another possibility is that the bacteria may in fact adapt in the wake of the spill to be more efficient the next time there is a massive spill, though it will hopefully not come to that. [2]

On the human side, inventive scientists have taken the robots originally used to dig the oil well that caused the disaster to both plug it and study the after effects. These Remotely Operated Vehicles, or ROVs for short, worked around the clock to choke off the stream of oil and eventually plug the leaky well under the remote control of a technician, and the engineers of Oceaneering, the operators of the ROVs, had to invent tools virtually overnight to combat the spill and measure how much oil was leaking out at any given time.

Additional AUVs, or autonomous underwater vehicles, also worked to monitor the plume of oil as it spread and allow the U.S. Naval Oceanographic Office to monitor the location of the spill in real time and react proactively to landfall before it even occurred. Some robots were even able to “think” in a limited capacity and change their behavior based on the amount of light filtering through the water to collect samples of denser material to analyze. [3]

In the wake of the spill and looking forward to the future, it’s likely more rigs liked those used in the aftermath of the spill will be used before accidents happen in order to pick the best drilling sites, and hopefully prevent more spills of this scale.


[1] Bourne, Joel K. Jr. Why the Gulf Oil Spill Isn’t Going Away. National Geographic News, September 15, 2010.

[2] Handwerk, Brian. Gulf Oil Surprise: Methane Almost Gone. National Geographic News, January 6, 2011

[3] Bourne, Joel K. Jr. Robots of the Gulf Spill: Fishlike Subs, Smart Torpedoes. National Geographic News, October 26, 2010