Category Archives: Uncategorized

Geothermal Energy in Iceland

Over past few years, generating electricity and heat with geothermal energy has increased significantly in Iceland. Geothermal power facilities currently generate 25% of the country’s total electricity production. Iceland has come a long way since the 20th century when they were one of Europe’s poorest countries. During the 20th century, Iceland was dependent on peat and imported coal for its energy, to a country with high living standards. In 2011, about 84% of Iceland’s primary energy use came from renewable resources; 66% of that was from geothermal.

Below is a Geothermal power plant in Reykjavik, Iceland. It is using their underground reservoirs of steam and hot water to generate electricity and to heat and cool buildings directly.

geothermal-plant-reykjavik_6387_600x450

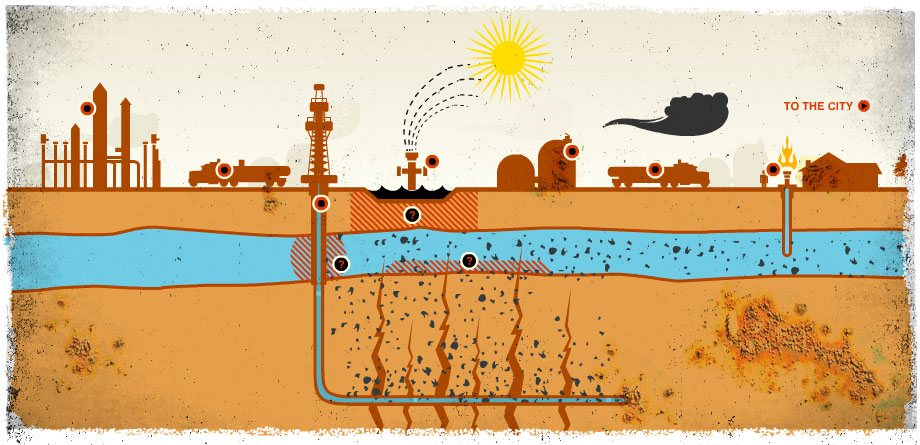
So what exactly is geothermal energy? Geothermal energy is simply power derived from the Earth’s internal heat. This thermal energy is contained in the rock and fluids beneath Earth’s crust. It can be found from fallow ground to several miles below the surface, and even farther down to the hot molten rock (magma). These underground reservoirs of steam and hot water can be tapped to generate electricity to heat and cool buildings. Geothermal water from deeper in the Earth can be used directly for heating homes and offices or even for growing plants in greenhouses. Some cities pipe geothermal hot water under roads and sidewalks to melt snow.

To produce geothermal-generated electricity, wells are drilled a mile (or more) deep into underground reservoirs to tap steam and hot water that drive turbines linked to electricity generators. The three types of geothermal power plants are dry steam, flash, and binary. Dry steam is the oldest of the geothermal technologies which takes steam out of fractures in the ground and uses it to directly drive a turbine. Flash power plants pull deep, high-pressure hot water into cooler, low-pressure water. The steam that results from this process is used to drive the turbine. And lastly, in binary plants, the hot water is passed by a secondary fluid to run to vapor, which then drives a turbine. Most geothermal power plants in the future will be binary plants.

Geothermal energy can be extracted without burning a fossil fuel such as coal, gas, or oil. Geothermal fields produce only about 1/6 or the carbon dioxide that a relatively clean natural-gas fueled power plant produces. Binary plants release essentially no emissions. Unlike solar or wind energy, geothermal energy is always available no matter the condition. It is also relatively inexpensive – saving as much as 80% over fossil fuels. The main concern of geothermal energy is the release of hydrogen sulfide, a gas that smells like rotten egg at low concentrations. Another concern is the disposal of some geothermal fluids, which may contain low levels or toxic materials.

Iceland uses geothermal energy to heat many of the buildings and even swimming pools. Iceland has at least 25 active volcanoes and hot springs and geysers. Iceland’s geology is an advantage for geothermal energy production. Iceland is one of the most geothermal active place on this planet.

Below is a graph of the generation of electricity by geothermal energy in Iceland from 1972 through 2012

Screen Shot 2014-10-15 at 11.29.50 AM

Iceland is well know in being a world leader of geothermal district heating. After WWII, Orkustofnun carried out research and development, which has lead to the use of geothermal resources for heating of households. Today, about 9 in 10 households are heated with geothermal energy. Space heating is the largest component in the direct use of geothermal energy in Iceland. Below is a breakdown of the utilization of geothermal energy for 2013.


Screen Shot 2014-10-15 at 12.00.56 PM

As I mentioned above, Orkustofnun’s research and development led to the use of geothermal resources for heating in households in Iceland. This achievement has enabled Iceland to import less fuel, and resulted in lower heating prices. The relative share of energy resources used to heat households has changed since 1970. the proportion of the population using geothermal energy is still increasing and could rise from 89% to 92% in the long run. The share of oil for heating continues to decrease and at about 1% now. The share of electricity heating is about 10% right now. Below is a graph showing this information.

Screen Shot 2014-10-15 at 12.07.03 PM

Below I have included a Youtube video about Geothermal energy in Iceland. This video goes into detail about Iceland’s volcanic activity and how this makes Iceland an area where geothermal energy is possible.

Iceland – Geothermal

Resources:

http://www.nea.is/geothermal/

http://environment.nationalgeographic.com/environment/global-warming/geothermal-profile/

http://waterfire.fas.is/GeothermalEnergy/GeothermalEnergy.php

Solar Energy Worldwide

The Sun’s rays are able to supply an abundant amount of solar energy which can be converted into electricity and heat. Solar energy is free, and there is no production of greenhouse emissions, acid rain, or smog in producing solar energy. The cost of solar energy technology has been decreasing over the years as our technologies mature globally. Before I get into how solar energy has progressed in various countries, I want to discuss the different types of solor energy technologies. These include passive solar design, solar thermal design, and solar voltaic.

Solar energy can be obtained through passive solar designs in buildings. Passive solar buildings maximize absorption of sunlight through south-facing windows and use dark-colored, dense materials in the building to act as a thermal mass. These buildings store the sunlight as solar heat. Below is a diagram of how this system works.

sharp-passive-solar-basics

Solar thermal systems collect solar radiation to heat air or water for domestic, commercial, or industrial use. The collector for solar hot water is typically a box structure that has a glass top with a black absorber underneath it to circulate water. As the water is pumped through the collector, it is warmed and then circulated through a large insulated tank inside the building. Below is a typical thermal panel.

solar thermal

A solar photovoltaic (PV) system is an array of cells containing semiconductor materials that convert solar radiation into direct current electricity. These systems are non-polluting and help reduce electricity bills. Although these systems can be more expensive than conventional power sources, they can be a lower-cost electricity source in locations that are not served by the electrical grid. Below is a diagram of how solar voltaic panels work.

PV-Diagram

Here in Massachusetts, many people have the misconception that photovoltaic solar systems do not work because of New England’s weather conditions. According to the report Renewable Energy and Energy Efficiency Potential at State Owned Facilities and Lands, the Commonwealth’s annual average of insolation is approximately 4 kWh/m^2 per day. That is sufficient for PV systems to generate energy. PV modules are relatively unaffected by inclement weather and operate better in colder weather. Snow accumulation is not a problem because the panels are installed at an angle necessary to catch the sun’s rays (this also helps prevent snow collection on the PV module. If snow does collect it melts quickly). Experts on solar energy agree that MA is an excellent location to use solar photovoltaic systems.

 Now that I’ve discussed the different systems of collecting solar energy, I will get into how solar energy is becoming a worldwide renewable energy source.

Over the past few years, there has been a tremendous growth in the United States solar industry which is helping to pave the way to a cleaner, more sustainable energy future. The cost of a solar energy system has dropped over the past few years which is helping to give more American families and businesses access to affordable, clean energy. This past year, the United states hit a record breaking achievement in solar energy; the Ivanpah Solar Electric Generating System. This system in southern California was named the largest concentrating solar power (CSP) plant in the world on a massive scale. The facility has the capacity to generate 392 megawatts of clean electricity (that’s enough to power 94,400 average US homes). The successful completion of Ivanpah reflects America’s growing leadership in the global solar industry. President Obama stated during his State of the Union address that more Americans are relying on solar energy to power their homes and businesses than ever before. In the last 5 years, we have doubled the amount of energy we produce from solar energy. Below is a picture of the Ivanpah towers along with a diagram of how it works.

ivanpah2

Ivanpah uses an innovative power-tower technology using a field of mirrors called heliostats to track the sun and focus sunlight onto boilers that sit on top of 459- foot tall towers. When sunlight hits the boiler, it heats the water inside to create superheated steam used to spin an electricity-generating turbine.

 towercard-55a1ecff-29b7-4d62-b2d4-ef834d921179

Apart from Ivanpah, through LPO’s section 1705 program, there are now 5 utility-scale CSP plants operating or under construction in the SU that will generate enough clean electricity to power 252,000 homes.

Solar energy is not only powering homes in the US, it is powering corporate America. Corporate giants including Apple, Google, and Wal-Mart are turning to the sun to power stores, data centers and other facilities. In May of 2014 at a Wal-Mart store in California, President Obama cited Wal-Mart’s commitment to double the number of solar energy projects at its stores, Sam’s Clubs, and distribution centers nationwide by 2020. Obama announced 300-plus other private and public efforts, including new solar panels on the White House, to boost energy efficiency and renewable power.

Apple, pledged to power all facilities with green energy. The California-based company said its energy-intensive data centers already use 100% renewable power. Google announced a $1 million prize to develop the next generation of power inverters to bring solar to more US homes. Ikea also said it will use renewable energy (when feasible) to all its US stores. Other companies such as Kohl’s, Staples, and Whole Foods, have already committed to acquiring 100% of their power from renewable power either through on-site generation or energy credits.

Besides the United States, Germany is making efforts to increase the use of renewable solar energy. The cost of solar power plus battery storage is about to dip below the average electricity bill in Germany. According to a report by RenewEconomy, it was concluded that power generation units with a capacity of 10 megawatts or less will make up 50% of the country’s power by 2025 (up from 30% now). Germany has some of the highest residential electricity prices, which encourages the switch to renewables. To promote renewables, many German homes are leaving the grid for solar energy. The country is in a 20-year contract to wind and solar suppliers – their own residential prices may soon drop.

The solar energy market in China is expected to witness rapid growth as well. With the country facing a continuous shortfall in the supply of conventional sources to meet the increasing demand for energy in recent years, the focus is shifting from conventional to renewable energy sources. The government of China is actively involved in the development of the renewable energy sector. Chinese Government has launched a distributed solar photovoltaic and rooftop solar photovoltaic programs. China is also focusing on the construction of solar power plants with the view to sustain its position in the highly competitive market. Photovoltaic technology has grown over the past decade in China and is on the way to become a major source of power generation.

Sources:

http://www.mass.gov/eea/energy-utilities-clean-tech/renewable-energy/solar/about-solar-energy.html

http://energy.gov/articles/celebrating-completion-worlds-largest-concentrating-solar-power-plant

http://www.usatoday.com/story/money/business/2014/05/10/solar-embraced-by-corporate-us/8895671/

http://solarenergy.net/News/germany-solar-storage-solar-panels/

http://etvfutures.com/solar-energy-in-china-2014-new-research-report-available-at-fast-market-research-9352/

Solar Cell Lab

During this experiment, we were given a solar cell in order to understand the relationship between light intensity and the voltage output of the solar cell. We also to explore the relationship between the wavelength of light and the voltage output of the solar cell. Before beginning the experiment, my partner Bryan and I made two hypothesizes. First, we predicted that as we increased the distance between the flash light and the solar cell, then the voltage output would decrease. We also made a prediction that a higher wavelength (for example; red)  would have a higher average voltage compared to lower wavelengths ( for example; blue ).

We began our experiments by testing the relationship between voltage and distance. We decided to test distances by increments of 2 cm. First we placed the solar cell face down that way it had no light exposure. Next we placed the flash light directly on the solar cell (0 cm distance). After that we used a ruler to measure how high to hold the flashlight from the solar cell. For each distance we held the flashlight in place for 10 seconds.

image 1

We used excel to calculate an average voltage for each trial. Below is a table with a corresponding graph of our finding for Voltage vs. Distance.


Distance (CM)    Average Voltage
0 (face down)    0
0    0.407417
2    0.385606
4    0.359946
6    0.335569
8    0.334286

image


In conclusion, our original hypothesis was correct. As we increased the distance of the flashlight from the solar cell, the average voltage output decreased.

For the second part of our experiment, we were giving four different colored film filters (red, yellow, green, and blue). For each trial we would place a different colored film on top of the solar cell and then place the flashlight directly on top for 10 seconds.

photo


We used excel again to calculate the average voltage for each color we tested. Below is a table of our data and a corresponding graph.


Color    Average Voltage
Blue    0.330437
Green    0.3544814
Red    0.357812
Yellow    0.386889


image-1

In conclusion from our data in this experiment, we discovered that higher wavelengths have a higher average voltage. Yellow being the highest, followed by red then green. Our hypothesis was fairly right in this experiment; the color blue (lower wavelength) had the lowest average voltage. Blue is one of the lowest wavelengths.

Overall, I really enjoyed this experiment because it was an interesting way to learn about solar cells.  Bryan and I learned from this activity that the farther away a light source is from the solar cell, the less voltage output. Also that colors with higher wavelengths on the spectrum, such as yellow and red have a high voltage output as well. This experiment was interesting because you can compare our results and relate them to actual renewable solar energy sources.

 image2

Generator Lab

During this experiment, we explored Faraday’s Law which states that changing magnetic fluxes through coiled wires would generate electricity. We were given a tube which had a magnet inside that was able to move back and forth through a coil of wires. The greater the magnetic flux, the greater the currents and voltage – the faster we shake the tube, the more voltage we will generate.

Using lab view, my partner and I preformed three trials where we shook the tube at different speeds. For each trial, we would shake the tube at a constant rate for 30 seconds for three trials. These three trials of constant shake speed would count as one larger trial. We tested three different shake speeds – fast, medium, and very slow. My partner shook the tube while counting how many shakes he made during the trial while I timed him and informed him of when to stop.

Below is a table of our data that we collected. The table includes the sum of the squares of the voltages we got through lab view. To calculate the sum of the squares we just calculated the sum of all the voltages we got during our trials. We calculated this through Excel.


Sum of Squares of Voltage (Power)    Number of Shakes
0.425070219   71
2.138   73
2.532   71
8.553   99
10.169   110
13.049   113
1.844   50
0.465343974   48


So, the first three trials were when we shook the tube at a medium speed (71, 73, 71 shakes) the next three trials were when we shook the tube at a fast speed (99,110,113 shakes), and the last two numbers on our table represent our third trial at a very slow rate (we got 50 for two trials, and then 48 shakes). Although our numbers turned out much smaller than what other students collected in their experiments, our graph shows the trend which was expected in our hypothesis.


photo

In conclusion from our data and graph, we found that as we shook the tube faster, the amount of power generated (voltage) went up. The faster the magnet travels through the tube through the coiled wires, the more voltage it generates.

This lab was an interesting way to learn about power and voltage. We were able to generate power ourselves by shaking a tube. Once again, my partner Bryan and I cooperated well during this experiment. It was a little more difficult to get going on this experiment though due to technical difficulties and our equipment wasn’t working right off the bat. Once we figured everything out, we were able to perform the experiment smoothly and had a good time with it again.

Tesla & Fisker Electric Vehicles

Telsa and Fisker are two companies who make electrical powered motors for automobiles that strive for a better outcome for the environment. Both companies also ensure that electrical powered motors are more efficient than gasoline.

Lined-up-Rotors

Telsa Rotors

Telsa’s motors are the future of modern automobile making. First off, is eliminating gasoline. According to Telsa, Internal Combustion Engines (in cars today) result in wasted energy. Only about 30% of the energy stored in gasoline is converted to forward motion. The rest is wasted as heat and noise. When the engine isn’t spinning, there’s no torque available. The engine must turn at several hundred revolutions per minute (RPM) before it can generate enough power to overcome its own internal losses. Cars resting alone takes 1,000 RPM. To improve efficiency, Telsa replaced the engine with a motor. Electric motors convert electricity into mechanical power and also act as a generator, turning the mechanical power into electricity.  Compared to the engine, the “Roadster” motor has only one moving piece – the rotor. The spinning rotor eliminates conversion of linear motion to rotational motion. With the motor’s wide torque band as well, it practically allows the torque to be available at low RPM, eliminating the need for gears. The Roadster has only a single speed gear reduction – one gear from zero to top speed. There’s also no need for a reverse gear, which is interesting because it can be done electronically. This design is simple, reliable, compact, and lightweight. It also accelerates faster than most sports cars, and has instant torque no matter the conditions on the road. Telsa’s electric motor achieves an overall driving efficiency of 88% – that’s three times the efficiency for a conventional car. The Roadster motors also act as a generator to recharge the battery. When the accelerator pedal is released, the motor switches into “generator” mode and captures energy while slowing the car.

Telsa’s vehicles are also helping to prevent harmful emissions and pollutants from getting into the atmosphere – they have no tailpipes. Telsa vehicles are unlike gasoline-powered vehicles that burn refined petroleum. Telsa Vehicles can use electricity however it is produced (coal, solar, hydro, geothermal, wind).

Telsa has been very successful over the past few years, but for Fisker it is not looking good. From 2013 to 2014, there has not been production at Fisker due to bankruptcy. The Fisker Karama was a hybrid plug-in that also came with a small gasoline engine that would kick in when the battery power ran out. Fisker sold about 1800 models between 2011 and 2012 before a series of problems halted production.

The electrical motor for automobiles show many benefits not only for car owners, but for the environment. These models are special because they release substantially less CO2 emissions compared to conventional cars. Electrical motors are also cost efficient because recharging a battery costs around $1.40 per gallon, where gas prices range from $3.50 – $4.00 per gallon for conventional cars. As of June 2104, there were over 500,000 plug-in electric passenger cars and utility vans in the world – 250,000 in the United States since the market launch of the Telsa roadster in 2008. Telsa is working on producing more electrical motor vehicles,some with even higher battery power. This is said to be presented in 2020.

Electrical powered motors allow more efficiency not only on the road, but for our wallets. Electrical motors produce less CO2 emissions than gas powered engines and may help lead us to cleaner air in the future.

AP880604325906-638x407

Resources:

http://www.teslamotors.com/roadster/technology/motor

http://www.teslamotors.com/models/features#/performancehttp://thinkprogress.org/climate/2014/08/31/3476807/tesla-electric-car-battery-breakthrough/

http://en.wikipedia.org/wiki/Electric_car_use_by_country

http://www.foxnews.com/politics/2014/06/09/china-billionaire-buys-fisker-in-bankruptcy-now-poised-to-sell-in-us-auto/

Electrical Generation: Coal, Natural Gas & Nuclear Power Plants

In the United States, the primary energy supply consists of six main fuels; 3 of them being coal, natural gas, and nuclear power.

Coal plays a vital role in electrical generation world wide. Coal-fired power plants currently fuel 41% of global electricity. Some countries use coal more than others, but without electricity our modern world would be unlivable. In the United States, coal fuels 45% of our electricity.

So how does a coal-fired power plant work? Before the coal is burned, it is crushed into very fine powder. It is then mixed with hot air and blown into the firebox of the boiler. The coal and air mixture provides a complete combustion. Water is then pumped through pipes inside the boiler and turned into steam by the heat. The pressure of the steam pushing against a series of turbine blades turns the turbine shaft. This shaft is connected to the shaft generator, where magnets spin within wire coils to produce electricity. The water used for this process can be reused over and over again after a cooling process. Below is a diagram of this process.

coal-fired-power-station2


Although coal is the most common sources of energy generation, it is the largest greenhouse gas emitter. Improvements for coal production are still in processes. New combustion technologies are being developed which allow more electricity to be produced from less coal. This is know as improving the thermal efficiency of the power station. Improvements from coal-fired power stations will play a crucial part in reducing CO2 emissions at a global level. A clear and obvious way of reducing greenhouse gas emissions is by using different fuels for energy supply, such as natural gas.

Natural gas, is another important source of energy generation. Natural gas is a very versatile fossil fuel that we can use for heating our homes, electricity, transportation, and as an industrial feedstock. As of 2012, it made up 30% of the U.S energy mix, and is continuing to be readily available as a domestic resource.

Natural gas is a product of decomposed organic matter, deposited over the past 550 million years. This organic matter mixed with mud, silt, and sand on the sea floor, gradually became buried over time. This matter underwent a thermal breakdown process due to exposure of increasing amounts of heat and pressure, and converted into hydrocarbons. These hydrocarbons exist in a gaseous state (which is essentially natural gas). In it’s pure form natural gas is colorless, odorless and composed primarily of methane. Natural gas is found deep within the earths core in rocks (shale). The way to retrieve natural gas is through a procedure I talked about in my previous blog: Fracking. Fracturing allows us to continue to retrieve natural gas. Natural gas provides us with a source of energy while reducing CO2 emissions, unlike coal. Below is a diagram of the natural gas retrieval process.

Geology-of-natural-gas-resources

Natural gas can be used to generate electricity in various ways. The most basic natural gas-fired electric generation consists of a steam generation unit. With this, fossil fuels are burned in a boiler to heat water and produce steam that then turns a turbine to generate electricity. These basic steam units are more typical of large coal or nuclear generation, but can be used for natural gas as well.

Over the years, there has been an increased reliance on natural gas. Although coal is the cheapest fossil fuel for generating electricity, it is also the dirtiest – releasing the highest levels of pollutants into the air. Natural gas plays an increasingly important role in the clean generation of electricity.Natural gas does not release the same amount of nitrogen oxides or carbon dioxide as coal-fired plants do.

Last but not least is Nuclear power. A nuclear reactor produces and controls the release of energy from splitting atoms such as uranium. Uranium-fuelled nuclear power is a clean and efficient way of boiling water to make steam which drives turbine generators. Apart from it’s reactor, a nuclear power station works like most coal-fired power stations. In the reactor core the uranium fissions (splits), producing heat in a continuous process is called a chain reaction.

6-fission

Uranium atoms undergoing nuclear fission.

This process depends on a moderator such as water or graphite. The moderator slows down the neutrons produced by fission so that they will produce more fissions. The products of the fission stay in the ceramic fuel and undergo radioactive decay, which releases more heat. Steam is formed above the reactor core or in separate pressure vessels, which then drives the turbine to produce electricity. The steam from this process is condensed and the water is reused. Below is a diagram of nuclear power generation.

nuclear_reactor

Unlike fossil fuel plants, nuclear power plants don’t produce smoke (like coal-fired energy production). Nuclear power is considered carbon-free and produces more electricity than other renewable energy sources. Uranium on the other hand is not the easiest resource to get our hands on because it is mined and and transported to power plants. There is also an issue of radioactive waste, which is extremely dangerous. Most plants store nuclear waste in steel-lined concrete basins filled with water, where it remains radioactive for thousands of years.

All three of these energy sources raise concern because they add to the emission of greenhouse gases into our atmosphere. Coal being the worst, and natural gas and nuclear power being better in terms of CO2 emissions. All three of these sources generate electricity through a process where either steam or smoke are generated through turbines within the process. There are several ways in which these sources of energy generation are similar, but the impact they have on CO2 emissions is far more different. But in the end, electricity, heat and transportation would not be possible without these resources.

graph of all 3 energy

Here is a graph of how much of these different energy resources will be used in the future

Sources:

http://www.discovery.com/tv-shows/curiosity/topics/10-pros-cons-nuclear-power.htm

http://www.world-nuclear.org/nuclear-basics/how-does-a-nuclear-reactor-make-electricity-/

http://www.ucsusa.org/clean_energy/our-energy-choices/coal-and-other-fossil-fuels/how-is-natural-gas-formed.html#.VCNvW1zIrL8

http://naturalgas.org/overview/uses-electrical/

http://www.worldcoal.org/coal/uses-of-coal/coal-electricity/

http://www.duke-energy.com/about-energy/generating-electricity/coal-fired-how.asp

Class Text: Beyond Smoke and Mirrors

Pulley Lab Reflection

This lab activity was an interesting and successful way of exploring Newton’s 2nd Law. In this lab we used the robot along with varying masses and velocity on a pulley system. The equation we used for this activity was F=ma. With this equation we explored conservation of energy and were able to understand rules of Newton’s 2nd Law; that energy is not created or destroyed.

Our procedure in this lab activity was to perform multiple trials where the constant differed. For our first four trials, we kept the mass at a constant weight of 0.09 kg and varied the amount of power of the pulley in each trial. During this trial we were able to draw a hypothesis that when mass remains constant, force and acceleration will also increase (F=ma).

Below is a table of our findings when Mass (kg) was constant with a corresponding graph.

Speed (RPM) Battery Discharge Mass (kg) Power Time (sec) Acceleration (RPM/sec.)
30.850514 111 0.09 50 4.511 6.838952
66.496526 139 0.09 75 2.351 28.284358
106.949352 110 0.09 100 1.415 75.582581
106.567093 70 0.09 125 1.406 75.794519


constant-mass-300x181

In conclusion from this trial, as we increased the amount of force on the pulley, the acceleration increased as well. Our results show a positive slope in our graph (best fit line).

For our second trial, we kept the power at a constant level of 50, and varied the mass (kg). During this trial we were able to draw a hypothesis that when mass increases, acceleration will decrease. This means that our equation (F=ma) would not be balanced, as it was in the previous trial.

Below is a table of our findings when Power was constant with a corresponding graph.

Speed (RPM) Battery Discharge Mass (kg) Power Time (sec) Acceleration (RPM/sec.)
23.724792 153 0.08 50 5.058 4.690548
24.856242 139 0.10 50 5.391 4.610692
15.795495 139 0.12 50 7.576 2.08439
2.115704 194 0.16 50 9.847 0.214858


constant-power-300x181

In conclusion from this trial, when the amount of mass in Kg was added to the pulley, the acceleration decreased. Our results this time show a negative slope in our graph (best fit line), which reflects the equation F=ma.

In the final part of our experiment, we used a ruler to measure the height of the pulley. Using Labview we looked at the relationship between battery discharge and potential energy.

For this, we used the equation PE= mgh.

After we calculated PE, we divided our result by the time (PE/T).  We did this for each trial (constant mass, and constant power) Below is a graph of the relationship between Battery Discharge and PE/T along with a corresponding graph.

Gravity (m/s²) Mass (kg) Height (km) Time (sec) PE PE/T Battery discharge
9.8 0.08 0.04 5.058 0.158619 0.03136 153
9.8 0.10 0.04 5.391 0.211327 0.0392 139
9.8 0.12 0.04 7.576 0.356375 0.04704 139
9.8 0.16 0.04 9.847 0.617604 0.06272 194
9.8 0.09 0.04 4.511 0.159148 0.03528 111
9.8 0.09 0.04 2.351 0.082943 0.03528 139
9.8 0.09 0.04 1.415 0.049921 0.03528 110
9.8 0.09 0.04 1.406 0.049604 0.03528 70


PE-chart-300x150

The battery discharge in this part of the activity did not increase as much as we initially thought it would, but it was clear that this experiment didn’t require a huge amount of battery power. Over all, the pattern in the graph was pretty stable. This part of the experiment, however is where we saw conservation of energy between PE and the amount of energy needed on the pulley.

Over all, I really enjoyed this experiment. I learned a lot about Newton’s 2nd law and how to use the formulas used with it. This experiment was not too difficult because my partner Bryan and I were able to split the work evenly and help each other with parts we didn’t quite understand. Bryan was a huge help because  I am not very exel-friendly as he was! Without his help I would have struggled on our graphs and charts. We have a very good relationship as partners and I look forward to working with him on future experiments! We try to have fun with the activities, which makes it easier for me to learn the material.

pully lab

This is a picture of our pulley. This was the trial when we kept the Mass constant.

Fracking

Fracking, also known as hydraulic fracturing is a process of retrieving oil and gas deep from within the earth’s surface. Today, this is a very controversial procedure that many sources believe to be beneficial, but some believe to be dangerous and harmful.

fracking-infographic

So what exactly is “fracking?” It is a fracturing job, “fracturing fluids” or “pumping fluids” using water and sand.  The job involves drilling down into the earth before a high-pressure water mixture directed at rock to release the gas inside. The water and sand are injected into the rock which allows the gas to flow out the head of the well. The procedure can be preformed vertically, but it is more common to drill horizontally at the rock layer. In the US there is an estimated 35,000 wells preforming fracking.

Below is a diagram of this procedure.

Fracking_Infographic

Here is a link I have inserted explaining the Fracking process and its benefits

Hydraulic Fracturing

Fracking is beneficial because it makes it possible to retrieve shale oil extraction to produce oil and natural gas in places where other technologies are ineffective.  In the US, fracking has boosted domestic oil production and made improvements in gas prices. There is enough fossil fuels locked in shale in North America to make the US more energy independent.  Fracking offers “gas security” for about 100 years and has the potential to generate electricity at half the CO2 emissions of coal. Using natural gas to heat our homes and power our cars releases far fewer carbon emissions than coal.

API Footprint Infographic Final_2.28.12

This image shows the improvements of combining horizontal drilling with vertical drilling.
Studies estimate that up to 80 percent of natural gas wells drilled in the next decade will require hydraulic fracturing to properly complete well setup. Horizontal drilling is a key component in the hydraulic fracturing process.
– See more at: http://www.energyfromshale.org/hydraulic-fracturing/what-is-fracking#sthash.b1SsiJnh.dpuf

As I mentioned before, fracking is a very controversial topic, but why is that? Fracking in the US has revolutionized the energy industry, but environmental concerns have created doubt. First off, fracking uses massive amounts of water that must be transported to the fracking site. This is a significant environmental cost. There is also worry that chemicals used in the job may escape and contaminate the ground water. Potential contaminations are possible, but the industry claims that pollution incidents are the results of bad practice. Although the benefits of fracking allow us to have energy resources with less carbon emissions, environmental campaigners say that fracking is “simply distracting energy firms and governments from investing in renewable sources of energy, and encouraging continued reliance on fossil fuels.” The controversy about the 21st century energy revolution is that we are striving to have energy efficiency and renewable energy, but fracking is continuing to support the use of fossil fuels. Fossil fuels will continue to increase climate change.

Below is a diagram of the “fraccidents” that have occurred in the US as of May 2011

Screen Shot 2014-09-18 at 1.37.11 PM

Drilling next to homes, schools, even in the middle of cemeteries.
Polluting air and water, making people sick, and hurting communities .

Sources:

http://www.mlive.com/environment/index.ssf/2014/05/fracking_a_divisive_practices.html

http://www.bbc.com/news/uk-14432401

http://www.energyfromshale.org/hydraulic-fracturing/how-hydraulic-fracturing-works

http://earthjustice.org/advocacy-campaigns/unfracktured

Here are a few more images to look at

A fracturing operation in progress at the Bakken Formation in North Dakotahttp://en.wikipedia.org/wiki/Hydraulic_fracturing#mediaviewer/File:Frac_job_in_process.JPG

A fracturing operation in progress at the Bakken Formation in North Dakota
http://en.wikipedia.org/wiki/Hydraulic_fracturing#mediaviewer/File:Frac_job_in_process.JPG

http://en.wikipedia.org/wiki/Hydraulic_fracturing#mediaviewer/File:Well_Head_where_fluids_are_injected_into_the_ground.JPG

http://en.wikipedia.org/wiki/Hydraulic_fracturing#mediaviewer/File:Well_Head_where_fluids_are_injected_into_the_ground.JPG


Robotics Activity

The robotics activity was a great experience for me because i’ve never done anything like this in previous classes. This was my first time building a robot which I thought would be difficult, but the instrutions were very easy to follow and with the help of my partner we were able to successfully do the activity. Apart from being a new experience for me, I also learned quite a bit about how to calculate the total distance and velocity of the robot.

After assembling our robot, my partner and I determined what power levels we wanted to test with corresponding times. For our first trial we tested the robot at a 25 power level for 2 seconds. Our second trial at a 50 power level for 4 seconds, and our third trail at a 60 power level for 6 seconds. To make sure our trials would produce valid data, we had to make sure our robot had enough distance to travel on our label without inferfering with any other objects. Also, we had to make sure that our robot was traveling in a straight line every time we performed a trial. Below is the data we collected from our trails. The first table includes our own calculations, and the second includes calculations from the computer.

Our Calculations

Power level & time traveled Distance measured (meters) Velocity (m/s)
25 PWR, 2 Seconds 0.17 0.085
25 PWR, 2 Seconds 0.171 0.0855
50 PWR, 4 Seconds 0.741 0.185
50 PWR, 4 Seconds 0.742 0.186
50 PWR, 4 Seconds 0.751 0.188
60 PWR, 6 Seconds 1.40 0.233
60 PWR, 6 Seconds 1.39 0.2317
60 PWR, 6 Seconds 1.42 0.2367


Computer Calculations

Power level & time traveled # of wheel turns Distance measured (meters) Velocity (m/s)
25 PWR, 2 Seconds 0.941667 0.160083 0.0800417
25 PWR, 2 Seconds 0.963889 0.163861 0.0819306
25 PWR, 2 Seconds 0.969444 0.164806 0.0824028
50 PWR, 4 Seconds 4.322222 0.734778 0.184757
50 PWR, 4 Seconds 4.34722 0.739028 0.184757
50 PWR, 4 Seconds 4.38333 0.745167 0.186292
60 PWR, 6 Seconds 8.11389 1.37936 0.229894
60 PWR, 6 Seconds 8.10833 1.37842 0.229736
60 PWR, 6 Seconds 8.14167 1.38408 0.230681


For our calculations, we determined the distance traveled by meausring from the starting point to where the robot stopped using a ruler. We marked the starting point with tape and would place the robot there before every trial. When we measured the distance, we would measure from the back of the robot (starting point), to the front of the robot (ending point). To calculate the velocity, we used the formula: Velocity = distance / time. We did not calculate the number of wheel turns, but if we did we would have used the formula:

Wheel turns = rotation /360(degrees).

We also calculated the perecent error in distance from our data to the computer data. For this, we used the formula:

% Error = |(our distance-distance on computer)/average  x   100|

Below is our results for Percent Error:

PWR level  & time traveled Percent Error
25 PWR, 2 Seconds 6.008
25 PWR, 2 Seconds 4.26
25 PWR, 2 Seconds 3.689
50 PWR, 4 Seconds 0.8432
50 PWR, 4 Seconds 0.4013
50 PWR, 4 Seconds 0.7797
60 PWR, 6 Seconds 1.485
60 PWR, 6 Seconds 1.053
60 PWR, 6 Seconds 2.6519


Based off of our percent error data, our measurements were not too far off from what the computer calculated. The percentages are very low, which means we measured fairly correctly.

Overall, I think this activity was a good expereience and I learned a lot from the data my partner and I collected. All three variables (# of wheel turns, distance, and velocity) increase as the time traveled, and power level increased. My partner was awesome and I feel like I learned a lot more doing this hands-on activity than I would have in a lecture.


Our Robot

Our Robot

The Nation’s Energy Grid

The Nation’s Energy grid is what makes electricity in our houses possible. The Grid is a network of power plants and transformers connected by over 450,000 miles of high-voltage transmission lines. Electrical power is generated in power plants, which is then moved by the transmission lines to substations. What gets the electrical power to us is a system of smaller, low voltage transmission lines.  These are the power lines we see everywhere around us.

The obvious pros of having this electrical grid are that it allows us electricity and power in our homes, which we really can’t live without. Electricity gives us access to almost everything we use and need in our daily lives.  There are several cons to our electrical grid one of them being the cost. To sustain the grid, and make modern updates so that we can keep up with our growing technologies and demands means investing billions of dollars. Through the Recovery Act, the Department of Energy invested about $4.5 billion to do such improvements.  Severe weather also results in hefty costs.Severe weather may cause power outages which cost the economy between $18 and $33 billion every year. The number of power outages is expected to increase due to the rise in climate change. There is more likely to be extreme weather in the future because of global warming, which means more money needed to fix the power outages.

Below is a diagram of the costs per year for power outages:

       The Nation’s Smart Grid is a more reliable way of getting electricity. As I mentioned above, our demand and need for efficient power and electricity is rising as we take on increasing technologies. This includes increasing numbers of electronic devices we have in our homes, utilities, and recreational items.  As our society progresses, so should our energy grid. The Smart grid is making the future more possible. Grid modernization is working towards energy storage so that we are ready for many generations to come.  Today’s grid primarily delivers electricity in a one-way flow from its generators to our homes. The Smart grid will have a two-way flow of both electricity and information. The smart grid is essential for our modern world and increased demand for reliable electricity.

In order to build an efficient and effective smart grid, it requires hundreds of standards. For example, one of today’s smartphones typically incorporates over 150 standards.  Our nation is currently working to update and develop new standards. The Smart Grid will be a more reliable and efficient electricity form.

Below is a simplified diagram of the Smart Grid:


Sources:

http://www.nist.gov/smartgrid/beginnersguide.cfm

https://www.smartgrid.gov/recovery_act/overview

http://energy.gov/articles/top-9-things-you-didnt-know-about-americas-power-grid

http://www.energy.gov/science-innovation/electric-power/smart-grid