Monthly Archives: October 2014

Pandora’s Promise

In the film Pandora’s Promise, the topic of nuclear power is discussed in both a positive and negative light. At the very beginning of the film, the narrator discusses and shows activists who are against nuclear power to create energy. Activists talk about how dangerous nuclear power is and how is is killing millions of people every year.

Three nuclear disasters are discussed through out the film; the explosions at Fukushima, three mile island, and Chernobyl. Fukushima, as I discussed in a previous blog happened back in 2011 in Japan following a earthquake and tsunami. The narrator discusses the accident and very devastating images are shown of the area and the families living in refugees. Even a year after the accident, everything is still ruined and no one is allowed or wants to live near the region because everything is contaminated with radioactivity. A man interviewed from the refugee said that he didn’t even let his two children play outside for long because of the radioactive waste in the air. When the radioactive meter was shown on the screen while they were in the Fukushima region, the meter read 44 while pointed toward a plant on the street. That is pretty scary.

The majority of the film though is not bashing nuclear power – it is supporting it. One of the sources in the film stated: “to be anti-nuclear is to be in favor of burning fossil fuels.” Although these nuclear accidents caused so much damage and suffering, the narrator explained that the reason why all three of these accidents occurred was because of inadequate cooling in the reactor. Many of the sources throughout the film emphasized that nuclear power does not produce carbon dioxide like fossil fuels do. Global warming is a huge issue and while some people are scared of nuclear energy, there reasoning for being scared isn’t so valid. It was mentioned in the film that there are 3 million deaths a year because of air pollution and fossil fuel plants. There are no deaths from nuclear power plants in the United States. It was also stated that you would get more radiation from eating one banana than if you drank all the water that goes through a nuclear power plant in one day. I found that very interesting and surprising.

Throughout the film, there are images of the radioactivity exposure meter in various locations. This was done to show that no matter where you are there will me natural radioactive exposure. Some regions are more than others, such as higher elevated places or up in a airplane. I was surprised when they showed the meter in Guarapari, Brazil. The soil on the beach showed 30.81 on the meter – while people were covering a man with the sand because they said it helped his pain. That reminded me of Tom Vales’s demonstration when he said that people used to take pills that were radioactive because they thought it helped them.

The explosion on Chernobyl was one of the most shocking to me. The images shown were almost haunting – seeing the abandoned city and everything ruined – not by the explosion but just by time its self. Some of the people refused to leave and were living there still. When interviewed they said that they had been living there for over 25 years and they were completely fine (in terms of health). 56 people died because of the explosion, and later 4,000 more deaths due to disease and cancer.

Although these numbers and accidents are scary, the film discusses that the issue of global warming is due to the burning of fossil fuels. The environmentalist in the film said that he is not worried about nuclear waste. Nuclear weapons are not being used by anyone in the world anymore and the old nuclear weapon accessories are being reused to make energy, which is a very big percentage of our overall energy production.

This film left me off with mixed feelings about nuclear energy. At the beginning of the film I felt completely against it. But more towards the middle and end of the film I was unsure about where I stand on this issue. I would consider myself as an advocate to help stop global warming. I know that fossil fuels produce an abundant amount of carbon dioxide which is contaminating our air. The film persuaded me towards supporting nuclear energy because it doesn’t release carbon dioxide and no one in the United States has died from it (so they say as of 2012). I’m not sure how accurate it is to say that no one has died from nuclear power because if radioactivity is all around us, and being released in accidents than the cause of cancer can be unknown for some people. But in terms of stopping the continuation of global warming I think nuclear energy is the right way to go. Solar and Wind energy were also mentioned in the film but more in a negative light. Yes solar and wind energy are a free source of energy, but it is not always available. Like the female in the film mentioned – you’re not going to depend of the sun to heat your home in the winter instead of oil.

This film was very eye-opening but has only made me more confused about where I stand. I think nuclear energy is a good thing because it helps in terms of global warming, but radioactivity is a scary thing to grasp just because of how dangerous it can be. But I don’t know what is more scary or dangerous, the effects of global warming in the the future, or using nuclear energy now.


MIT Nuclear Reactor tour

Having the opportunity to tour MIT’s nuclear reactor was a great experience because i’ve never seen a nuclear reactor in person before! Before this class I had no idea that MIT had a nuclear reactor at all and used it for medical research. The tour was a great way to apply what I had learned in class about how nuclear reactors work and how they produce energy. The reactor its self was very interesting; like I said, I’ve never seen a nuclear reactor before so it is easier for me to understand how the reactor works now that i’ve seen one in person. When I initially found out that we were touring the MIT reactor, my first thought was that MIT used it for energy use. I soon learned that this was not the case – it is used strictly for research. I never knew that a nuclear reactor could be used for medical research. I also never knew how dangerous radiation was either. I knew it isn’t a good thing but after the tour I really understood how dangerous it was. The precautions the staff went through to make sure our group and the staff had no radioactive exposure were very serious. This is something I would have never known unless I toured a reactor like we did.

The tour guide was very informative and definitely knew what he was talking about. He explained everything in-depth and answered all of our questions. Although I am not a science major, it was very easy for me to understand what he was talking about and had it very clear what kind of research was performed at the MIT reactor.

Over all, I think this was a great experience. If it weren’t for this class, I don’t think I would have ever toured a nuclear reactor in my life. It’s interesting to be able to know how research for diseases and cancers are performed and where they are performed. Whenever I thought of medical research I would always just think it was performed in a hospital or a lab – not a nuclear reactor. This experienced opened my eyes to  new information that I would not have obtained from a lecture or a book. I’m glad I had this opportunity, and I took away a lot of information from the tour.


0321reactor


Fukushima Nuclear Disaster

On March 11, 2011, a 15 metre tsunami after a major earthquake disabled the power and colling of three Fukushima Daiichi reactors, causing a nuclear accident. All three cores largely melted in the first three days of the accident. The accident was rated a 7 on the INES scale, due to  high radioactive releases over days 4 to 6.

Eleven reactors at four nuclear power plants in the region were operating at the time of the eathquake and all shut done automatically. The operating units which shut down were Tokyo Electric Power Company’s (Tepco) Fukushima Daiichi 1, 2, 3, and Fukushima Daini 1, 2, 3, 4, Tohoku’s Onagawa 1, 2, 3, and Japco’s Tokai, total 9377 MWe net. Fukushima Daiichi units 4, 5 & 6 were not operating at the time, but were affected. The main problem initially centred on Fukushima Daiichi units 1-3. The tsunami was essentially the issue for the reactors, not the earthquake.

FukushimaPic

Power from the grid or backup gnerators was available to run the Residual Heat Removal system cooling pump. The three reactors at Fukushima Daiichi lost power an hour after the earthquake, when the entire site was flooded by the tsunami. This disables 12 of 13 backup generators on site and also the heat exchangers for dumping reactor watse heat and decay heat to the sea. The three units lost the ability to maintian proper reactor cooling and water circulation functions. Many weeks of hard work by hundreds fo Tepco employees centered on restoring heat removal from the reactors and coping with overheated spent fuel ponds. Some of the Tepco staff had lost homes, and even families in the tsunami, and were initially living in temporary accommodation under great difficulties and privation, with some personal risk. Three Tepco employees at the Daiichi and Daini plants were killed directly by the eathquake and tsunami, but none were killed from the nuclear accident.

The Fukushima Daiichi reactors are GE boiling water reactors. Below is a diagram of the reactor.

 BWR 3

When the power failed at the site (about an hour after shutdown of the fission reactions), the reactor cores were still producting about 1.5% of their norminal thermal power from fission product decay. Without heat removal by circulation to an outside heat exchanger, this produced a lot of steam in the reactor pressure vessels housing the cores, and was released into the dry primary containment through saftey valves. Later this was accompanied by hydrogen, produced by the interaction of the fuel’s hot zirconium cladding with steam after the water level dropped.

The disaster at Fukushima has raised much internation concern about the future of nuclear energy, but Japan is working to improve their future by building a wall of ice to stem the Fukushima leak. the project is expected to be completed by March 2015, costing $320 million and using a substantial amount of power (enough power each day to run 3300 Japanese households). The country’s government decided a wall of ice is the best solution to stem the flow of radioactive water leaking from Fukushima Daiichi’s four stricken nuclear reactors. The wall will stop 400 tons of groundwater being containimated everyday. It is currently being stored in huge tanks.

18fukushima-master675

three years after the accident, engineers working on site

Resources:

http://www.greenpeace.org/international/en/news/Blogs/nuclear-reaction/fukushima-nuclear-crisis-update-for-january-7/blog/47827/

http://www.nytimes.com/2014/06/18/world/asia/measuring-damage-at-fukushima-without-eyes-on-the-inside.html?_r=0

http://www.newscientist.com/article/dn24100-should-fukushimas-radioactive-water-be-dumped-at-sea.html

http://www.psr.org/environment-and-health/environmental-health-policy-institute/responses/costs-and-consequences-of-fukushima.html

http://www.world-nuclear.org/info/Safety-and-Security/Safety-of-Plants/Fukushima-Accident/


Tom Vales Demonstration

I am very glad I had the opportunity to see this demonstration by Mr. Vales. I learned a lot about radioactive elements and the elements that they give off. I was very surprised to hear how dangerous radioactive elements are and that people used to consume them in the past thinking it would cure them in some way!

First, I learned that Radioactive elements are constantly decaying and are unstable. Radioactive elements give off Alpha particles (2 protons, 2 nuetrons; positive charge), Beta particles (negatively charged), or Gamma Rays (have no mass or charge -are a form of electromagnetic radiation). Mr. Vales emphasized how dangerous these elements can be and I found it shocking that enough exposure to these radioactive elements could lead to death, and has killed many people in the past.

The objects that he presented to us were very interesting because I never knew that some objects were radioactive. He showed us Uranium glass, Fiestawear, a flower vase, a pocket watch, and many more objects. These items stood out to me because of how radioactive they were.

The uranium glass was a neon greenish/yellow candle holder. He explained to us that the uranium in the holder was what made the color. When he shined a UV light on the holder it made the color florecent. The Fiestawear and flower vase were similar to the candle holder. It was an orange plate that had uranium salt in the glaze to give it the orange color. It was scary to think that people would eat off of a plate such as the fiestawear orange one that was radioactive. Mr. Vales explained that if the plate chipped and you accidentally swallowed the chipped piece, it would stay with you forever and if you had enough radioactive exposure, you could die.

The last item that stood out to me was the pocket watch. He explained that it was from the 1940’s and the numbers on the dial were painted with radium; which makes the numbers glow. It was also shocking to me when he told us the story about how these pocket watches were made. He explained that young girls would be paid a significant amount of money to paint the numbers on the watches. They would dip the brush into the paint and then put it inbetween their lips to make the point finer. The girls got enough exposure to this radioactive paint and they all died – scary!

Over all,  I enjoyed the demonstration more than I thought I would. It was interesting to see all of the items that people used to have in their home and use daily that were radioactive! The fact that people would take pills that had radioactive elements in them is just shocking. It opened my eyes to how dangerous radioactivity is, and I’m very glad I got to hear this demonstration.

Now when I think of radioactive I won’t just think of the song.


Stirling Heat Engine & the Peltier Device

Stirling heat Engine

A Stirling engine is a heat engine that operates by cyclic compression and expansion of air or other gases at varying temperatures. Every stirling engine has a sealed cylinder with one part hot and the other cold. The working gas inside the engine (usually air, helium, or hydrogen) is moved by a mechanism from the hot side to the cold side. When the gas is on the hot side, it expands and pushes up on a piston. When it moves back to the cold side it contracts. Properly designed Stirling engines have two power pulses per revolution, which allows smooth running. Two of the more common types are two piston Stirling engines and displacer-type Stirling engines.

A displacer type engine has one piston and a displacer. The displacer controls when the gas chamber is heated and when it is cooled. This type of Stirling engine is sometimes used in classroom demonstrations. Below is a diagram of the displace type engine.

Screen Shot 2014-10-15 at 1.21.59 PM

In order to run, the engine requires a temperature difference between the top and bottom of the large cylinder. Above, you can see a smaller piston at the top of the engine. This is a tightly-sealed piston that moves up as the gas inside the engine expands. The displacer is the large piston in the diagram above. This piston is very loose in its cylinder, so air can move easily between the heated and cooled sections of the engine as the piston moves up and down. The engine repeatedly heats and cools the gas, extracting energy from the gas’s expansion and contraction.

Below is a detailed diagram of this Displacer model and how it works.

tech2b

Below is a short clip of a common class demonstration of the MM-1 Coffee Cup Stirling engine.

http://www.stirlingengine.com/graphics/videos/mm-1_hot.MPG

 In the Two-piston Stirling engine, the heated cylinder is heated by an external flame. The cooled cylinder is air-cooled, and has find on it to aid the cooling process. A rod stemming from each piston is connected to a small disc, which is connected to a larger flywheel. This keeps the pistons moving when no power is being generated by the engine. Below is a diagram of this two piston engine.


tech1b

The Peltier Device

Thermoelectric modules are solid-state heat pumps that operate on the “Peltier effect” (the presence of heating or cooling at an electrified junction of two different conductors). A thermoelectric module consists of an array of “p” and “n” type semiconductor elements that have many electrical carriers. The elements are arranged into an array that is electrically connected in series, but thermally connected in parallel. This array is then affixed to two ceramic substrates.

tecinside

The “p” type semiconductor is doped with certain atoms that have fewer electrons than necessary to complete the atomic bonds within the crystal lattice. When a voltage is applied, there’s a tendency for conduction electrons to complete the atomic bonds. When conduction electrons do this, they leave “holes” which are atoms with the crystal lattice that now have positive charges. Electrons are then continually dropping in and being bumped out of the hole and moving on to the next available hole. In effect, it’s the holes that are acting as the electrical carriers. Now, electrons move much easier in the copper conductors but not easily in the semiconductors. When electrons leave the p type and enter into the copper on the cold side, holes are created in the p type as the electrons jump out to a higher energy level to match the energy level of the electrons already moving in the copper. The extra energy to create these holes comes by absorbing heat. The newly created holes travel downwards to the copper on the hot side. Electrons from the hot side copper now move into the p type and drop into the holes, releasing the excess energy in the form of heat. The n-type semiconductor does essentially the same thing.

Below is a diagram of this device.

figure1

Thermoelectric modules have no moving parts and do not require the use of chloroflurocarbons. Therefore they are safe for the environment, reliable, and practically maintenance free. They can be operated in any orientation and are ideal for cooling devices that might be sensitive to mechanical vibration. Their compact size also makes them ideal for applications that are size or weight limited. Their ability to heat and cool by a simple reversal of current flow is useful for applications where both heating and cooling is necessary or where precise temperature control is critical.

Thermoelectric coolers are used for some of the most demanding industries such as medical, laboratory, aerospace, industrial, and consumer. Uses for these coolers could be as simple as a food or beverage cooler or for more sophisticated temperature control systems in missiles and space vehicles. A thermoelectric cooler permits lowering the temperature of an object below ambient as well as stabilizing the temperature of objects above ambient temperatures.

Resources:

Home

http://en.wikipedia.org/wiki/Thermoelectric_effect

FAQ

http://auto.howstuffworks.com/stirling-engine3.htm

Geothermal Energy in Iceland

Over past few years, generating electricity and heat with geothermal energy has increased significantly in Iceland. Geothermal power facilities currently generate 25% of the country’s total electricity production. Iceland has come a long way since the 20th century when they were one of Europe’s poorest countries. During the 20th century, Iceland was dependent on peat and imported coal for its energy, to a country with high living standards. In 2011, about 84% of Iceland’s primary energy use came from renewable resources; 66% of that was from geothermal.

Below is a Geothermal power plant in Reykjavik, Iceland. It is using their underground reservoirs of steam and hot water to generate electricity and to heat and cool buildings directly.

geothermal-plant-reykjavik_6387_600x450

So what exactly is geothermal energy? Geothermal energy is simply power derived from the Earth’s internal heat. This thermal energy is contained in the rock and fluids beneath Earth’s crust. It can be found from fallow ground to several miles below the surface, and even farther down to the hot molten rock (magma). These underground reservoirs of steam and hot water can be tapped to generate electricity to heat and cool buildings. Geothermal water from deeper in the Earth can be used directly for heating homes and offices or even for growing plants in greenhouses. Some cities pipe geothermal hot water under roads and sidewalks to melt snow.

To produce geothermal-generated electricity, wells are drilled a mile (or more) deep into underground reservoirs to tap steam and hot water that drive turbines linked to electricity generators. The three types of geothermal power plants are dry steam, flash, and binary. Dry steam is the oldest of the geothermal technologies which takes steam out of fractures in the ground and uses it to directly drive a turbine. Flash power plants pull deep, high-pressure hot water into cooler, low-pressure water. The steam that results from this process is used to drive the turbine. And lastly, in binary plants, the hot water is passed by a secondary fluid to run to vapor, which then drives a turbine. Most geothermal power plants in the future will be binary plants.

Geothermal energy can be extracted without burning a fossil fuel such as coal, gas, or oil. Geothermal fields produce only about 1/6 or the carbon dioxide that a relatively clean natural-gas fueled power plant produces. Binary plants release essentially no emissions. Unlike solar or wind energy, geothermal energy is always available no matter the condition. It is also relatively inexpensive – saving as much as 80% over fossil fuels. The main concern of geothermal energy is the release of hydrogen sulfide, a gas that smells like rotten egg at low concentrations. Another concern is the disposal of some geothermal fluids, which may contain low levels or toxic materials.

Iceland uses geothermal energy to heat many of the buildings and even swimming pools. Iceland has at least 25 active volcanoes and hot springs and geysers. Iceland’s geology is an advantage for geothermal energy production. Iceland is one of the most geothermal active place on this planet.

Below is a graph of the generation of electricity by geothermal energy in Iceland from 1972 through 2012

Screen Shot 2014-10-15 at 11.29.50 AM

Iceland is well know in being a world leader of geothermal district heating. After WWII, Orkustofnun carried out research and development, which has lead to the use of geothermal resources for heating of households. Today, about 9 in 10 households are heated with geothermal energy. Space heating is the largest component in the direct use of geothermal energy in Iceland. Below is a breakdown of the utilization of geothermal energy for 2013.


Screen Shot 2014-10-15 at 12.00.56 PM

As I mentioned above, Orkustofnun’s research and development led to the use of geothermal resources for heating in households in Iceland. This achievement has enabled Iceland to import less fuel, and resulted in lower heating prices. The relative share of energy resources used to heat households has changed since 1970. the proportion of the population using geothermal energy is still increasing and could rise from 89% to 92% in the long run. The share of oil for heating continues to decrease and at about 1% now. The share of electricity heating is about 10% right now. Below is a graph showing this information.

Screen Shot 2014-10-15 at 12.07.03 PM

Below I have included a Youtube video about Geothermal energy in Iceland. This video goes into detail about Iceland’s volcanic activity and how this makes Iceland an area where geothermal energy is possible.

Iceland – Geothermal

Resources:

http://www.nea.is/geothermal/

http://environment.nationalgeographic.com/environment/global-warming/geothermal-profile/

http://waterfire.fas.is/GeothermalEnergy/GeothermalEnergy.php

Solar Energy Worldwide

The Sun’s rays are able to supply an abundant amount of solar energy which can be converted into electricity and heat. Solar energy is free, and there is no production of greenhouse emissions, acid rain, or smog in producing solar energy. The cost of solar energy technology has been decreasing over the years as our technologies mature globally. Before I get into how solar energy has progressed in various countries, I want to discuss the different types of solor energy technologies. These include passive solar design, solar thermal design, and solar voltaic.

Solar energy can be obtained through passive solar designs in buildings. Passive solar buildings maximize absorption of sunlight through south-facing windows and use dark-colored, dense materials in the building to act as a thermal mass. These buildings store the sunlight as solar heat. Below is a diagram of how this system works.

sharp-passive-solar-basics

Solar thermal systems collect solar radiation to heat air or water for domestic, commercial, or industrial use. The collector for solar hot water is typically a box structure that has a glass top with a black absorber underneath it to circulate water. As the water is pumped through the collector, it is warmed and then circulated through a large insulated tank inside the building. Below is a typical thermal panel.

solar thermal

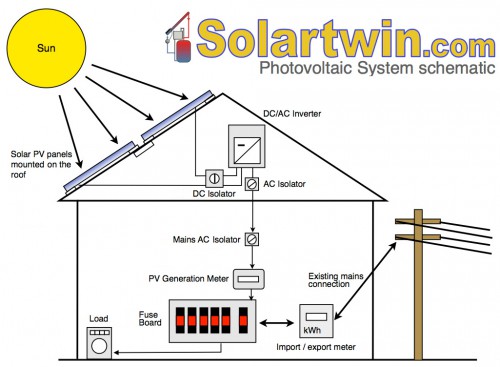
A solar photovoltaic (PV) system is an array of cells containing semiconductor materials that convert solar radiation into direct current electricity. These systems are non-polluting and help reduce electricity bills. Although these systems can be more expensive than conventional power sources, they can be a lower-cost electricity source in locations that are not served by the electrical grid. Below is a diagram of how solar voltaic panels work.

PV-Diagram

Here in Massachusetts, many people have the misconception that photovoltaic solar systems do not work because of New England’s weather conditions. According to the report Renewable Energy and Energy Efficiency Potential at State Owned Facilities and Lands, the Commonwealth’s annual average of insolation is approximately 4 kWh/m^2 per day. That is sufficient for PV systems to generate energy. PV modules are relatively unaffected by inclement weather and operate better in colder weather. Snow accumulation is not a problem because the panels are installed at an angle necessary to catch the sun’s rays (this also helps prevent snow collection on the PV module. If snow does collect it melts quickly). Experts on solar energy agree that MA is an excellent location to use solar photovoltaic systems.

 Now that I’ve discussed the different systems of collecting solar energy, I will get into how solar energy is becoming a worldwide renewable energy source.

Over the past few years, there has been a tremendous growth in the United States solar industry which is helping to pave the way to a cleaner, more sustainable energy future. The cost of a solar energy system has dropped over the past few years which is helping to give more American families and businesses access to affordable, clean energy. This past year, the United states hit a record breaking achievement in solar energy; the Ivanpah Solar Electric Generating System. This system in southern California was named the largest concentrating solar power (CSP) plant in the world on a massive scale. The facility has the capacity to generate 392 megawatts of clean electricity (that’s enough to power 94,400 average US homes). The successful completion of Ivanpah reflects America’s growing leadership in the global solar industry. President Obama stated during his State of the Union address that more Americans are relying on solar energy to power their homes and businesses than ever before. In the last 5 years, we have doubled the amount of energy we produce from solar energy. Below is a picture of the Ivanpah towers along with a diagram of how it works.

ivanpah2

Ivanpah uses an innovative power-tower technology using a field of mirrors called heliostats to track the sun and focus sunlight onto boilers that sit on top of 459- foot tall towers. When sunlight hits the boiler, it heats the water inside to create superheated steam used to spin an electricity-generating turbine.

 towercard-55a1ecff-29b7-4d62-b2d4-ef834d921179

Apart from Ivanpah, through LPO’s section 1705 program, there are now 5 utility-scale CSP plants operating or under construction in the SU that will generate enough clean electricity to power 252,000 homes.

Solar energy is not only powering homes in the US, it is powering corporate America. Corporate giants including Apple, Google, and Wal-Mart are turning to the sun to power stores, data centers and other facilities. In May of 2014 at a Wal-Mart store in California, President Obama cited Wal-Mart’s commitment to double the number of solar energy projects at its stores, Sam’s Clubs, and distribution centers nationwide by 2020. Obama announced 300-plus other private and public efforts, including new solar panels on the White House, to boost energy efficiency and renewable power.

Apple, pledged to power all facilities with green energy. The California-based company said its energy-intensive data centers already use 100% renewable power. Google announced a $1 million prize to develop the next generation of power inverters to bring solar to more US homes. Ikea also said it will use renewable energy (when feasible) to all its US stores. Other companies such as Kohl’s, Staples, and Whole Foods, have already committed to acquiring 100% of their power from renewable power either through on-site generation or energy credits.

Besides the United States, Germany is making efforts to increase the use of renewable solar energy. The cost of solar power plus battery storage is about to dip below the average electricity bill in Germany. According to a report by RenewEconomy, it was concluded that power generation units with a capacity of 10 megawatts or less will make up 50% of the country’s power by 2025 (up from 30% now). Germany has some of the highest residential electricity prices, which encourages the switch to renewables. To promote renewables, many German homes are leaving the grid for solar energy. The country is in a 20-year contract to wind and solar suppliers – their own residential prices may soon drop.

The solar energy market in China is expected to witness rapid growth as well. With the country facing a continuous shortfall in the supply of conventional sources to meet the increasing demand for energy in recent years, the focus is shifting from conventional to renewable energy sources. The government of China is actively involved in the development of the renewable energy sector. Chinese Government has launched a distributed solar photovoltaic and rooftop solar photovoltaic programs. China is also focusing on the construction of solar power plants with the view to sustain its position in the highly competitive market. Photovoltaic technology has grown over the past decade in China and is on the way to become a major source of power generation.

Sources:

http://www.mass.gov/eea/energy-utilities-clean-tech/renewable-energy/solar/about-solar-energy.html

http://energy.gov/articles/celebrating-completion-worlds-largest-concentrating-solar-power-plant

http://www.usatoday.com/story/money/business/2014/05/10/solar-embraced-by-corporate-us/8895671/

http://solarenergy.net/News/germany-solar-storage-solar-panels/

http://etvfutures.com/solar-energy-in-china-2014-new-research-report-available-at-fast-market-research-9352/

Solar Cell Lab

During this experiment, we were given a solar cell in order to understand the relationship between light intensity and the voltage output of the solar cell. We also to explore the relationship between the wavelength of light and the voltage output of the solar cell. Before beginning the experiment, my partner Bryan and I made two hypothesizes. First, we predicted that as we increased the distance between the flash light and the solar cell, then the voltage output would decrease. We also made a prediction that a higher wavelength (for example; red)  would have a higher average voltage compared to lower wavelengths ( for example; blue ).

We began our experiments by testing the relationship between voltage and distance. We decided to test distances by increments of 2 cm. First we placed the solar cell face down that way it had no light exposure. Next we placed the flash light directly on the solar cell (0 cm distance). After that we used a ruler to measure how high to hold the flashlight from the solar cell. For each distance we held the flashlight in place for 10 seconds.

image 1

We used excel to calculate an average voltage for each trial. Below is a table with a corresponding graph of our finding for Voltage vs. Distance.


Distance (CM)    Average Voltage
0 (face down)    0
0    0.407417
2    0.385606
4    0.359946
6    0.335569
8    0.334286

image


In conclusion, our original hypothesis was correct. As we increased the distance of the flashlight from the solar cell, the average voltage output decreased.

For the second part of our experiment, we were giving four different colored film filters (red, yellow, green, and blue). For each trial we would place a different colored film on top of the solar cell and then place the flashlight directly on top for 10 seconds.

photo


We used excel again to calculate the average voltage for each color we tested. Below is a table of our data and a corresponding graph.


Color    Average Voltage
Blue    0.330437
Green    0.3544814
Red    0.357812
Yellow    0.386889


image-1

In conclusion from our data in this experiment, we discovered that higher wavelengths have a higher average voltage. Yellow being the highest, followed by red then green. Our hypothesis was fairly right in this experiment; the color blue (lower wavelength) had the lowest average voltage. Blue is one of the lowest wavelengths.

Overall, I really enjoyed this experiment because it was an interesting way to learn about solar cells.  Bryan and I learned from this activity that the farther away a light source is from the solar cell, the less voltage output. Also that colors with higher wavelengths on the spectrum, such as yellow and red have a high voltage output as well. This experiment was interesting because you can compare our results and relate them to actual renewable solar energy sources.

 image2

Generator Lab

During this experiment, we explored Faraday’s Law which states that changing magnetic fluxes through coiled wires would generate electricity. We were given a tube which had a magnet inside that was able to move back and forth through a coil of wires. The greater the magnetic flux, the greater the currents and voltage – the faster we shake the tube, the more voltage we will generate.

Using lab view, my partner and I preformed three trials where we shook the tube at different speeds. For each trial, we would shake the tube at a constant rate for 30 seconds for three trials. These three trials of constant shake speed would count as one larger trial. We tested three different shake speeds – fast, medium, and very slow. My partner shook the tube while counting how many shakes he made during the trial while I timed him and informed him of when to stop.

Below is a table of our data that we collected. The table includes the sum of the squares of the voltages we got through lab view. To calculate the sum of the squares we just calculated the sum of all the voltages we got during our trials. We calculated this through Excel.


Sum of Squares of Voltage (Power)    Number of Shakes
0.425070219   71
2.138   73
2.532   71
8.553   99
10.169   110
13.049   113
1.844   50
0.465343974   48


So, the first three trials were when we shook the tube at a medium speed (71, 73, 71 shakes) the next three trials were when we shook the tube at a fast speed (99,110,113 shakes), and the last two numbers on our table represent our third trial at a very slow rate (we got 50 for two trials, and then 48 shakes). Although our numbers turned out much smaller than what other students collected in their experiments, our graph shows the trend which was expected in our hypothesis.


photo

In conclusion from our data and graph, we found that as we shook the tube faster, the amount of power generated (voltage) went up. The faster the magnet travels through the tube through the coiled wires, the more voltage it generates.

This lab was an interesting way to learn about power and voltage. We were able to generate power ourselves by shaking a tube. Once again, my partner Bryan and I cooperated well during this experiment. It was a little more difficult to get going on this experiment though due to technical difficulties and our equipment wasn’t working right off the bat. Once we figured everything out, we were able to perform the experiment smoothly and had a good time with it again.