Last week, I had a chance to see and join in the other group’s experience for the final project. There was only one group that I could collect enough information to write about. It is the group of Heba, Richard ad Nicholas. They worked on an experiment to determine the specific heat values of several different material, by utilizing the specific heat formula. In this experiment, they used 4 materials to determine heat values: aluminum, white quartz, gray granite and glass.
First, they put each material on a digital scale to measure the mass of each.
Second, they poured 100mL of water into a beaker, and measure the temperature initial of water using a thermometer.
Third, they put each material on a hot plate, and keep heating until the temperature reached 72 °C by using a thermocouple
Next, they put each material into a beaker of water.
Then, they used the thermometer to measure the temperature final of water
Finally, we wrote down everything and began the calculation.
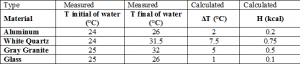
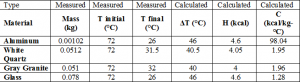
After we finished calculation, we came up with these tables of date.
Overall, it seems like the aluminum getting more heat than the others. I really enjoyed in watching the other group’s experiment because they are very interesting and creative. Hopefully, we can work together in the future for those kind of project.
Purpose of the experiment: To see if the temperature over time inside the tower has an effect on the movement of the pinwheel.
Hypothesis: Will the temperature over time inside the tower affect the pinwheel moving faster?
Background: Solar Updraft Tower is a renewable-energy power plant for generating electricity from solar power. The model solar updraft tower was constructed in Turkey as a civil engineering project. It is a project that use sunshine to heat up the temperature and create a solar energy. Sunshine heats the air beneath a very wide greenhouse-like rooted collector structure surrounding the central base of a very tall chimney.
Power output depends on two primary factors: collector area and chimney height. The collector area is a place to collects and warms a greater volume of air to flow up the chimney, and the chimney height will the increase the pressure difference via the stack effect (a movement of air into and out of buildings, chimneys, or other containers).
Solar Updraft Tower works by the hot air temperature. The air is heated by the sun under a large translucent roof (greenhouse effect). Due to the chimney effect, the heated air is then sucked in by a central vertical cylindrical tube. The updraft wind, thus created, drives turbines with generators and so generates electricity (as the picture below)
In this project, we apply the same process like this in a similar way. Because we won’t able to produce a large energy so we do not use turbines and collector are. However, we tried to create a simple solar updraft tower in an creative way. After getting enough information and materials, we came up with this idea for our mini solar updraft tower.
Material: a scissor, a short wire, 3 cans, tape, mini multicenter, hot plate, 2 corner brace zincs, a pinwheel.
Set Up:
Put 3 cans on the top of each other, and use the tape to wrap around them.
Wrap 2 corner brace zincs on the bottom of the cans tower. Make sure that the bottom of the cans cannot touch on the hot plate
Use paper and make it into a corn, then insert into the bottom of tower
Bend a wire, and stick the pinwheel on the top by tape
Wrap the that wire both side of the top can (as the picture below)
Make a small hole in the middle of cans tower to insert the mini multimeter
Place the whole tower on the hot place
Open mini multicenter and set it at Fahrenheit degree
Open hot plate and mark up on the pinwheel to count how many rotation it move at the different temperature.
How does it work?
The air enters the base of tower and is heated by the hot plate. The hot plate will will heat up the air and increase the air speed. Air movement drives at the base of the tower to generate renewable electricity. Finally, the hot air naturally rises up to the tower and it called “updraft effect”. In the video below, we tried to test at different temperature in 1 minutes for each, and the pinwheel moved around 3.5 rotations at 170°F.
Result:
As the result, we can say that at the high temperature, the air’s speed will increase and pinwheel will move faster.
Conclusion:
Overall, we were successful in proving our hypothesis is true. Even though we had a hard time in collecting data, and the experiment did not run very well, we still figure out that the air’s speed will increase, and the pinwheel will move faster at high temperature.
On another hand, we had some issues during experiment. First, we couldn’t prepare the materials the first week so we were a little bit behind. Second, we changed our ideals too much when the experiment fail one or three time. Instead of dealing and figuring out the problem, we changed ideals and materials and it took us amount of time. It is going to be a lesson for us if we have any chance to work in any project like this in the future. Finally, the pinwheel moves very slow at a highest temperature on the hot plate because we do not have any fans or pinwheel at collector area to collect the air and create wind. That is why the number of rotation we got really small even though the temperature was really high. If we have a chance to work together again, we will try to finish everything as soon as possible because we do not know that whether the experiment works well or not.
I met my teammate during class, and we discussed about some ideas for this final project. However, we did not have enough members in our group so we could only think of one ideas for experiment. It is parachte. Nevertheless, I found out two more ideas that we can think about before making any final decision.
Parachute
We might try to test about how quick or slow two objects will fall down at the same time with diffent shape, mass and distance.
Leak – Proof Bag
This expriment need a zipper bag, two pencils, and water. First, we pour the water inside the bag. Then, we close the zipper on the top. Next, stab the pencils slip between the bag. The water inside the bag will not tear out when two pencils go through.
Solar Updraft Tower
Using three large, empty, clean cans with top and bottom removed. Put three of them on top of each other. The wire arch is taped around the opening to. Then make a pinwheel by paper and stick it on the top of wire arch. But this tower at place where it can catch most of sunlight. When it can reach an amount of energy, the pinwheel will work (as video below)
Conclusion
I chose three different experiments in different topic, but they are easy for us to build an experiment and collect data. I really to to search for some innovation experiment today but they are impossible for us to work on. Hopefully, we can work well on one of this.
While doing this kind of experiment, students support to learn and understand the relationship between light intensity and the voltage output of the solar cell, as well as the relationship between the wavelength of light and the voltage output of the solar cell.
Plug the NXT adaptor to NXT with light sensor through a USB cable (code number 1)
Connect voltage probe to a solar cell by cables (red-red) and (black-black)
Connect USB cable between computer and NXT with light sensor
Experimental processes
1) Measure voltage output by light intensity at different distances
Open Labview
Put Solar on top of flashlight which is zero distance.
Use ruler to measure the distance between flashlight and solar cell.
Choose 4 more different distances to measure
Press START on the Labview program to record the voltage ouput
At the first experiment, we only got 10 numbers of data for each test
Open Excel File after each test to calculate the average those ten numbers to get one final result.
To calculate average, we tried to get the sum of 10 numbers then divided by ten.
For example : (0.39587 + 0.34455 + 0.33172 + 0.42153 + 0.31889 + 0.33172 + 0.33172 + 0.37021 + 0.38304 + 0.31889)/10 = 0.354814 V
Or you can calculate on Excel Spreadsheet using its functions
Finally, we come up with with this final result for the first experiment
After this experiment, my teammate and I learned that when the flashlight and solar cell are far away from each other, the light will be less power and the voltage ouput will decrease. However, it is a little weird at distance 4 cm and 6 cm where the voltage output increase and decrease at distance 8 cm. Over all, we got a nice graph and data.
2) Measure voltage output by light intensity at the same distance with different colored film filters
Open the labview program
We chose 4 cm as the only distance in this experiment
There is 4 colored film filters: orange, light blue, dark blue, and light purple
Put each of them in front of the flashlight for each test.
Press START to record the data
Open Excel Spreadsheet and calculate average of 10 numbers for each color as what we did in the first experiment.
Finally, we came up with this result for the second experiment
In this experiment, we made a mistake at the first test. We though that it would come up 10 numbers each time as what we did in the first experiment. However, the numbers countinued to exceed 10 numbers so my teammate decided to press STOP. It immidiately affected our data. We tried to take the last 10 numbers but I though that we couldn’t get a correct data. Then, we tried to stop at the number 10 for the next test. When we got the average of voltage output for each of colored film filters, I assumed that the voltage ouput would decrease at any ligh colored film filters such as light blue and light purple as what we got.
Conclusion
After doing this kind of experiment, I learned that the voltage output can be afftected by distance and color. When the distance is far away from the light source, the voltage output will also decrease because the light is not powerful and strong at the logh distance. Additionally, even though the light source and solar cell stay at the same direaction for whole experiment, the voltage output still be changed by the different color. When we use dark color, the voltage output will increase and vice versa. It is same situation when we wear black and red in a hot day, we will feel more hot because dark colors can get more temperature and energy than the light one.
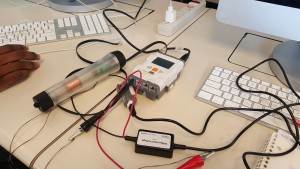
We connect everything to the robot then we plug the USB cable between the robot and computer.
Then, we open the Labview program
This experiment is different from the other one because we did not need to type or calculate any thing before we pressed START.
While one of my teammate pressed START on the program, the other would hold a button on light source with a colored film filters inside.
After that, this teammate would shake it until the data on the program count to 30. While shaking, we had to count the amount of shake.
Every time we did it, we had to open then close the excel sheet. We had 5 times for this experiment.
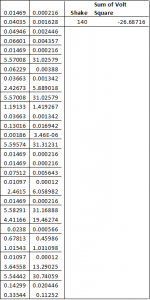
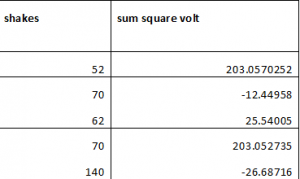
For each time, we had to type the amount of shake and calculated the sum of voltage (30 numbers for each time).
Also, we had to calculate the voltage in square and we only took the voltage which is square from each time for the final result. For example, we have 30 numbers on the last time. We tried to calculate the square each of them. Finally, we plus all of those square number together to get the sum of (voltage)^2
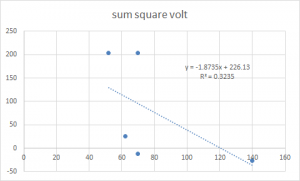
Finally, we came up with this table and graph.
However, it is not similar to what our professor expect for the final result.
Conclusion
The result seems a little bit weird because there is negative and not as same as what professor expect for the final result. I think that it is because I was stop a few second while doing the shake, then the result is not correct at all. For the next time doing this kind of energy experiment, I think that we have to eat breakfast before coming to class to have full energy.
The goal of this activity is studying about Newton’s second law of motion. During the activity, we had been exploring the Newton’s second law, the law of conservation of energy, velocity and acceleration, and power.
For the experiment, we had to use Lego Mindstorm motor to lift weights, a pulley, and the masses.
Experiment process
Plug the USB cable into Lego Mindstorm motor and computer
Balance the motor and masses through a pulley
Then we measure the height from the bottom the the top of pulley. The height is 31.6 cm = 0.316m
Set up a table for 2 tests; 5 times for each.
Open the program in Window software and begin to add number
Press Start to run the motor
For the 1st test, we use the same force with different masses. We chose 50 N for the force, one after another, 0.25 kg, 0.23 kg, 0.21 kg, 0.15 kg, 0.1 kg. Next, we calculated the Potential Energy = mgh. Then we come up with this result
For the 2nd test, we use the different force, 100 N, but in the same masses as the test one from the small to large, 0.1 kg, 0.15 kg, 0.21 kg, 0.23 kg, 0.25 kg. Also, we used the same equation for Potential Energy. After that, we come up with the result like this.
Also, this is a picture and video that show how the process works
Conclusion
Even though we can collect all the data in this experiment, we though that there would be some mistake because the graph is really weird on the second test. Nevertheless, this activity helped us to learn about Newton’s second law and how to use equation to apply in the experiment.
The main goal in this experiment is measuring the distance and speed of the wheel while a lego car is traveling in a certain amount of time. The object that our team used is an lego car which can connect to computer to calculate its distance and speed through a program.
Experiment Process
First, we connected the car to computer through two USB cables.
Second, we opened the VI to record the wheel rotation, distance, and speed.
Next, we used a ruler to measure the radius of wheel.
Then, we found the distance by calculating the circumference of the wheel. (d = circumference)
After that, we entered the information into the VI and began to record the speed
Also, we had to record in two way. One by ruler, and the other is on computer.
Third, we let the can run in a certain amount of time and distance that we already set up on the computer.
Fourth, we used ruler to measure the distance that the car had passed.
Finally, we wrote down the number that we had record by ruler and the one on computer that had been already calculated.
Additionally, we had to do the experiment three tests with the different number of time and power. Also, in each tests, we had to do three times so it would be nine times totally
Calculation
First, we use the equation of circumference to calculate the distance because distance = circumference (d=2pi*r)
Then, we converted from centimeter to meter
Finally, after each test, we would calculate the percentage of error between computer and ruler measuring result.
% error = [|dm-dc|/((dm+dc)/2)]*100
Result
Conclusion
Even though the percentage of errors are still big in our opinion, we felt satisfied with what we did and experienced through this experiment.