Category Archives: Uncategorized

Lab 2: Force and Energy, Velocity and Acceleration, and Power

In this lab we experienced Newton’s second law F = ma, the law of conservation of energy, velocity and acceleration, and power by using the Lego Mindstorm motor to lift up weights with a pulley.

http://sites.suffolk.edu/annavalutkevich/files/2012/02/photo-1-300x300.jpg

First, exploring Newton’s 2nd law. Newton’s 2nd law states that acceleration is produced when a force acts on a mass. The greater the mass (of the object being accelerated) the greater the force needed (to accelerate the object). From the formula F = MA, we can calculate any unknown value as long as we have 2 know values. Below is a simple way to explain the law.


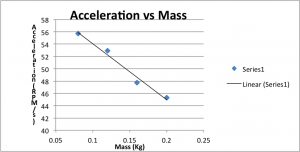
With that being explained, when we kept the power level (force) fixed and changed the mass by 40 g at a time for 3 turns in the experiment, we found out that the acceleration changes inversely proportional to the change of mass. In other words, the smaller the mass the faster the acceleration. A great clarification can be done by using the Excel with the values and graphing the results as shown below.
acc1

Units; Acceleration rpm/s (rotation per minute/ second). Mass kg (kilograms)

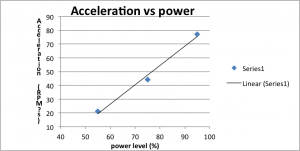
For the second part of exploring this law, we kept the mass fixed and changed the power level resulting in directly proportional changing in acceleration. Therefore, a= f/m has been verified by this following graph.
acc2

Second, exploring the Law of Conservation of energy. Energy in a system may take on various forms kinetic, potential, heat, or light for instance. The law states that energy can neither be created nor destroyed, therefor, the sum of all forms of energy in the system is a constant. For example, a pendulum is commonly used to demonstrate the law.

When the pendulum is pulled leftward, potential energy will be converted to kinetic energy as the to make the pendulum move rightward. The pendulum is going to keep swinging until all of the kinetic energy is converted back to potential energy. Therefore, potential energy PE= mgh where m is the mass, g is the acceleration of gravity, and h is the height.

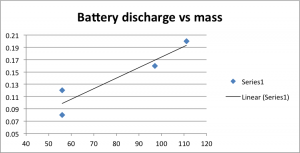
The experiment we did was to determine the battery drainage as a function of mass. As we keep the power level fixed and change the mass, we can notice that the greater the mass the greater battery drainage as shown in the graph below. This is, because the battery energy gets converted to the potential energy of the mass.
batter

Third, for the final experiment, we calculated the average of the power used by the motor in all the trials with the fixed mass and variable power level. The formula used for this calculation is power used= potential energy/time= mgh/time

Power vs power used

In conclusion, in order to give the reader a bigger image of the experiments, below is the excel sheet with all the values.

Speed(RPM) battery discharge Mass(kg) power(%) time(s) acceleration(RPM/s) g (m/s^2) height(m) mgh(j) Power used(W)
0 86.052632 0 111 0 0.2 0 75 0 1.9 0 45.290859 9.8 0.33 0.6468 0.340421053
0 89.346161 0 97 0 0.16 0 75 0 1.871 0 47.753159 9.8 0.33 0.51744 0.27655799
0 92.006901 0 56 0 0.12 0 75 0 1.739 0 52.907936 9.8 0.33 0.38808 0.223162737
0 96.17613 0 56 0 0.08 0 75 0 1.726 0 55.721976 9.8 0.33 0.25872 0.149895713
0 111.265005 0 84 0 0.2 0 95 0 1.444 0 77.053327 9.8 0.33 0.6468 0.447922438
0 57.112996 0 55 0 0.2 0 55 0 2.711 0 21.067133 9.8 0.33 0.6468 0.238583549
0 84.980923 0 83 0 0.2 0 75 0 1.922 0 44.21484 9.8

This lab was very beneficial in a way that allowed us to analyse values and learn important laws of physics in general practically, which I personally always prefer. 


References

http://easycalculation.com/physics/classical-physics/learn-potential.php

http://www.glogster.com/scuther/newton-s-second-law/g-6l1p2i7ggpcp8uq7ig08ga0

http://chemistry.tutorvista.com/inorganic-chemistry/law-of-conservation-of-mass.html


Increasing Gas Mileage

Increasing the gas mileage is important not only for the environment but also for the economy. thankfully, the government is trying to regulate the MPG (mile per gallon) to an estimated 54.5 mpg by 2025 from the current 27 mpg. The proposal introduced by the president calls for a 5 percent annual increase in fuel economy for cars from 2017 to 2025. The gains are more modest for the light-truck category, which includes sport utility vehicles — 3.5 percent a year through 2021, and then 5 percent annually in the next four years. The standards announced four years ago run through 2016, requiring a corporate average of 36 miles per gallon by then. below are some ways the automobile industry is using ti increase mpg.

1- Hybrid electrical vehicles.

HEVs are vehicles that uses internal combustion engine along with an electric motor that runs on energy stored in a battery. These types of vehicles are not considered all- electric vehicles because they cannot be externally recharged and instead they are recharged with power from the internal combustion engine and regenerative brakes. However, the only disadvantage of HEVs that they are expensive, but technically speaking this increase of cost can be retrieved from gas savings.

2- Plug-in hybrid electric vehicles.

Toyota Prius is an example of PHEV. This type of vehicles basically use electricity from batteries installed in the car for a certain distance until discharge. A driver can travel 10 to 15 miles without using gasoline, after that the vehicle will revert back to the normal hybrid mode running on gasoline with the efficiency gains typical of a hybrid. In other words, PHEVs are used to increase mpg. To clarify, if the standard mode is 45 mpg and you typically drive 20 to 30 miles before a recharge, you will do half on the batteries and half in the normal Prius mode, so the standard mode will get you 90 miles per gallon as a PHEV.


References

Beyond Smoke and Mirrors by Burton Richter.

http://www.nytimes.com/2011/07/29/business/carmakers-back-strict-new-rules-for-gas-mileage.html?pagewanted=all&_r=0

http://en.wikipedia.org/wiki/Battery_electric_vehicle

http://www.afdc.energy.gov/vehicles/electric_basics_hev.html


Robotics activity

My classmate Abdulrahman and I were given robot parts to build according to the instruction in one class, and we had to make it moving backwards and forwards . In the next class, we continued working on the robot we built to perform certain tasks.  Lecture was given on distance, velocity, and acceleration. One of the most important tasks was to connect the robot to the PC and program it in order for it to perform. We measured the circumference of the wheel, which was 0.1760m, to determine how far it can travel in one complete rotation of the turn.  By programing the robot different numbers of power due a constant time, the results of rotation, number of wheel turns, velocity, and distance will change directly proportionally. The following table illustrates the relationship previously described.


Power

Rotation 1

Rotation 2

# Of wheel turns

Distance

Velocity

75

558

567

1.55

0.2728 m

0.2728 m/s

50

348

353

0.967

0.1701 m

0.1701 m/s

25

145

147

0.4026

0.0709 m

0.0709 m/s


Time= 1s

Circumference of the wheel= Pi* wheel diameter = 0.1760m


With time being constant at 1 second, velocity and distance are always equal according to the famous formula: velocity= distance/time.


Conclusion, although it was more of entertaining activity, it was very informative and encouraging in way that connects my preference in doing physical work with physics.

Sawyer Library Tour

On Thursday 19th, the class went on a tour to the Sawyer library. We were introduced to several services at the library such as the circulation and reserve desk and the reference desk, which are very essential for a library to have. The three-floor Sawyer library has numerous study group rooms and the students are provided with computers and printers.

Circulation and reserve desk provides students the opportunity to borrow text books for 20 minutes at a time. Reference books can be borrowed and taken out of the library for a period of time. This desk is a huge source for students to get their questions answered regarding their study and search. Our tour guide from the reference desk demonstrated all the possible ways to search using the computers in the library. By entering a title or keyword of a book, report, or journals, we are able to find an enormous amount of information from the list of sources the university supplied. For instance, Library catalog option allows students to view all of Suffolk University library on the screen. Databases by subject is a gate to find any subjects or articles , which the library provides associated with EBSCO Host.

Overall, regardless of all the services provided, the library is environmentally prepared. Personally, I’m more productive at the library than at home considering the study.

Hurricane Sandy

Was Hurricane Sandy made worse by global warming? It is more controversial then we’d think. Sure, the Hurricane was one of the worst in the 20th century. When we try to determine whether or not the Hurricane Sandy was intensified by global warming, we have to analyze and understand the how it was created. Many scientists blamed global warming and many others said the opposite.

Since the hurricane was a meeting point of tropical warm waves and cold waves, it is conceivable to say that global warming is a reason for warmer waves, which indicates the rise of the tides and the destructive energy held by them. Sea level is an important factor where it has risen in the past few years. On the other hand, some scientists have proven that global warming might alter atmospheric conditions so that future hurricanes may be pushed away from the East Coast.

From my perspective, Hurricane Sandy might’ve been affected by global warming, but we also could say that future hurricanes would be less severe by the effects of global warming.


References,

http://www.nasa.gov/mission_pages/hurricanes/archives/2012/h2012_Sandy.html

http://en.wikipedia.org/wiki/Hurricane_Sandy

http://news.nationalgeographic.com/news/2013/09/130902-hurricanes-climate-change-superstorm-sandy-global-warming-storms-science-weather/