Pandora’s Promise

images

Pandora’s Promise is the highly anticipated and debated new 2013 documentary film by acclaimed documentary filmmaker Robert Stone. Its central argument is that nuclear power, which has historically been opposed by environmentalists, is actually a relatively safe and clean energy source. In the next few decades, humankind will need to double, or even triple energy production as billions of people in the developing world lift themselves out of poverty and begin to live modern lives. Unless the source of this new energy is clean and non-CO2 emitting, the risk of triggering a devastating global climate catastrophe is all but certain. The magnitude of this dilemma, and the limitations of commonly proposed solutions, have left the mainstream environmental movement teetering between apocalyptic thinking and utter disarray. Plunging headfirst into this challenge comes PANDORA’S PROMISE. Three years in the making and filmed on four continents, this meticulously researched and beautifully crafted film asks whether the most viable option we have to tackle climate change might be the one technology we fear the most: nuclear power.

Operating as history, cultural meditation and contemporary exploration, PANDORA’S PROMISE aims to inspire a serious and realistic debate over what is without question the most important question of our time: how do we continue to power modern civilization without destroying it?


Citation:

http://www.rottentomatoes.com/m/pandoras_promise_2013/

https://www.google.com/search?q=Pandora’s+promise&source=lnms&tbm=isch&sa=X&ei=2TWqUp2IE6jKsQSTtYK4Cw&ved=0CAkQ_AUoAQ&biw=1050&bih=585#facrc=_&imgdii=_&imgrc=6-Of7eXkJUW1rM%3A%3Bzfk4oH4HmVwTAM%3Bhttp%253A%252F%252Fwww.mountainfilm.org%252Ffiles%252Fimages%252Ffilms%252Fpandora_image_02.jpg%3Bhttp%253A%252F%252Fwww.mountainfilm.org%252Ffilm%252Fpandora%2525E2%252580%252599s-promise%3B400%3B225

http://en.wikipedia.org/wiki/Pandora’s_Promise

Keystone XL Pipeline

What is the Keystone Pipeline?

The Keystone XL Pipeline Project is a proposed 1,179-mile (1,897 km), 36-inch-diameter crude oil pipeline, beginning in Hardisty, Alta., and extending south to Steele City, Neb. This pipeline is a critical infrastructure project for the energy security of the United States and for strengthening the American economy.

KeystoneXLOilPipeline_update


The Keystone Pipeline debate:

Five years ago this week, a Canadian company proposed building a pipeline to send heavy crude oil from Alberta to U.S. refineries. Although the Obama administration’s answer on the Keystone XL pipeline is not expected anytime soon, politicians in Washington and Canada are ramping up the pressure for the project, while environmentalists are pushing hard against it.

The intense focus on the decision reflects the fact that the Keystone XL pipeline has become a proxy for the larger debate on climate change emissions. The heavy crude the pipeline would carry has a substantially bigger greenhouse gas footprint than conventional crude.

This summer, President Obama said he wouldn’t approve the Keystone XL if he determined that it would exacerbate climate change.

Still, many politicians in the U.S. and Canada tout Keystone as a job creator and crucial tool for making North America energy independent.

A new measure being debated in the Senate would declare the Keystone XL in the national interest, although it would not force the president’s hand.

The measure hasn’t come up for a vote yet, but its prospects are good. Some Democrats have joined Republicans as co-sponsors.

“And why we would not build this pipeline to make sure this oil from a great partner is refined in the U.S. rather than focusing on oil in countries that do not like us, makes no sense to me,” Sen. Mark Begich, a Democrat from Alaska, said in a Senate debate last week.

The 875-mile pipeline from Canada would end in Nebraska. But it would hook up with pipelines that stretch to the Gulf Coast. The southern portion of the original Keystone XL proposal is 90 percent finished already. It stretches from Cushing, Okla., to the Gulf Coast and did not need presidential approval because it does not cross an international border.

Most of the oil flowing through the Keystone would be heavy crude from Alberta, Canada. But light crude from the Bakken formation in Montana and North Dakota could also flow through it.

Sen. Heidi Heitkamp, a Democrat from North Dakota, defends Canada’s production of tar sands oil. “This is not some rogue country that doesn’t have … environmental standards,” she says.

Oil producers in Alberta do pay a tax for their carbon pollution, which helps fund pollution control equipment. And the oil companies are researching cleaner technologies.

Oil from tar sands has a higher greenhouse gas footprint than conventional crude because it takes so much energy to get the tar sands oil out of the ground and refine it so it can go through a pipeline.

According to the U.S. Environmental Protection Agency, Canadian tar sands oil can lead to 30% more greenhouse gas than conventional oil, if you count emissions from all the products that come from the oil.

The EPA also warns that spills of tar sands oil are much tougher to clean up. A spill of this heavy crude into Michigan’s Kalamazoo River three years ago is still being cleaned up.

Sen. Barbara Boxer, a Democrat from California who heads the Senate environment committee, has criticized her colleagues for failing to see that the pipeline is not in the national interest.

“Now you’d have to be asleep for 10 to 15 years to not believe that carbon pollution is dangerous to the planet,” she says.

Earlier this year, in a draft environmental analysis of this project, the U.S. State Department concluded that Canada will develop its heavy crude with or without Keystone, so the pipeline wouldn’t have a big impact on greenhouse gas emissions.

Energy analyst Jackie Forrest, from IHS Cera, says she agrees that rejecting the pipeline would not have a big impact on greenhouse gas emissions.

Now personally I say that for the benefits behind this project the U.S. should accept it if and only if they and the Canadian government put as much effort into securing the environment surrounding the project as they put into the project itself.

Citation:

http://www.npr.org/2013/09/16/222958546/climate-change-concerns-slows-debate-over-keystone-xl-pipeline

http://keystone-xl.com/about/the-project/

Demand Response

Demand Response entails customers changing their normal consumption patterns in response to changes in the price of energy over time or to incentive payments designed to induce lower electricity use when prices are high or system reliability is in jeopardy.”

Box_2

Considering this ‘official’ definition of Demand Response (DR), we can safely assume that DR is directly related to price changes in the cost of energy and how the consumers respond to it. DR encompasses numerous programs created to maintain energy consumption in check especially during peak-hours or the “FERC (Federal Energy Regulatory Commission) definition of DR covers the complete range of load-shape objectives and customer objectives, including strategic conservation, time-based rates, peak-load reduction, as well as customer management of energy bills.”

To be in balance, the supply-demand curve needs that at any point when the demand increases the supply mechanism should provide a matching amount of energy. With a price-volatile energy market, at times such excess amounts could be very expensive or even unavailable. Hence the role of Demand Response in such circumstances is crucial because it adds reliability and more control over the prices.

There are two types of Demand Response:

1- Emergency Demand Response

In emergency cases like unusual cold or hot weather, when the amount needed to be supplied to the increased demand is not available, then the electric utility providers call on their emergency programs. This translates into minimal usage of energy from commercial and industrial consumers, levels of which are previously defined. Such measures prevent a considerable power outage which could have cost much more than merely reducing the electric usage to a minimal functioning level, consequently making the electricity more reliable and cheaper.

2- Economic Demand Response

The programs in this category help the utility providers help consumers to reduce costs. In a nut shell, even though we, the customers, generally pay a flat rate for kWh, the utility providers pay a fluctuating price throughout the year. The cost that is transferred to consumers is the average price that providers pay, therefore placing the amount of energy consumed directly related to the cost per unit that we use. Economic Demand Response runs programs that provide some incentives to the consumers if they use energy during off-peak hours, or by placing time-based pricing (higher cost rates) to the ones that use it during peak times.

DR programs allow for users to be more aware of their energy consumption and the real-time prices, therefore leading to more educated decisions in how, when, and at what cost and time is more feasible to use electricity.

To conclude, I think it is interesting to know about what the electricity system is going to be in the future.

Screen-shot-2011-06-24-at-9.19.53-AM


References

http://esm.versar.com/pprp/ceir16/Report_2_1_0.htm

National Action Plan for Energy Efficiency. www.epa.gov/eeactionplan

 ELECTRICLIGHT&POWER, What is Demand Response? By Dr. Steve Isser, Good Company Associates, June 2009

 http://www.energydsm.com/demand-response/

4- Demand Response and Smart Grid Coalition

http://www.drsgcoalition.org/resources/factsheets/Demand_Response_and_Energy_Efficiency.pdf


Tom Vales Presentation

In class, Tom Vales introduced us to some amazing devices. Some of these devices were invented in the 18th century. The purpose behind some of them was mainly to generate electricity. It is really interesting for me to see how the development of making generators has become from the past up until the present. It is very crucial for every electrical engineering student to have knowledge about these various electrical inventions.

The most interesting device in my opinion was the Mendocino Motor.levit8c

There is a magnet on the base of the motor (under the armature) that provides a vertical magnetic field for the part of the coil that is closest to the base. This magnetic field, combined with the current flowing through the coil closest to the magnet, generates the rotational force.

This motor, like many DC motors, has a requirement that the current flowing through the coil reverse itself every 1/2 rotation. This solar motor works by having the solar panels automatically reverse the current in the coil as it rotates.

It does this by having TWO solar panels for each coil. The panels are on opposite sides of the armature so that when one is on top, the other is on the bottom.

When one panel is illuminated (the panel on top) the current flows clockwise. When the other panel is illuminated (because it rotated to the top), this second panel drive current through the coil in the opposite direction as the first panel.

The easiest way to understand this is to look at the simple schematics picture. It shows two solar cells (panels) connected to the coil.

One implication of this design is that if both panels are illuminated equally (light coming from above and below), the motor will not spin at all. Can you see why? All of the current flows in a circle around through the cells, with no current flowing through the coil.

schematic_fat.jpg.w180h445

Another invention was the Tesla Coil. 

OLYMPUS DIGITAL CAMERA

A Tesla coil is an electrical resonant transformer circuit invented by Nikola Tesla around 1891. It is used to produce high-voltage, low-current, high frequency alternating-current electricity. His invention of the alternating current motor set the stage for the power and lighting systems now used every day around the world.

References

http://en.wikipedia.org/wiki/Tesla_coil

http://www.chessplayingrobot.com/id4.html


President’s Climate Initiatives

President Obama has announced, “So today…I’m directing the Environmental Protection Agency to put an end to the limitless dumping of carbon pollution from our power plants and complete new pollution standards for both new and existing power plants.” This is the first proposal in the President’s new climate initiative. The President also called for expanded efforts to use clean energy” and for the US to lead the world in bold actions to “combat climate change.”

Investing in Clean Energy is one of the initiatives. It is an obvious way to reduce greenhouse gas emissions. By changing the way we use sources to produce energy, we will cut down the rate of greenhouse emissions by a big factor. It’s understandable that shifting to a clean energy costs the government a big amount of money, but this money goes to ensure long-term sustainability.The Administration focused on four areas, including energy sector reforms that are preconditions for sustainable clean energy development, energy efficiency, low carbon energy, and clean transport.

Promoting Sustainable Landscapes; to help countries that put forward ambitious programs to reduce greenhouse gas emissions from deforestation and forest degradation (REDD+), the United States announced it would dedicate $1 billion over 2010-2012 as part of the U.S. contribution towards the “fast start financing” reflected in the Copenhagen Accord.

One of the important initiatives is increasing fuel economy standards. Greenhouse gas emissions are not only produced when generation energy but also when using this generated energy in different ways. For example, in the transportation sector, heavy-duty vehicles are the second largest source of greenhouse gas emissions. The Obama Administration set the first-ever fuel economy standards for Model Year 2014-2018 for heavy-duty trucks, buses, and vans. These standards will save 530 million barrels of oil. By setting new standards and reducing fuel consumption, transportation sector will produce much smaller greenhouse gases. The efforts will continue to improve the efficiency of moving goods around the country.

I personally think, for more reduction of emissions, the developed countries need to join efforts to be environmentally friendly. As we all know that a single hand can’t clap.

References

http://www.whitehouse.gov/sites/default/files/image/president27sclimateactionplan.pdf

http://www.whitehouse.gov/sites/default/files/Climate_Fact_Sheet.pdf

President Obama’s Climate Initiative—The Bad News and Good News


MIT Nuclear Reactor Laboratory (NRL)

When the tour was announced, I felt a great deal of excitement although it seemed a bit scary at first. This tour had been on the list since I opened up to the world academically , fortunately, I hadn’t been able to explore the NRL as an individual for security restrictions. So, it was a great chance for me to go with the class. The exploration was divided mainly to a lecture and a field walk. After the security check, we were asked to wear radiation detectors that looked like pens with two optical openings on both ends and a scale measurement inside of it.

One of the important information is that the NRL is meant for commercial use and energy production. It’s used only for scientific experiments. Although in the past the NRL used to treat cancer via a procedure called Boron Neutron Capture Theory and was one of the best at it, the NRL has stopped this procedure due to a lack of doctors. However, it’s enough for the NRL to be the hope to improve nuclear reactors of the future. As far as sustainability is concerned, greenhouse emission reduction is a regarded by the researchers.

It was essential for me to know hoe the reactor works. As the lecturer explained, there are two methods of nuclear reactions one of which is nuclear fission of uranium atoms, which is the one used here. An nuclear fission is illustrated by the picture below.

fission

In the nucleus of each atom of Uranium-235 fuel are 92 protons and 143 neutrons, a total of 235 particles so fantastically small that their size is difficult to imagine. Around this nucleus whirl 92 electrons, which are even smaller particles. If the nucleus were as big as a baseball, an electron on its outer rim would be a mere speck nearly a mile away.

The arrangement of particles within uranium is unstable and the nucleus disintegrates easily. When the nucleus absorbs an extra neutron, it breaks into two parts or splits. This process is known as fission (see diagram below). Each time a nucleus splits, it releases two or three neutrons. Hence, the possibility exists for creating a chain reaction.

The rate of fissions in the uranium nuclei is controlled chiefly by six control blades of boron-stainless steel which are inserted vertically alongside the fuel elements. Boron has the property of absorbing neutrons without reemitting any. When the control blades are fully inserted, they absorb so many neutrons from the uranium that there are not enough to cause a chain reaction. To put the reactor into operation, the control blades are raised very slowly. As they absorb fewer and fewer neutrons, more and more neutrons are available to cause the splitting of uranium nuclei, until finally enough neutrons are being released to sustain a chain reaction.

In addition to the fuel and control blades, one other factor is essential to the operation of the reactor. This is a moderator-coolant, which is ordinary or “light” water in the case of the MITR-II. Since uranium nuclei do not readily absorb neutrons moving at the high speeds with which they leave fissioning nuclei, it is necessary to slow them down with a “moderator”. For this purpose about one-half the volume of the reactor core consists of water.

One of the fascinating things was the control room. It is a room that filled up with monitors and switches and in this room you can keep track of everything happening in the reactor. The word SCRAM was used all around the reactor. This word stands for Safety Control Rod Axe Man, which is an old method used to shut down the reactor.

References

http://web.mit.edu/nrl/www/reactor/fission_process.htm

Team Brain-Storming 1

In my team meeting, we went though what we want to present to the high school students. First consideration was to choose an experiment to perform in front of the students. We finally settled on falling objects experiment. This experiment combines Newton’s second law (F= m*a) with wind resistance (drag) in order to relate our project to sustainability. We will be using NXT with two sensors placed in the starting placed and the end place which is the ground. The results we are trying to get are the velocity, acceleration, and time of the falling objects. We divided the work to three parts as to save time. Each part was given to two or one of our team members. Wind resistance is the main point behind the experiment because it is relevant to both the experiment and sustainability.

Solar Cell Lab

Solar cells are in fact large area semiconductor diodes. Due to photovoltaic effect energy of light (energy of photons) converts into electrical current. The term “photovoltaic” comes from the Greek φῶς (phōs) meaning “light”, and from “Volt”, the unit of electro-motive force, the volt, which in turn comes from the last name of the Italian physicist Alessandro Volta, inventor of the battery (electrochemical cell). The term “photo-voltaic” has been in use in English since 1849.

Solar cells produce electricity in three steps;

  1. Photons in light hit the solar cells and are absorbed by semiconducting materials, such as silicon.
  2. Electrons (negatively charged) are knocked loose from their atoms, causing an electric potential difference. Current starts flowing through the material to cancel the potential and this electricity is captured. Due to the special composition of solar cells, the electrons are only allowed to move in a single direction.
  3. An array of solar cells converts solar energy into a usable amount of direct current (DC) electricity.

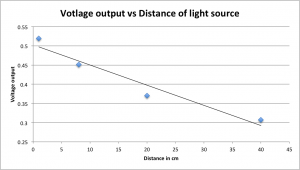
In this lab, we discovered the relationship between a light source and solar cell. In two different experiments, we measured the voltage output of the solar cell. In the first experiment, using a flashlight and solar cell connected to the NXT in order to measure the voltage output, we placed the light source in different distances and measured the voltage output of the solar cell. It was noticeable that the further the light source the lesser the voltage output. In the second experiment, the distance of the light source was kept constant and we changed the light color using colored filters. Therefore, the voltage output varies because of changing the color of the light leads to changing in the energy of the photons according to the following formula:

photon energy equation

Where E is the energy of the photon, h is Planck constant (6,626·10-34Js), λ is the wavelength, and c is the speed of light.

Experiment (1)

The main point of this experiment is to determine the relationship between the solar cell and the light source in terms of the distance. Basically, if the light source is placed far from the solar cell, the light intensity becomes smaller resulting in smaller voltage output. The graph below illustrates the relationship.

Untitled

Therefore, we can conclude that the voltage output is inversely proportional to the distance of the light source.

Experiment (2):

For this experiment, we had to figure out the relationship between the wavelength of light and its energy of the photons. As stated before by the equation, the energy of the photon (E) is inversely proportional to the wavelength. Therefore, light consisting of high energy photons (such as “blue” light) has a short wavelength. Light consisting of low energy photons (such as “red” light) has a long wavelength. Below is a chart demonstrating the voltage output of different colored filters.

Untitled


The data from the chart proves the voltage output from a red light is smaller than the one from a blue light.

References

http://www.pvresources.com/introduction/solarcells.aspx

http://en.wikipedia.org/wiki/Solar_cell

http://www.pveducation.org/pvcdrom/properties-of-sunlight/energy-of-photon


MOS Trip

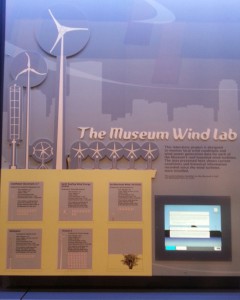
The class went on a trip to MOS museum to study wind,  solar energy and investigate the exhibit. What captivated me at the beginning of exploring the museum was the electricity section since I’m an electrical engineering student. Fortunately, the timing was perfect for me to attend the breathtaking presentation of the electricity exhibit. As I walked into the section there was a guide explaining the exhibit to the audience. The guide introduced Nikola Tesla’s invention.  His invention of the alternating current motor set the stage for the power and lighting systems now used every day around the world. We also were introduced to Faraday’s cage shown in the picture below.

We were shocked when the guide was absolutely confident as walking into the cage that nothing would happen to him. Surprisingly, not even a single lighting went into the cage. As he explained, it is because the cage’s wall is conductive so that when the electricity hit it, it will be absorbed by the cage’s wall and prevented from going inside. So, the guide proved that staying in the car while a lightning storm is actually safe. Another experiment that dazzled my eyes, there were two adjacent conductive poles with ring shaped tops. When the guide applied high electricity to the poles, the high electricity could overcome the insulating air so we could see it flowing from pole to pole like lightning. As the guide changed the value of current, certain musical tones were produced. This happens when current is being released pushing the air around it, so our eardrums receive these what we can call waves of pushed air making us hear different tones according to the amount of the released current.

Wind exhibit

The first aspect I explored in this section was the different types of wind turbines and their efficiency. Below is a picture of turbine types that were shown.

Wind trubines-1


And below is a table of the differences;

Turbine Rotor Diameter Tower Height Weight Max Rated Power Annual Max Power # of 15-watt light bulb
Windspire 4 ft no tower;30 ft tall 600 lbs 1.2 kw 10,512 kwh 12
Southwest Skystream 3.7 12 ft 33 ft 170 lbs 1.9 kw 16,644 kwh 19
Swift Rooftop Wind Energy System 7 ft 9 ft 209 lbs 1.5 kw 13,140 kwh 15
Proven 6 18 ft 30 ft 2,769 lbs 6 kw 52,560 kwh 60
Architectural Wind: AVX1000 6 ft no tower;6 ft tall 130 lbs 1 kw 8,760 kwh 10

It is clear that the longer the turbine and the bigger the blades the more electricity we can generate as explained mathematically below.

P=½ρAV³

P= power in watts  ρ = The air density (1.2kg/m³ @ sea level and 20° C

A = The swept area of the turbine blades (m² square meters) 

V = wind speed ( meters per second)

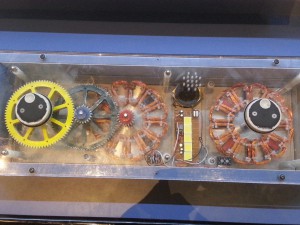
Power of gears also plays an important role in generating electricity. There was an interlocking gears model for us to see how they fit together to form part of the gearbox inside the nacelle of a wind turbine as shown below.

20131031_144528


It is predictable that the right wheel doesn’t require a great force to make it spin unlike the left wheel. If an equal external forces are applied to both wheels and then removed, the left wheels will keep moving for a much longer time than the right wheel. In other words, the deceleration of the left wheels is smaller than the one of the right wheel. That is because the external force that has been applied to the left wheels will be generated even more from the first wheel to the other.

Environmental impacts of wind turbines

While wind turbines have a much smaller impact that fossil fuels, they can affect the environment in different ways such as land use and birds deaths.

Land use

Although each turbine takes up very little space, wind farms require roads and electric substations. Careful selection of locations can minimize the impact. Smaller, building-mounted turbines are also an alternative. Offshore turbines use no land, but must avoid known shipping channels.

Bird deaths

Birds and bats can die in collision with turbines. Power lines, glass-covered skyscrapers, and cats can kill just as many. About 40,000 birds are killed by wind turbines every year, compared with 2,000,000 birds killed from oil spills. Careful consideration in placing wind turbines can minimize this number.

http://www.ask.com/question/what-is-nikola-tesla-famous-for

http://www.windgenkits.com/faq.htm

http://www.mos.org/

Generator Lab and Faraday’s Law

Introduction to Faraday’s law and electromagnetism

Before we start learning this law and electromagnetism, we have to become familiar with the general relationships that exist between electricity and magnetism as follows:

  1. Electric current flow will always produce some form of magnetism.
  2. Magnetism is by far the most commonly used means for producing or using electricity.
  3. The peculiar behavior of electricity under certain conditions is caused by magnetic influences.

Faraday’s Law states that changing magnetic fluxes through coiled wires generate electricity (currents and voltage). In other words, the induced electricity is proportional to the change in magnetic flux, so the greater the change is the more electricity generated. A cupper coil and moving magnet are commonly used to explain the law as shown below.

As the magnet moves back and forth, electricity is being generated because of the following reasons.

  1. A change in magnetic flux. Magnetic flux is a measurement of the strength of the magnetic field, which is calculated by multiplying the average of magnetic field B by the area A it goes through. Given by this equation Φ= B.A and the unit used is the Maxwell.
  2. Whenever we have a change in magnetic flux, we’ll generate an electromotive force (emf) that will create a current going through the coil. This induced current is going through the coil in a direction to minimize the change in the magnetic flux. The way to look at it mathematically is by the following equation.

emf= – the change in Φ/ the change in time. where the negative sign by Lenz law indicates that emf will oppose the change in Φ.

Experiment and procedure

In the lab, we used a generator that works just like the picture above. And by connecting it to a voltage probe to the NXT, we could calculate the voltage output of the generator using Excel sheet. Simply, our experiment was to correlate the number of shakes of the generator, in a thirty second time interval, with the voltages (or more precisely the sum of the square of the voltages) that the generator generates. Now, we did five runs with different number of shakes. We proved that the more shakes the greater the voltage output. In other words, for the induced voltage to be increased, the change in magnetic flux (Φ) has to be increased too. For our experiment, time seemed to play no role, because for each run we had the same time interval (30 s). Below is a graph showing the relationship between the voltage output and the number of shakes.

test6_3549_image001

It is obvious that the more shakes we do the more electricity generated.

Conclusion

This Faraday’s law is very important and helped with a number of applications. For instance, musical instruments. Musical instruments like electric guitar, electric violin etc have a pick-up device attached to them. It consists of a fine enameled copper wire wound on a magnet. When the metal strings of the guitar are strung, the vibrating string cuts the magnetic flux of magnet linking the coil due to which electric current is induced in the pick-up’s coil. It is modulated by the mechanical vibrations of the strings. This electrical signal is then amplified and recorded by suitable devices. In addition the phenomena of electromagnetic induction is also used in instruments and machines like Induction motors, Induction Sealing, Audio video tapes, Hall effect meters, Faraday Disk etc.


http://www.youtube.com/watch?v=qWu82nJS42I

https://www.google.com/search?q=faraday’s+law&source=lnms&tbm=isch&sa=X&ei=BrltUquEJ-354APy7YGQAQ&sqi=2&ved=0CAcQ_AUoAQ&biw=1518&bih=748#facrc=_&imgdii=_&imgrc=0jy-zUMFNM0aOM%3A%3BIZml3mJYTnupZM%3Bhttp%253A%252F%252Fsites.suffolk.edu%252Fekprime%252Ffiles%252F2011%252F04%252Ffaradyanim.gif%3Bhttp%253A%252F%252Fsites.suffolk.edu%252Fekprime%252F2011%252F04%252F05%252Ffaradays-law-with-flashlights%252F%3B321%3B293

http://202.141.40.218/wiki/index.php/Applications_of_Faraday%27s_law

Basic Electricity prepared by the Bureau of Naval Personnel.