Electricity Generation

Coal:

Other than the thing Santa may put in your stocking if you are naughty, coal is a resource found in most countries and mined to create electricity.

Coal fired power plants contribute to about 41 % of global electricity

in the U.S we use about 45% coal for electricity so it is vital to our energy sources

How does coal become electricity?

thermal coal is what is used to generate electricity:

After it is harvested from deposits and transferred to a power station the coal is ground up into fine pieces so it will burn faster and there is more of it. Next the coal is boiled or burnt at high temperatures. This process creates hot gasses and heat or thermal energy, this is then converted to water. Then after purification it is converted again back to steam. The steam is pushed at high pressures through a turbine connected to a generator. When both the turbine and generator are working fast, electricity is generated. high voltages are transferred via power line grids and made consumable for use.

174139cgart

As you can see this process described above can be seen here.

Next is Natural Gas:

Natural gas is a fossil fuel  and comes from the decay of plants and animals when layers of plants and animals are exposed to high temperatures and pressure, similar to a landfill. after about 1,000 years of this process, carbon is formed and harvested for storage. wells are drilled into the ground to remove gas Ex. Fracking. After being harvested, it is transported to be purified of gasses like helium, hydrocarbons, moisture and more.

Power plants use three methods of converting gas to electricity

1. similar to coal production, the gas is heated in a boiler room to produce steam which powers a turbine to generate electricity.

2.the most common approach is natural gas is combusted to make electricity enabling it to be store and transformed into usable power using a combustion turbine. Bellow is a image of that process.

. untitled


3.The third method is called the combined cycle which takes the hot combustion turbines exhaust used in the second approach to then make steam to drive a steam turbine, and creates a higher efficiency.

Nuclear:

provides 12% of the worlds electricity

Nuclear plants much like coal and gas which we have just looked at harvest a product out of the earth then boils it to make steam which drives a turbine generator.

nuclear uses uranium, an isotope which atoms are split.

the nuclear reactor itself is where nuclear power differs from coal and natural gas, thousands of small pellets of uranium oxide fuel makes up the core of the reactor. In the core the uranium splits creating heat and a chain reaction. A moderator like graphite or water, slows down the neutrons so that the power doesn’t get to high and combust.

. nuclear_reactor

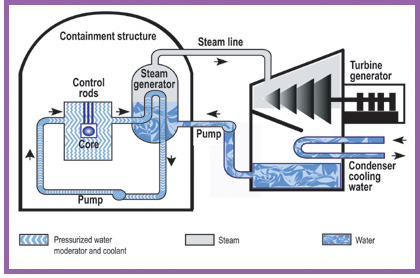
for the most part water is recycled durring this process but due to the radioactive decay durring the process is the main waist from making energy this way.

all three of these methods have a risk to it,

natural gases emit carbon dioxide, but less than the emission of carbon dioxide from the coal burning process.

the use of water in all three of these processes is a major concern, in all three the water is re used but only to an extent many times water can still reach and pollute rivers and lakes even drinking water.

The biggest concern with natural gas is its inability to be renewed in our life time, while the coal supply is also running out, nuclear power is overall reusable. Because of its efficiency is recycling water and the chain reaction used. The main concern for nuclear plants is radiation, to some much scarier and devastating than water or air pollution.

despite these and many more concerns about all the processes, each are making an effort to become more efficient and safe

nuclear is working on assuring the reactor is controlled and there are no accidents with radiation spillage or explosions due to the intense amount of heat and energy being produced

coal is trying to make the process cleaner for the environment by reducing the release of pollutants

natural gas, which does not produce solid waist is attempting to  reduce air emissions and become more renewable

Links:

http://www.worldcoal.org/coal/uses-of-coal/coal-electricity/

http://www.epa.gov/cleanenergy/energy-and-you/affect/natural-gas.html

http://www.world-nuclear.org/nuclear-basics/how-does-a-nuclear-reactor-make-electricity-/


Pully Lab


Exploring newton’s 2nd law: energy that is not created or destroyed

The lab consisted of a pulley with weights of different masses that could be added or removed from the pulley. the system was connected to a computer program that could record our data in a precise way.

the purpose of this lab was to record three sets of data,

The first: Consistent P(power level) where the (M)mass and (A)acceleration changed

P(constant p)=ma

We set our power level consistently at 75

speed/rpm   battery discharge   mass kg   power   time/sec   accel rpm/sec  
0 84.84117 0 69 0 0.2 0 75 0 1.658 0 51.17079
0 79.97257 0 28 0 0.18 0 75 0 1.215 0 65.82104
0 84.79766 0 28 0 0.16 0 75 0 1.252 0 67.72976
0 86.9883 0 69 0 0.14 0 75 0 1.368 0 63.58794

as you can see from this data by changing our mass, the acceleration changed due to the constant power

when mass was added  in kg to the pulley system the acceleration rpm/sec decreased the opposite effect is also true

Second: Consistent (M)mass where the (P)power level was the variable and the (A)acceleration changed.

P=m(constant mass)a

speed/rpm   battery discharge   mass kg   power   time/sec   accel rpm/sec  
0 91.50964 0 41 0 0.1 0 75 0 1.539 0 59.46045
0 58.56471 0 55 0 0.1 0 50 0 2.197 0 26.65667
0 46.78363 0 41 0 0.1 0 40 0 3.135 0 14.92301
0 24.77517 0 55 0 0.1 0 25 0 5.745 0 4.312475

As we decreased the power with the consistent mass of 0.1 kg the acceleration decreased and the amount of time needed for the weight to be pulled to the top was longer.

untitled

Mass is the blue line and is constant, the red shows the acceleration decreasing in a negative correlation as we changed the power levels

Third: we measured the potential energy w=by measuring the mass time grams times height

Po=MGH

our height was .26m

G= 9.8

Our mass was the variable

speed/rpm   battery discharge   mass kg   power   time/sec   accel rpm/sec  
0 37.34324 0 41 0 0.12 0 35 0 4.173 0 8.948775
0 42.61228 0 69 0 0.14 0 40 0 3.481 0 12.24139
0 47.4741 0 55 0 0.16 0 45 0 3.121 0 15.21118

Our first potential energy was .049

Second:  .10

Third: 0.13

We could compare our results to the battery discharge in column two of our data

After we recorded this data and graphed the data points to show the relationship between our variables and constants in the experiment.

In conclusion, this lab showed us how much potential energy and battery power was used to pull the weights at different masses and power levels we also saw what happened to acceleration when power levels stayed the same and when mass stayed constant as well. these data points mapped out on a graph help understand Newton’s second law of motion that energy is neither created or destroyed by showing us how this energy was displaced and used.

The struggles for me durring this experiment was graphing the data points, it was easy to understand the formulas surrounding acquiring the data but less easy to understand plotting the points on a graph. Unfamiliarity with the program  certainly posed a threat to my partner and I durring this experiment. Overall I think I have a firm grasp of the main concepts and Newton’s Law of motion.


Robotics Activity

Durring The Lab we learned about velocity, distance and Acceleration and motion in general

main points of motion are:

Speed: distance traveled per time

Distance: amount / length traveled when associated with speed

Velocity: has direction and speed

Acceleration: time rate of change in velocity


untitled


many of these main ideas have equations associated with them that we had to use in the experiment when determining our percentage of error.

after constructing our robot and attaching the correct wires ( harder than it sounds )

the things we needed to know to determine out percentage of error when running the robot in a straight line with changing the distance measured, number of wheel turns, distance measured by the computer program and the robots velocity.

we changed the power level variable and the amount of time to achieve different results:

the diameter of the wheels of the robot where 1″

the # or wheel turns = rotation % (360 degrees / Rotation)

total distance = # of turns x circumference

velocity =distance / time

the percent of error is the absolute value of the distance we measured minus the distance from the lab computer divided by the average of the distance measured plus the distance from the lab divided by 2 then multiplying that answer by 100.

% of error = Absolute value of the  [ distance measured-lab distance]

——————————————              X 100

average of distance measured + distance lab

our first run we did

time= 3 seconds and the power level 25

the three results varied only slightly in number of wheel turns distance was consistently 9 ” and the lab distance was 0.21 as well

the velocity was 0.071

likewise the wheel turns where close but only varied by a decimal point averaging out to about a 1.28

our percent of error here was 10%


our second run was by far the most successful as far as less percentage of error

we did 2 seconds at power level 45

distance measured – 12.25 in / .310 m

distance in lab -.304m

#of turns – 1.78

velocity-0.15

percentage of error 1%

to determine the percentage of error we simply plugged these functions into the above equation.

lastly our third run was for 1 second at a power of 75 this proved to have wider margin of error with an error percentage of 22%

unlike our other two runs the distance measured ( 265m) and the lab distance (.259m) differed more than one or two decimal points although our velocity and distance remained close in all three runs.

  • we determined that the higher the power level the more percentage or error you have, the ideal speed(power level) is somewhere between 75 and 25. this power level helps the robot to stay straight to record accurate distance and the velocity is not too high where the number of turns is greater and the robot is exerting more energy than needed to go roughly similar distances.


Hydraulic Fracturing

 Fracking or  Horizontal Hydraulic Fracturing is a highly controversial and interesting process of harnessing natural gas out of the ground

Rocks and other formations in the ground have stored oil or gas but poor permeability, Fracking allows this stored gas to flow up to the surface and be stored for later use, making the process of obtaining natural gasses easier and less expensive than other, older alternatives.

Fracking uses a metal pipe in the ground to reach 7,000 feet where shale rock is, then the pipe turns horizontal. thousands of gallons of sand, water and chemicals are pumped into the pipe at a high pressure. the pressure causes the layer of earth to crack, these cracks are called Fissures. Sometimes acids or gasses are also used to more quickly disperse the natural gasses from the rock.

the sand from the mixture injected in the tube keeps these fissures open therefore natural gas can flow up the tube and into storage tanks above.

fracking_graphic_12041

vertical hydraulic Fracking has been around for 40 years but horizontal Fracking is relatively new although there has always been some support and some concerns weather or not hydraulic Fracking is safe this newer horizontal Fracking is raising new and more concerns. Overwhelmingly it seems like the popular point of view on this issue is against the Fracking process.

looking at the opposition First:

the acids, gasses or water used in this Fracking process are known to stay in the ground it is this residue that  is the main concern of environmentalists and scientists.

  • Water use- it takes 1-8 million gallons of water for one job
  • The chemicals used seep into nearby ground water, methane levels in nearby drinking water is raised.
  • Accounts of health issues due to drinking this water have been proven
  • most of the fluid is left in the ground and is non biodegradable
  • 600 chemicals used including formaldehyde, methanol and lead, many of the chemicals used are unreported  leaving many people asking questions

bellow shows the water cycle and how large a reach the water used and left behind in the Fracking process:

fracking-water-cycle

  • The sand and proppants that are harvested for the Fracking process presents its own environmental, safety and health risks.
  • run offs can kill wild life, insect life,  and plant life creating a huge environmental impact.
  • air quality declines due to the excess leaking of natural gasses into the air around Fracking sites.

below is a list of the harmful chemicals used in Fracking with direct health risks attached

Natural gas drilling and hydraulic fracturing chemicals with 10 or more health effects

• 2,2′,2″-Nitrilotriethanol
• 2-Ethylhexanol
• 5-Chloro-2-methyl-4-isothiazolin-3-one
• Acetic acid
• Acrolein
• Acrylamide (2-propenamide)
• Acrylic acid
• Ammonia
• Ammonium chloride
• Ammonium nitrate
• Aniline
• Benzyl chloride
• Boric acid
• Cadmium
• Calcium hypochlorite
• Chlorine
• Chlorine dioxide
• Dibromoacetonitrile 1
• Diesel 2
• Diethanolamine
• Diethylenetriamine
• Dimethyl formamide
• Epidian
• Ethanol (acetylenic alcohol)
• Ethyl mercaptan
• Ethylbenzene
• Ethylene glycol
• Ethylene glycol monobutyl ether (2-BE)
• Ethylene oxide
• Ferrous sulfate
• Formaldehyde
• Formic acid
• Fuel oil #2
• Glutaraldehyde
• Glyoxal
• Hydrodesulfurized kerosene
• Hydrogen sulfide
• Iron
• Isobutyl alcohol (2-methyl-1-propanol)
• Isopropanol (propan-2-ol)
• Kerosene
• Light naphthenic distillates, hydrotreated
• Mercaptoacidic acid
• Methanol
• Methylene bis(thiocyanate)
• Monoethanolamine
• NaHCO3
• Naphtha, petroleum medium aliphatic
• Naphthalene
• Natural gas condensates
• Nickel sulfate
• Paraformaldehyde
• Petroleum distillate naptha
• Petroleum distillate/ naphtha
• Phosphonium, tetrakis(hydroxymethyl)-sulfate
• Propane-1,2-diol
• Sodium bromate
• Sodium chlorite (chlorous acid, sodium salt)
• Sodium hypochlorite
• Sodium nitrate
• Sodium nitrite
• Sodium sulfite
• Styrene
• Sulfur dioxide
• Sulfuric acid
• Tetrahydro-3,5-dimethyl-2H-1,3,5-thiadiazine-2-thione (Dazomet)
• Titanium dioxide
• Tributyl phosphate
• Triethylene glycol
• Urea
• Xylene

– See more at: http://www.earthworksaction.org/issues/detail/hydraulic_fracturing_101#.VBormWd0yP

Pros:

  • very small amount of the chemicals are capable of contaminating large amounts of water according to some sources
  • perhaps the most argued positive is the economic growth an estimated one billion dollars every day


http://www.earthworksaction.org/issues/detail/hydraulic_fracturing_101#.VBormWd0yP-

http://www.dangersoffracking.com/

A billion-dollar daily shot in the arm for the American economy

http://en.wikipedia.org/wiki/Hydraulic_fracturing


Nations Energy Grid

Electrical energy travels a long way before we consume it at home, six steps before it reaches residential homes and small businesses. This system of steps is called the Power Distribution Grid

power-transmission

The First of the six steps and the center where all our power comes from is the Power Plant. most run on a sort of spinning electrical generator, to make the generator work power plants use different types of energy : Hydroelectric dams, Diesel engines, Gas turbines, and steam turbines. Most plants use steam turbines which creates steam by burning coal oil or natural gas or steam may come from a nuclear reactor. . generators create 3 phase power it is this 3 phase AC Power that is leaving the power plant to its next destination. the phases of this power is separated into three wires that alternate current(AC) and a common ground wire as well.

But wait what’s a ground wire ? a ground wire is used as a way to return electrons safely because the earth is a good conductor

Three phase power leaves the generator and enters the transmission substation which use large transformers  (not bumble bee the other one )

untitledpower-transmission2

these transformers are close if not still part of the power plant and they convert the generators power to high voltages to it can be transferred on the aptly named transition grid. The large towers used like seen in the photo above are huge metal structures with three wires for the three phases and the ground wire to attract lightening.

Then we have regulator banks which yet again cut the power down for easier consumption and can be shut off for maintenance within neighborhoods. The power lines we see outside our house are what leads the power to us for use.

Next is the power substation or distribution grid where the power is stepped down to better suit consumption. there is a “bus” here that splits the power into a lot of directions. power leaves this substation in two sets of three wires

Smart Grids

https://www.smartgrid.gov/the_smart_grid

are being developed to meet the rising demands of the 21st century and replace this grid I have previously explained. the current grid only works in one direction, smart grids are being designed to respond and send energy back and fourth between customers and the utility. It’s main goal is to make the grid greener and use wind and solar energy production to help limit out green house gas emissions.

how it will work:

meters and sensors will allow the utilities to gather data about consumption of energy then use that info to store energy for later use instead of having to use all the energy produced. this two way street way of energy creates problems as well as solutions to the modern day demand.

the pros of the smart grid include:

  • Eliminates Blackouts and brown outs
  • better overall reliability
  • prevent attacks due to self-healing capabilities
  • real time communication between consumer and utility

The cons of the grid include:

  • cost is estimated between 13 and 50 billion dollars
  • some more vulnerable parts of the country may not be able to change power consumption methods quick enough
  • Privacy

References:

https://www.smartgrid.gov/the_smart_grid

http://electrical-systems-lighting.knoji.com/pros-and-cons-of-the-smart-grid/

http://www.eesi.org/briefings/view/smart-grid-how-does-it-work-and-why-do-we-need-it

http://www.stopthecrime.net/BPL.pdf

http://science.howstuffworks.com/environmental/energy/power7.htm