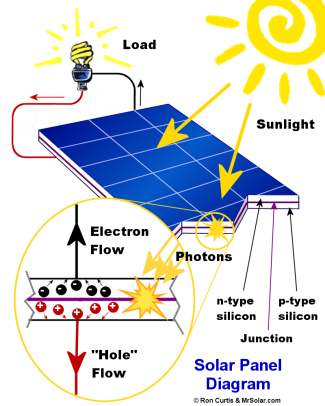
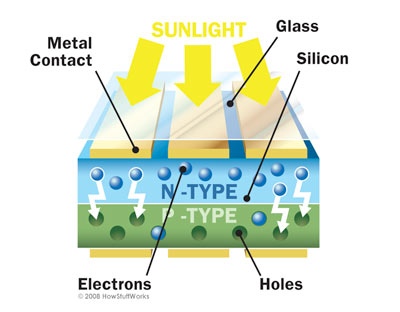
To create solar powered energy the general concept is to take energy from the sun and covert it to energy we can use. Semiconductors contain the materials of silicon and germanium, which have electrical conductivity; Photovoltaic’s are also used for light generating voltages.
To create a Solar Cell Experiment one must first know the difference between
–P Type’s (positive)
–N Type’s (negative)
– DC = Constant Voltage, Direct current (Generated)
– AC = Alternative Voltage (Used in daily lives)
– Voltage = is driving force that moves charge around a circuit
Work = Energy = Voltage x Charge
*One way to think of this is by comparing it to a pipe system.
Light Intensity= Measure of the energy of light
*the higher the intensity the more photons generated
Current (generated) Amperes
___________ ____________
(input) Power = Watts
Photovoltaic =amount of current/ voltage depends on wavelength
Silicon= Best at infrared wavelengths
Spectral Response= Ratio of the current generated by the solar cell to the power incident on the solar level
The Experiment:
To find if the signal depends on the intensity of light (moving the light closer and farther away from the signal box) and if the signal changes due to color filter changes (red, yellow, blue, and purple).

1) Measure distance between solar cell and light
2) Shine light and run LabView program
3) Average the data that appears in Excel file
4) Repeat for 4 different values of distance
5) Plot average voltage (intensity) vs. Distance
6) Repeat steps (1-3) for 4 different colored filters
The results for Distance:
1) Distance = 0 cm, Average = -0.04805
2) Distance = 2 cm, Average = 0.317607
3) Distance = 3 cm, Average = 0.244476
4) Distance = 1 cm, Average = 0.290664
Light Distance Results:

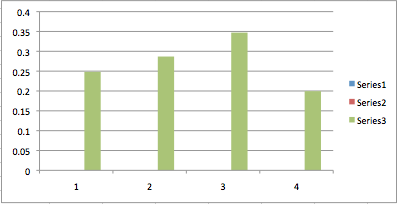
The results for Color Filters:
1) Color Red, Distance = 0 cm, Average = 0.248325
2) Color Yellow, Distance = 0cm, Average = 0.286815
3) Color Blue, Distance = 0 cm, Average = 0.347116
4) Color Purple, Distance = 0 cm, Average = 0.199571
Color Filter table:
Seems that you approached this task very seriously. Very good data and pictures. You described all graphs well.