Presentation At Dorchester Academy

Summary:

On December 7th, we had our presentation at Dorchester Academy. We were presenting our voltaic pile battery. We had a few minor mishaps. One of our group members did not show up so it was only us, me (Jeanie), Jessica, and James. We also didn’t know where most of our materials are so our professor had to buy the rest. Not only that, we were about 5 minutes late to the school.

When we arrive at the high school, we met the principal? He introduced himself and so did we. When we went into the classroom, there were about 20 students chatting away. Our professor presented her presentation while my group was making the voltaic pile battery. When our professor was finished, James went up to present our PowerPoint presentation while Jessica and I work on the voltaic pile battery. When it was time to present our battery, the voltage meter showed a result of 0.54 volts. And as we stacked it up more, the voltage meter still read about 0.54 volts.

Some of the students wanted to try making the battery so we challenge them to see if they could get a higher reading. When they finished making one stack we checked the reading. It was the same as ours when we had only one stack. At the end of the presentation, we answered some of their questions about college. When we finished answering their questions, we said our goodbyes and went back home.

Thoughts:

Jeanie: I think we did a great job presenting our project even though one of our members was not able to come. It was me, Jessica, and James that presented. James did a great job grabbing the students’ attention when they were busy chatting away. Our voltaic pile battery voltage did not increase as we were making more stacks. But the students were still intrigued.

Jessica: I thought the presentation went really well and the three of us worked well as a team. I think James did a great job grabbing the students’ attention. Even though we could not get the experiment to work in our favor, I think we explained it well enough for the students to get the basic idea of it. I just wish the students were more attentive, but other than that it was an enjoyable and a good experience.

Solyndra Scandal and Wisdom of Clean Energy Subsidies

What is Solyndra?
A manufacturer of cylindrical panels of copper indium gallium selenide thin-filmed solar cells. It’s based in Fremont, California.

What happened?
The solyndra company filed for Chapter 11 bankruptcy protection on August 31, 2011. The company lay off 1,100 full-time and temporary employees and shut down all operations and manufacturing. The failure of the solar manufacturer Solyndra might be cause by Obama administration for its failure to properly manage government subsidies. It left taxpayers with $535 million in federal guaranteed loans.

http://online.wsj.com/article/SB10001424053111904836104576558763644374614.html

Why Did Solyndra Fail So Spectacularly?

http://gigaom.com/cleantech/solyndra-to-file-for-bankruptcy-lay-off-1100/

Demand Response

What is Demand Response (DR)?

They are programs that gives residential, commercial and industrial consumers the ability to voluntarily cut down their electricity usage at different times of day (peak hours) during high electricity prices or during emergencies (preventing blackouts).

Demand Response Research Center (DRRC)

Was established in the spring of 2004 by the California Energy Commission Public Interest Energy Research (PIER) program. It was established to conduct research on the near-term adoption of demand response (DR) technologies, policies, programs, strategies, and practices.

To achieve its objectives, they were guided by these 5 tasks:

  1. Create a roadmap to guide California DR Research.
  2. Establish multi-institutional partnerships.
  3. Pursue outreach efforts to foster connections with customer, vendors, utility, and other stakeholders.
  4. Sustain long-term attention to DR research.
  5. Conduct research, development, demonstrations, and technology transfer.

Open Automated Demand Response (OpenADR)

DRRC worked with California and the nation to develop an open communications specification to automate DR. It facilitates reliable and cost-effective automation of electricity price and system grid reliability signals for DR.

Problems

Some researches believe demand response can help with renewables. But there are some issues/problems. There is a major limitation today, including communications, latency, and market design. Some participants does not want to be called on again and again to shed the load over the summer.

Sources:

  1. http://www.greentechmedia.com/articles/read/can-autodr-meet-the-needs-of-renewables
  2. http://drrc.lbl.gov/openadr
  3. http://science.howstuffworks.com/environmental/green-science/demand-response.htm

Final Project Brainstorming

On November 8, my group (me, Jessica Angelo, Jonah Strassler, and James Rhuda) brainstormed on what to do for our final project. Justin Galipeau was absent.

Our ideas:

  1. Conduct electricity using a potato
  2. creating a coin battery

After much thinking, we decided to do the “creating a coin battery”.
-The materials are easy to get and does not cost a lot.
-It’s easy to do and almost everyone can make one.
-There are no safety issues.
Being Green!

Solar Energy Experiment

Purpose:

The purpose of this experiment is to learn to measure the voltage output of the solar cell and the light intensity output of the light sensor of the NXT.

Equipment:

  • solar cell
  • voltage probe
  • NXT
  • light source
  • ruler
  • colored film filters

ProcedureI. Voltage

  1. Find the voltage output of the solar cell with light and from a distance of 0 cm by using the labview.
  2. Open up Excel and title the data 0 cm and save/close it when done.
  3. Next, use the light source from a certain distance.
  4. Open up Excel and title the new data the distance you picked and save/close it when done.
  5. Repeat steps 3-4 two more times with 2 other distances. Ex: 0, 5, 10, etc.
  6. Afterwards, make a Voltage vs. Distance graph.

Data:

Distance (cm) Voltage (mV)
0 0.489529
5 0.445907
10 0.401002
15 0.394587


Graph:


Interpretation:

As the distance of the light increases, the voltage decreases.

Procedure: II. Light Intensity

  1. Shine the light source onto the solar cell and use labview.
  2. Open Excel and title the data collected No Filter. Save/close afterwards.
  3. Repeat steps 1-2 with 3 different colored filters.
  4. Make a bar graph.

Data:

Color Voltage (mV)
No Filter 0.489529
Red 0.297079
Yellow 0.420247
Green 0.451039


Graph:

Interpretation:

With no filter, the output is a lot higher and stronger than the ones with colors. The light intensity output for red is a lot weaker than yellow and green. Yellow is stronger than red but weaker than green. Green is stronger than both red and yellow.

Museum of Science

Wind Turbines:

At the Museum of Science, I learned that there were 5 types of wind turbines. They are the Windspire, Southwest Skystream 3.7, Proven 6, Architectural Wind: AVX1000, and the Swift Rooftop Wind Energy System.

The Windspire is produced by Mariah Power. Its rotor diameter is 4 ft, tower height (with no tower) of 30 ft tall, weight of 600 lbs, cut-in wind speed of 9 mph, maximum rated power of 1.2 kW, and an annual maximum power of 10,512 kWh. The turbine could generate power of twelve 15-watt energy efficient light bulbs at the Museum for one year.

The Southwest Skystream 3.7 is produced by Southwest Windpower, Inc. It has a rotar diameter of 12 ft, the tower height is 33 ft, its weight is 170 lbs, cut-in wind speed is 8 mph, maximum rated power of 1.9 kW, and an annual maximum power of 16,644 kWh. It could generate power for nineteen 15-watt energy efficient light bulbs at the Museum for one year.

The Proven 6 is produced by Proven Energy. It has a rotor diameter of 18 ft, tower height of 30 ft, weight of 2,769 lbs, cut-in wind speed of 5.5 mph, maximum rated power of 6 kW, and an annual maximum power of 52,560 kWh. It could generate power for sixty 15-watt energy efficient light bulbs for one year at the Museum.

The Architectural Wind: AVX1000 is produced by AeroVironment, Inc. It has a rotor diameter of 6 ft, tower height (with no tower) of 6 ft tall, a weight of 130 lbs, cut in wind speed of 5 mph, maximum rated power of 1 kW, and an annual maximum power of 8,760 kWh. It can generate power for ten 15-watt energy effiicient light bulbs for one year.

The Swift Rooftop Wind Energy System is produced by Renewable Devices. Its rotor diameter is 7 ft, has a tower height of 9 ft, weight of 209 lbs, cut-in speed of 7.5 mph, maximum rated power of 1.5 kW, and an annual maximum power of 13,140 kWh. It can generate power for fifteen 15-watt energy efficient light bulbs for one year at the Museum.

Where does wind come from?

Wind is actually a form of solar energy. When sunlight hits the Earth, it heats the air unevenly. As the warm air rises, cooler air moves in to take its place.

Generator Experiment

Overview:

In this experiment, we learned about Faraway’s Law which states that changing magnetic fluxes through coiled wires generate electricity (currents and voltage). We shook a tube which has a magnet that will travel back and forth through a coil of wires. We will be showing that the faster we shake the tube, the greater will be the generated voltage.

Apparatus

  • usb
  • generator
  • battery
  • voltage probe

Procedure:

  1. We shook the tube at a particular rate.
  2. Counted the number of shakes.
  3. Find the sum of squares of the voltages (SSQV). (voltage logged after each second on the Excel)
  4. Repeated steps 1-3 with 3 different rates of shakes.
  5. Plotted the SSQV’s as a function of # of shakes and fit the result to a linear curve.

Data:

# of Shakes Sum of Squares of voltages (SSQV)
0 0.473078531
28 12.88478037
37 14.52086454
60 31.35522


Interpretation:

As the number of shakes increases, the sumsq of voltage increases as well.


Fukushima Daiichi Nuclear Disaster

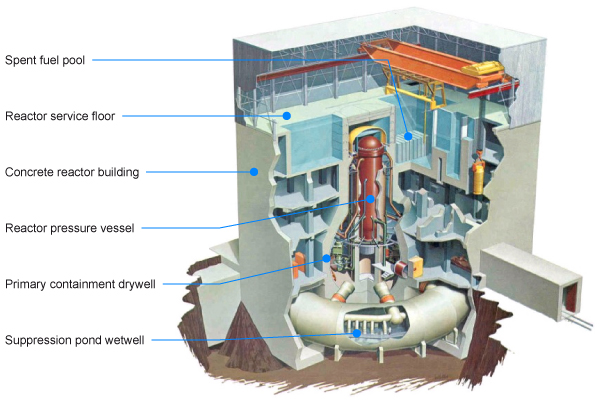
On March 11, 2011 at 2:46 PM, an earthquake shook Japan. With a magnitude of 9.0, it did considerable damage on the region. It also caused a tsunami which disabled the power supply and cooling of the 3 nuclear reactors. This caused the 3 reactors to melt. The only way to prevent it from melting was flooding it with seawater but by the time the government ordered to flood the reactors, it was already too late to prevent meltdown.

Reactor 1:

A hydrogen explosion on the Saturday blew off the roof of the reactor as workers worked to cool down the reactor. The primary containment vessel is said to be intact.

Reactor 2:

A hydrogen explosion on Tuesday ruptured and have breached the primary containment.

Reactor 3:

Water injection failed. Reduced RPV pressure by venting steam into the wetwell, allowing the injection of seawater. Venting the suppression chamber and containment was successfully undertaken. On Monday 14th, PCV venting was repeated. It backflowed and a hydrogen explosion took place. Explosion of the containment blew off the roof and walls and demolished the top part of the building. Created a lot of debris and the areas around unit 3 were very radioactive.

Reactor 4:

This reactor was shut down for maintenance before the earthquake. An explosion happened that destroyed the top of the building and damage unit 3’s superstructure further.

Comments:

The information I got these from was kind of confusing to me so if you want a better understanding go down and look at the links.


Sources:

http://www.world-nuclear.org/info/fukushima_accident_inf129.html

http://www.globalpost.com/dispatch/news/regions/asia-pacific/japan/120705/fukushima-daiichi-nuclear-disaster-man-made

http://www.nytimes.com/interactive/2011/03/15/world/asia/daiichi-graphic.html

Hydraulic Fracturing

Background:

Hydraulic fracturing is a technology used to extract natural gas from shale rock formation underneath the earth. Used to maximize the extraction of underground resources:

  • oil
  • natural gas
  • geothermal energy
  • water

The process begins with building a necessary site infrastructure and well construction. Drills into the ground vertically; drilled hundreds to thousands of feet below the ground. Fluids are pumped into a geologic formation at high pressure during hydraulic fracturing. When hydraulic fracturing is completed, internal pressure of the geologic formation cause the fluids to rise to the surface where it is stored into tanks. Recovered fracturing fluids are known as “flowback”.

Contamination?

This process could raise many health issues for town and cities:

  • Water Contamination
  • Pollution – noise, dust, truck traffic, and minor earthquakes.

There was a study in 1999 by the EPA on hydraulic fracturing in coalbed methane reservoirs to see if there are any potential risks to Underground Source of Drinking Water (USDW). This study focused on the reservoirs because they are close to USDW. The EPA published the study indicating there was little to no risk of fracturing fluid contaminating underground resources of drinking water during the process of hydraulic fracturing.

Suspicion of Contamination:

Arkansas:

In 2007, a family reported that their drinking water was contaminated by a nearby natural gas well owned by Southwestern Energy Company. Their water became muddy; looked like leather.

In 2008, someone reported contamination of drinking water during hydraulic fracturing from a nearby natural gas well. Her water smelled bad, turned yellow, and filled with sit. Owned by the same company.

In 2009, another family reported that their water turned gray and cloudy and had a noxious odor after hydraulic fracturing from the same company.

Other places of contamination are:

  • Colorado
  • New Mexico
  • New York
  • North Dakota
  • Ohio
  • And many more – check the third reference

Resources:

  • http://water.epa.gov/type/groundwater/uic/class2/hydraulicfracturing/wells_hydrowhat.cfm
  • http://0-web.ebscohost.com.library.law.suffolk.edu/ehost/detail?vid=3&hid=11&sid=43544eed-e79f-4770-977b-56d620a0f46f%40sessionmgr15&bdata=JnNpdGU9ZWhvc3QtbGl2ZQ%3d%3d#db=8gh&AN=76274357
  • http://switchboard.nrdc.org/blogs/amall/incidents_where_hydraulic_frac.html

Force and Energy, Velocity and Acceleration, and Power


Objective:

  1. Newton’s 2nd Law i.e. F=ma
  2. The law of conservation of energy
  3. Velocity and acceleration
  4. Power

http://web.cas.suffolk.edu/faculty/lshatz/Sustainability_class/Lab2_files/image004.jpg

Newton’s 2nd Law i.e. F=ma:

a) The acceleration does vary with mass.
b) The acceleration does vary with the power levels.

Mass (kg) Acceleration (rpm/s) Power Level (%) Acceleration (rpm/s)
0.25 40.869839 100 89.66584
0.2 42.477848 75 42.477848
0.15 47.462272 50 16.984233
0.1 65.160454 25 1.343651

Explore the Law of Conservation of Energy:

a) Computing Potential Energy = mgh

mgh (J)
0.6125
0.49
0.3675
0.245
0.49
0.49
0.49
0.49

b)

Mass (kg) Battery Discharge (MV)
0.25 111
0.2 69
0.15 13
0.1 41

The battery discharge increases as the mass increases.

Calculate the average power used by the motor:

Power Level (%) Power (watt)
100 0.343618513
75 0.730253353
50 0.150030618
25 0.040013065

As the Power Level increases the Power should increase as well. The slope is 0.006 and the intercept is -0.0568.