Category Archives: Uncategorized

Keystone XL Pipeline

What is it?: The Keystone XL Pipeline is a system that is designed to carry hundreds of thousands barrels of petroleum that will travel daily from Canada to the Gulf Coast. TransCanada is the company that came up with the idea for the nationwide pipeline. However, there are many debates between whether or not we should finish the building process of these pipelines (UPDATE: the Senate voted against completing the pipelines)


Pros: Pipelines are the least expensive way in the industry to transport oil. Also, it is estimated that the pipelines will create about 42,000 jobs for construction. However, after the completion of construction, only about half of those jobs will be permanent.


Cons: There are environmental concerns due to the crude oil having to be heated and separating the crude from the sand. This concerns environmentalists because they would prefer the oil to be left in the ground, rather than taken from where it lies naturally.


References:

http://www.nytimes.com/2014/11/19/us/politics/what-does-the-proposed-keystone-xl-pipeline-entail.html?_r=0

http://keystone-xl.com/facts/myths-facts/

http://www.npr.org/2014/11/17/364727163/what-you-need-to-know-about-the-keystone-xl-oil-pipeline

Final Project Brainstorming

For our final project in this class, Rebecca, Bryan and myself thought of a few different ideas. At first, we were wondering which topics we could cover in our project and how to relate that topic to the class. It did not take long to come up with the idea of our project dealing with heat and insulation. It was one of the first ideas we had, and we instantly knew we would probably end up using this idea for our project.

Overall, the project is about temperature and heating. We want to figure out which material (cotton, wool, plastic, or aluminum) would keep liquids the warmest after ten minutes. We will use coffee cups to hold the hot liquids in, since we figured that would work the best rather than glass or plastic. This project will relate to the outside world because it will teach us which material works best for insulation. This is also important because the winter is near, and I want to make sure I keep my hot chocolate as hot as I can when I’m outside.

Museum of Science Blog

I really enjoyed the field trip to the Museum of Science because we were allowed to freely look at the exhibits. This allowed me to spend as much time as I needed at each exhibit to ensure that I understood what the exhibit was about.


The wind power exhibit was the first one that I visited. It had an interactive screen that I could play with, which let me change the wind speed to see how much power it gave off. This display also had a bunch of gears with a crank that I could turn. The gears turning represented the wind, and the faster I spun the crank, the more electricity that was generated.

IMG_0666

The second exhibit I visited was the solar energy one. One of the parts of this exhibit included a display that showed the energy the sun gave off during different hours of the day. I learned that in between noon and afternoon is when the sun gives off the most energy to Earth. It also had a display that showed the three different types of solar collector shapes. This included the tower, the trough, and the parabolic dish. There was also a map to show which locations around the world have the most potential for solar energy. The areas near the equator had much more potential solar energy than areas extremely close to the polar regions.

IMG_0667IMG_0668

The third exhibit I visited was the nanotechnology one. I was very curious about this one because I was not as familiar with nanotechnology as I was with wind power and solar energy. Nanotechnology is the building of small items out of individual atoms. One thing about this exhibit that intrigued me was the light-up butterfly. The butterfly clearly had a beautiful blue color to it, but once the light hit the wings, it revealed that the butterfly was actually brown in color, making it look like a moth. I thought it was very strange that nature could do that, and I would’ve just assumed that because the butterfly appeared to be blue meant that its atomic makeup was blue. Another little fun part of this exhibit was that I could see how tall I was in nanometers…I am about 1.65 billion nanometers tall!

IMG_0677

The final exhibit we had to visit was conserving energy. This exhibit looked cool because it looked like you were entering a house. My favorite part of this exhibit was the display that showed a live-video screen of the moving heat. Anytime a person walked past the camera, I could see the body heat they gave off and I thought it was pretty neat because it was happening right neIMG_0679xt to me.

Stirling and Peltier

Stirling Engine:

The Stirling heat engine is used in specialized applications where it is important to have quiet operation. It does not require any exhaust valves because the gasses in the Stirling do not leave the engine, which is what makes them so quiet. It has a high efficiency compared to steam engines as it can use almost any heat source. All of the heat transfers through the heat exchanger. There are different Stirling engines, such as the rotary Stirling, the two-cylinder Stirling with Ross yoke, and the Free Piston Stirling engine.

Peltier Cooler:

The Peltier cooler uses active heat pumps, or thermoelectric coolers (TEC), that allow the temperature to exceed the temperatures that a conventional cooling system or heat pipes could do. 70 degrees celsius is the maximum temperature difference between the hot and cold side of the TEC. However, the Peltier cooler has a low efficiency, meaning that it consumes more power than the amount of power it is transporting. They could consumes twice the amount of electricity than the amount of heat they export.

References:

http://auto.howstuffworks.com/stirling-engine.htm

http://www.stirlingengine.com

https://tetech.com/peltier-thermoelectric-cooler-modules/

http://www.heatsink-guide.com/peltier.htm


Fukushima Daiichi Nuclear Disaster

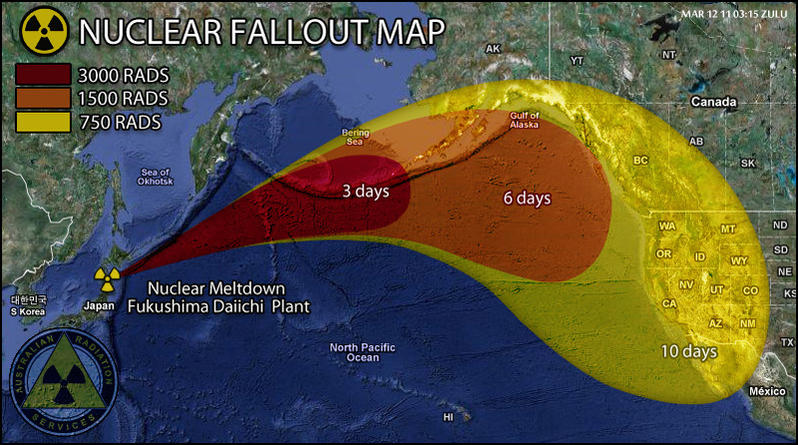
Much of Japan changed on March 11th, 2011. After a major earthquake in Japan, there was a terrible tsunami that was triggered by the 9.0 magnitude earthquake. This quickly became a nuclear disaster when the tsunami hit the Fukushima I Nuclear Power Plant, creating the worst nuclear disaster since Chernobyl. The day after the tsunami is when the power plant began to release the harmful radioactive material. It would be thought that the people who were evacuating would be safe; however, this is not the case. The evacuation process killed many people, and over 16,000 lives were taken from the earthquake and tsunami alone. 

The power failed in the reactors, and due to the chemicals inside, the pressure of the reactor began to rise. The emergency cooling system failed as the temperature rose, which caused even more evacuations. To this day, there is still water being poured into the reactors in order to keep the reactor’s system cold. The WHO said, “Very few cancers would be expected as a result of accumulated radiation exposures, even though people in the area worst affected by Japan’s Fukushima nuclear accident have a slightly higher risk of developing certain cancers such as leukemia, solid cancers, thyroid cancer and breast cancer” (Wikipedia).
Japan’s New Energy Strategies

Fukushima’s energy strategies have drastically changed since the accident. They used to rely on nuclear power, but the disaster has changed their views on it. About 22% of its energy now comes from renewable sources, with the hopes that 100% of its energy will come from renewable sources by 2040 (Ecowatch). The government has been forced to focus on different ways to produce energy on alternative electric sources. “In the meantime, a Renewable Energy Village (REV) with 120 solar panels and plans for wind turbines has sprouted up on the contaminated farmland surrounding the power plant” (Ecowatch). This is just one of the projects being performed in the hopes that Japan will use 100% renewable energy in a few decades.


References:

http://www.eia.gov/countries/cab.cfm?fips=ja

http://ecowatch.com/2014/02/05/fukushima-renewable-energy-japan-nuclear-power/

http://fukushimaontheglobe.com/the-earthquake-and-the-nuclear-accident/whats-happened

http://en.wikipedia.org/wiki/Fukushima_Daiichi_nuclear_disaster#Risks_from_radiation

http://www.world-nuclear.org/info/Safety-and-Security/Safety-of-Plants/Fukushima-Accident/


Tom Vales Lecture

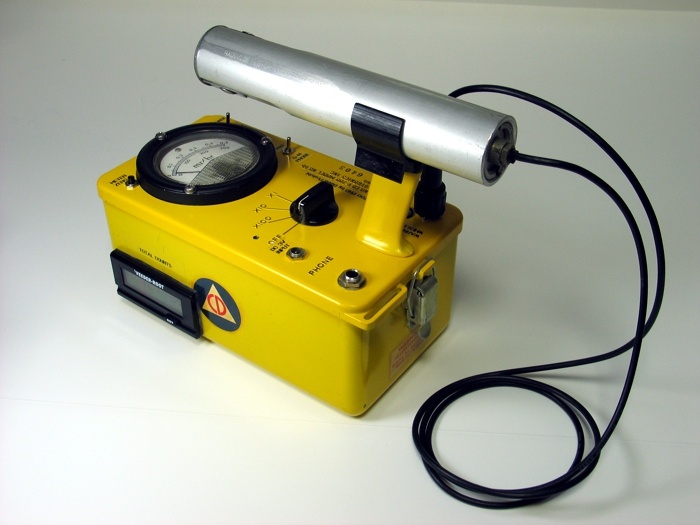
I was a tad bit confused when I walked into class and saw someone else standing at the front of the room. He introduced himself as Tom Vales, and he was actually very interesting and taught me a lot in the hour he was there. I did not know what to expect at first, due to the fact that there was a beeping device on the desk that beeped every few seconds, which I later found out it was used to measure the radioactivity of the different things he brought into class. Before this lecture, I really had no idea about radioactive substances and how many different things they could be found in. I also learned that radioactive elements are constantly decaying and trying to get back to their stable state, which is lead.

One of the things that I was most interested in was when Mr. Vales talked about Marie Curie’s discovery of radium and the epidemic of the pocket watches. As a theatre major, I was not sure if I would apply most of the things I learned in this class to my major. However, when he talked about the pocket watches, I instantly thought of the play that Suffolk put on last Spring called Radium Girls. In the play, the young girls would paint with radium onto these watches, and they would lick the paintbrush in between each stroke; much like what Mr. Vales was talking about. One of the main characters gradually became sick, starting with a bad toothache, then her entire jaw would hurt, and eventually it was hard for her to walk. I knew exactly what Mr. Vales was talking about while speaking of the pocket watches, and this made me much more interested because I could relate it to theatre. In the end of the play, the main character dies from radium poisoning, which shows how people did not realize the harmful effects of radium at the time of its discovery.

I learned from the lecture that radiation is measured in “sieverts”, or SI for short. I also learned that plutonium is the deadliest substance known to man, which I was completely unaware about. I really enjoyed this lecture because it was a change in the pace of the class, and because of the demonstrations of the different devices. Tom Vales taught a lot in his limited time, and I would enjoy another demonstration from him.

Iceland’s Use of Geothermal Energy

Geothermal Energy:

Geothermal energy is the clean and sustainable heat that comes from the Earth.Through the use of geothermal heat pumps, they can use the energy to heat and cool buildings. The internal heat comes from ground hot water, hot rocks, and even the magma that is miles beneath the Earth’s surface.


Iceland’s Use of Geothermal Energy:

Although the United States may use the geothermal reservoirs of hot water, Iceland was the pioneer for space heating by geothermal energy. As a matter of fact, 25% of Iceland’s electricity demand comes from the geothermal power. “Iceland is named the land of fire and ice for a good reason. It is certainly icy: temperatures hover around 10-20°F (-12 to -6°C) in the winter” (Renewable Energy World). The country might be quite cold in the winter, but the heat that is stored miles beneath the Earth can make for a warmer country (or, at least, warmer houses and buildings). With geothermal energy, there is no need to burn fossil fuels which creates a cleaner environment. However, the low amount of toxics in the geothermal fluid is a slight issue, since people do not know where to dispose of the fluid.

Screen Shot 2014-10-15 at 11.45.28 AM

This is a photo of a Geothermal Power Plant in Iceland

References:

http://www.nea.is/geothermal/

http://www.renewableenergyworld.com/rea/blog/post/2013/03/geothermal-energy-in-iceland-too-much-of-a-good-thing

http://www.renewableenergyworld.com/rea/tech/geothermal-energy

http://en.wikipedia.org/wiki/Geothermal_power_in_Iceland

http://environment.nationalgeographic.com/environment/global-warming/geothermal-profile/


Solar Energy Lab

The solar energy lab was supposed to show the relationship between light intensity and the voltage output of the solar cell, along with the relationship between the light’s wavelength and voltage output of the solar cell. However, that was not the case for my lab partner and I. After we performed the experiment for the first time, a lot of out numbers looked similar to one another, even after we changed the colored film filters. Most of our data seemed to be almost identical to our other data…it did not matter if we had on a red filter or a blue filter, it was still the same.

Screen Shot 2014-10-08 at 1.27.09 PM

After our first run of the experiment, we had to re-do the entire process. This was slightly aggravating because we could not figure out why all of the data looked similar. On the second run of the experiment, our numbers did not seem to really get any better. They changed slightly from the first run-through, but overall they still look roughly the same. I do not know if we had a faulty voltage probe or NXT light sensor, but we were having difficulties with the experiment for both tests.

Screen Shot 2014-10-08 at 1.26.55 PM    Screen Shot 2014-10-08 at 1.26.41 PM

Anyways, we began the test by measuring the light sensor with no light on it at all. After we did this once, we could begin to measure the light sensor with the flashlight on it. We would change the distance between the light sensor and the flashlight, and increase the distance by a few inches for each trial. As I said before, our results barely changed between the trials, no matter how much of a distance we had between the light source and what we used to measure the light. Afterwards, we used a colored filter to measure the wavelength of light. Our film filters were red, black, blue, and orange. The averages measured out to be about the same as each color, but black did happen to have the lowest average.Screen Shot 2014-10-08 at 1.27.02 PM   Screen Shot 2014-10-08 at 1.26.49 PM

Solar Energy Effort 10/10/14

Globally, people are trying to make an effort on improving the use of solar energy. This means that instead of using different forms of energy, such as coal or oil, the sun is the direct supplier of the energy. The radiation from the sun makes contact with solar panels, which in turn will create heat/electricity that generates power. Without relying on fossil fuels, the environment will become greener and cleaner (DNR).


The most solar energy efficient country is Germany. They mainly use solar panels for power in the country, and plan to use nothing but solar energy by 2050 (Planetsave). This will have a great impact on the environment for the fact that there will be slim to none greenhouse gas emissions coming from Germany. As a matter of fact, they installed eight times the amount of solar panels in Germany than America has.


One solar energy project that I found interesting is the project they are working on at the Vatican. The amount of power that the Vatican will produce will be enough to give energy to the entire country of Rome (Inhabitat). It also has the largest solar power plant in Europe, even though it is a small country.

Screen Shot 2014-10-08 at 1.56.07 PM

I think it is great that more and more people are turning to solar energy. To me, the main benefit would be not having to worry about running out of energy/power, for the fact that the sun will always be emitting radiation (unless something drastic and dramatic happens, which is probably only possible in a sci-fi movie).

References:

http://www.dnr.wa.gov/ResearchScience/Topics/OtherConservationInformation/Pages/cc_climate_change_renewable_energy_efforts.aspx

http://inhabitat.com/the-worlds-6-coolest-solar-powered-projects/

http://planetsave.com/2012/03/06/top-6-countries-using-solar-energy/

Generator Experiment

The generator lab experiment required a generator to shake (which was basically a flashlight without a lightbulb), a magnet that is in a coil of wire, and a probe and adaptor. The ability to count quickly was also necessary in this experiment. Basically, one person had to shake the generator for thirty seconds at a certain pace while the other person had to keep track of how many times the generator shook. We then had to take the information the computer automatically recorded (the voltages) and had to see the squared voltages and figure out the sum of squared voltages.


My partner and I did three trials of the experiment. For the first trial, he shook the generator as I counted how many times he shook it. I counted that it shook 60 times total within the thirty seconds. Our sum of the squared voltages was 189.58

Screen Shot 2014-10-01 at 11.09.31 AM

The second trial of our experiment resulted in 63 shakes by my partner, while I counted again. He shook at almost the same pace as the first trial, but it must have been just a tad faster for him to increase by three shakes. Our sum of squared voltages was 359.78

Screen Shot 2014-10-01 at 11.09.42 AM

The third and final trial was slightly different than the first two. For this trial, I was the one to shake the generator while my partner kept track of the amount of shakes. He totaled 71 shakes in thirty seconds. Our sum of squared voltages was 104.82

Screen Shot 2014-10-01 at 11.09.49 AM


After we performed the three trials, we had to make a graph of the number of shakes versus the sum of the squared voltages. *The chart was originally supposed to be flipped around, but we could not figure out how to change the X and Y axis on our chart on the computer.*


Screen Shot 2014-10-01 at 11.10.04 AM


Our X-Axis is the sum of the squared voltages and our Y-Axis is the number of shakes.