Assignment 10.2: The Keystone XL Pipeline

The first thing I discovered about the Keystone XL Pipeline was that it is incredibly hard to find unbiased sources on it. There seems to be a very divisive issue on whether it should expand or not. The basic idea is that this is a pipeline that would go from Alberta, CA all the way down to Nederland, Texas, USA, and would cary 830,000 barrels of oil daily. A pipeline already exists in that way, the Keystone pipeline, but the proposed Keystone XL would be a shortcut that travels a quicker path, depicted below:

(A map of the Keystone Pipeline, in brown, and the proposed Keystone XL pipeline, in blue dotted lines. Source: http://keystone-xl.com/wp-content/uploads/2015/06/TransCanada-Keystone-Pipeline-System-Map-2015-06-08.jpg)


The Keystone XL website claims that this new pipeline is essential for providing jobs in the US, can allow us to discover more crude oil on our own land, and reduces foreign dependency on oil. Nebraska Governor Dave Heineman has approved the route through Nebraska, although this route will not exist: President Obama has decided not to approve a permit for this pipeline. Many environmentalists have protested the building of the XL pipeline for a few reasons. The kind of oil this pipeline would carry, heavy oil-sands petroleum, derived from the naturally occurring oil sands that are mixed with clay and water, among other things. People fear that were this pipeline to leak, it would be much more devastating than regular oil. Another concern is about the way this oil-sand petroleum is processed. There are two ways the petroleum can be derived, and neither way is healthy for the ecosystem. From the New York Times:

“In one method, large amounts of water and natural gas are used to pump steam into the sands to extract the oil, which creates toxic environmental runoff.

Alternatively, energy companies strip-mine the sands and then heat them to release the oil, a practice that has already destroyed many acres of Alberta forest. An environmental review by the State Department concluded that production of oil-sands petroleum creates about 17 percent more carbon pollution than production of conventional oil.” (Source:

http://www.nytimes.com/2014/11/19/us/politics/what-does-the-proposed-keystone-xl-pipeline-entail.html?_r=0)

The jobs this pipeline would create would be almost entirely temporary; out of the roughly 40,000 new jobs that politicians are citing this would create, only 35 of them would be permanent. It seems clear that this project would only do more harm, in terms of the environment, than good, in terms of the economy.


Sources:

About the Keystone XL Pipeline

http://thinkprogress.org/climate/2015/02/24/3626301/keystone-xl-vetoed/

Assignment 10.1: Project Brainstorming

Jennifer Straka and I have worked very efficiently together on experiments in this class, so it seemed like a no-brainer that we would work together for this experiment as well. We were trying to come up with ideas that were doable, relevant to our interests, and were things we could really learn from. It was important to us that we would be able to apply the information we learned from this experiment to our everyday lives. On my midterm, it was noted that I had forgotten to include lifestyle changes that made it possible to cut down a dependence on fossil fuels, so I was interested in an experiment that related to that. Jennifer is an interior design major, so we wanted an experiment that would relate to her interests as well. Once we decided to do an experiment with different types of lightbulbs, we knew we had found the right topic for both of us.

We wanted to look at regular iridescent lightbulbs, CFC bulbs (compact fluorescent), and LED bulbs. We were familiar with the concept that the last two types were more energy efficient, but by how much were they more efficient? Which one was the most efficient? We decided to design an experiment that would compare these three bulbs in terms of the power they used and the light intensity they produced. Having done the experiment with the solar cells already, we knew that would be a good way to measure light intensity that our fellow students would be familiar with already. A quick YouTube search brought a video that had used multimeters to measure the power used, giving us both pieces of data we were looking for with this experiment.

A few days after class, Jennifer and I went to Home Depot together to pick up other materials we needed. We found a very helpful employee who was kind enough to walk us around and make sure we picked the safest materials, so we could wire the circuit connecting the bulb to power without any risk of hurting ourselves or anyone else who would perform this experiment. We bought the bulbs, wire, lamp housing for the bulbs, a plug, and wire cutters. We now believe we have everything we require for this project, and tomorrow we’ll begin assembling our circuit, which I really look forward to! Neither of us have ever wired lights before, so this will already be a learning experience before the experiment even begins!


Assignment 9.1: The MIT Nuclear Reactor

On Friday, November 6th, we were lucky enough to get to visit the Nuclear Reactor that MIT uses for research. We got a sit down lesson on the brief history of this particular reactor and also how this equipment works and what it can be used for. The thing that struck me most about the whole visit was how hard the staff works to make sure it is a safe space to operate and bring visitors to. From the second we arrived, we were given devices that were able to determine how much radiation we were about to be exposed to. We also double checked for contamination on our hands and feet on the way out. There were tons of monitors all over that place that measured the radiation in the environment, and there was a control room to specifically monitor different levels of radiation, temperature, power, and other measurements that are necessary to keep the space safe. I was really struck by all the preventative measures there were at the nuclear reactor, and it made me feel much better about being there.


The reactor is kept in a building that consists of one large dome of concrete, and inside of that is another large box of concrete and lead that the reactor core is kept inside of. The concrete and lead are too thick for the radiation to get through, so this too is a safety measure, both to keep the radiation inside of the core and in the worst case scenario, to keep it inside of the dome so the city of Cambridge doesn’t have a nuclear crisis. Inside the inner concrete, the core is kept surrounded by water, used as a coolant. There are 27 spaces in the core for fuel cells, although usually only 24 are used and the other three spaces can hold dummies or experiments. The nuclear reactor lab here is of course mostly used for research, so the types of experiments that occur can vary wildly.


I was also surprised that the workspace had some fun and decor in it. There were little decals of molecules and atoms on the walls, which was cute, and I also noticed that one old shipping tank had been nicknamed “Nessie” which I thought was adorable. The people there took their jobs seriously, which is necessary for a space that could be so potentially dangerous, but it was not an anxious environment. I left feeling surprised that it seemed like it would be a fun place to work. Both of our guides were brilliant, well informed, and excellent communicators that were able to explain the information in a fun and passionate way, which can be hard to do when talking about something so complex and challenging as fission and fusion. I’m grateful for the experience I had, because I can honestly say I don’t think I’ll ever get the chance to go inside of a nuclear reactor lab ever again.

Assignment 8: Global Solar Innovation

Worldwide, countries are beginning projects that incorporate the sun’s energy instead of fossil fuel energy which most states have come to rely on. Although there are many fascinating projects globally, I will refrain myself from speaking about all of them at length, and will instead focus on just three countries that are doing cool things: Serbia, Finland, and The Netherlands.


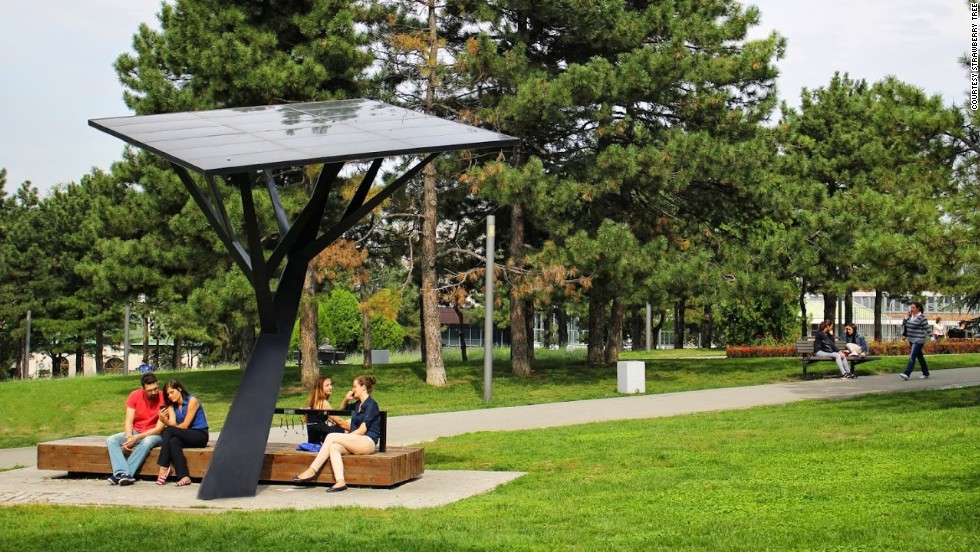
Serbia has a really interesting new project called Strawberry Tree. Strawberry tree is a charging station created to help those of us who forget to charge our phones overnight and then discover midday that we’re in desperate need of charging. The coolest part about Strawberry Tree is that it’s entirely solar-powered; it can even continue to run for 20 days without sunlight, in case the weather happens that way. Other cool features are that it can measure air pollution, UV-radiation, and noise levels. Strawberry Tree is made from 98% recyclable materials, and in December 2014 there were already 12 different Strawberry Trees across Serbia, including Belgrade as well as smaller towns. One of the best parts about this is that many of the people who use Strawberry Tree have never really used clean energy before. The more we can introduce people to the possibility of using more clean energy, the easier it will be to lessen our fossil fuel dependence.

(People charging their phones with Strawberry Tree in Serbia. Source: http://i2.cdn.turner.com/cnnnext/dam/assets/141126105815-strawberry-tree-2-horizontal-large-gallery.jpg)


In Finland, there is a beer company that wants people to experience solar energy in the most appetizing way possible: through food. The Lapin Kulta solar kitchen (http://lapinkultasolarkitchenrestaurant.com/) first opened in Helsinki but continues to have pop-up restaurants all over Europe. It is especially popular in Southern countries that get more sunlight, because naturally, the kitchen can only operate on sunny days. A Milan location just opened up, and the reception to this restaurant has been very positive.

(Source: https://vimeo.com/26867515)


The Netherlands are already known for being a green country, with some of the most impressive bike lanes in the world. However, these bike lanes are becoming even better. The country has some 250 miles of bike paths, and in 2012, the country had planned to cover these paths in crystal silicon solar cells underneath a protective layer of glass, making it safe to bike over. This endeavor planned to generate 50 kWh per square meter each year and the country had decided to put that energy towards powering traffic lights and other city needs. These bike paths would also be able to store energy, so that there would still be power flowing on rainy days and fuses wouldn’t blow on days where it was too sunny.

(SolaRoad. Source: http://rack.2.mshcdn.com/media/ZgkyMDEyLzA0LzA0LzA5XzAzXzQ5XzI2OF9maWxlCnAJdGh1bWIJMTIwMHg5NjAwPg/037333c4)


Sources:

http://mashable.com/2012/01/04/innovative-solar-energy-tech/#AagXppLt0iqS

http://www.cnn.com/2014/12/15/world/europe/strawberry-tree-solar-charger/

http://lapinkultasolarkitchenrestaurant.com/


Lab 8: Solar Cell Experiment

In this experiment, we were asked to use a solar cell, a light, a ruler, and some colored gels to determine different aspects of light intensity. Specifically, we were asked to discover the relationship between the distance between the cell and a light source and light intensity, and also the color of light and how that effects intensity.


My partner and I started looking at the distance between our flashlight and our solar cell. Before we really began recording data, we tested the solar cell in the dark to determine its accuracy. We attempted to incorporate this data into our graph, but the data point made the trendline look as though it didn’t match at all so we removed it from our graph. We did get a small reading, but it was negligible. It was important for us to do this though, because after this step we were aware that our cell was not perfectly accurate. Luckily, it was still accurate enough that the experiment worked out for us.


To explore the relationship between distance between the cell and a light source and intensity, we took light intensity measurements at five different distances: 0cm, 3cm, 5cm, 7cm, and 9cm. Our measurements were recorded by the computer in intervals of ten seconds, and so we took the average of those recordings to get out data points. As is apparent from the graph, the farther away the light source is from the solar cell, the less intensity the cell records.

Graph-Distance


For the second half of the experiment, we used four different colored gels to look at how color has an impact on light intensity. We had red, blue, orange, and light pink, and of course white light without a gel. We took our measurements by holding the light source directly next to the solar cell with the gel in between, so distance would not be a factor in this experiment. Our findings were about what we expected: the darker the gel, the less intensity the solar cell will record. It was no surprise that white light gave the highest intensity, and the light pink one was not far behind. It also makes sense that orange and red came next, both because the orange was less opaque than the red and the blue, but because of the wavelengths of the colors. Red light has a much longer wavelength than blue light. The only thing that really surprised me about this experiment was that there wasn’t a more dramatic difference between the intensities of red and blue light, but I suppose that has something to do with the opacity of the gels. For a more perfect experiment, if I really wanted to look at how red light and blue light compare in terms of intensity, I would pick gels that all have the exact same amount of opacity.

Graph-color