Tom Vale’s Presentation

Last week we watched a presentation given by electrical engineer, Tom Vale. He came in with a cart of numerous types of small gadgets, asking students to put their computers down to clear the space so he could set up mini experiments. He initially began talking about alternative fuels and energy, discussing how we need to start using other sources because we are burning it up quickly. Alternative energy sources are not just a problem of today but rather were addressed back to hundreds of years ago. The small gadgets and experiments that were set up on the table in front were example of simple devices that were used in that time for alternative energy. These power engines create energy without burning any fuel. The three alternative energy sources he would be demonstrating to us were the Peltier Device, Stirling Engine and Piezo Electric effect.

The first experiment was a small metal piece with two legs that split into two different cups. One cup held warm water while the other cup held cool water.  The top piece was joined by a small fan on top. This was known as the Peltier Device. The Peltier Device was created in 1834 by physicist, Jean Peltier. He discovered two dissimilar metals put together created electrical energy. One side of the device would be emerged into hot water and the other side would be put into cold. Electricity would be generated in junction and the two bars on the top of the device would begin turning. A current is made to flow through a junction made of two different materials. Heat generated in the upper junction is absorbed in the lower junction, known as the Peltier effect. However, the Peltier effect is only 10% efficient.

Next, we were looking at another cup filled with hot water. A piece sat around the rim of the cup that had a cyclic compressor attached that moved up and down similar to a pendulum. A fan was attached to the top of this piece as well, showing that energy was being produced. Heat is transferred to and from gas at different temperature levels. This was known as the Stirling Engine developed in 1816 by Robert Stirling. Steam engines were extremely dangerous causing many deaths among workers due to explosions. The purpose of the Stirling Engine was to eliminate steam engines with a safe, more efficient energy source. This alternative energy source is 60% efficient.

At last we saw the Piezo Electric effect. Tom showed us a BBQ lighter, breaking down the system of how it works into a simpler form. A small rectangular cortz crystal is squeezed to produce the flame from the lighter and increasing voltage known as the Piezo Electic effect. Lawnmowers and radio transmitters function in a similar way. We compared this with a solar powered engine. The solar cells convert the light into electricity through magnets from traction and repulsion.

I found all these experiments extremely interesting because of their simple structure to produce something as complex as energy. For the grand finale, we watched Tom attract energy through a wireless transfer. Tom turned on the electric generator that had small tessler coils on the top of the machine that emitted a light that looked like small strikes of purple lightening. First, Tom used a long wand-like tube object filled with neon and mercury. When the wand was the accurate distance from the generator, the tube started glowing, half pink and half blue. It was amazing to see energy transferred through the air!

Tom said, “In science, people are always taking original ideas and looking to improve them.” Hopefully from these simple ideas, we can use our technology and improved knowledge of today to create energy efficient alternatives

Generator Lab

Last week we tested the voltage increase of a magnetic flashlight given the intensity and number of physical shakes, along with the help of LabView software. The objective behind the experiment was Faraday’s Law: The induced electromotive force (EMF) in any closed circuit is equal to the time rate of change of the magnetic flux through the circuit (Wikipedia). In other words, the forward and backward movement of the magnet between the coiled wires will cause electrical currents to generate in the flashlight.

We were given a specific process on how to perform this lab. We would perform 5 tests, each running 30 seconds long, being sure to keep track of the number of shakes per each test. The first test was to measure the voltage, without shaking the flashlight at all. Next we would begin shaking the flashlight very slowly. After the second test, we realized counting the shakes wasn’t as easy as one may assume. The sound of the magnet shaking inside with the fast moving shakes of the flashlight was distracting. For us, it was easier that one person did the shaking, while the other counted the shakes and timed the 30 seconds (LabView was the timer so we simply just watched the computer screen). For the third test, we were to shake the flashlight a little faster. The 4th and 5th tests would increase speed more each time, by the final test we were shaking the flashlight as fast as possible.

After each voltage trial we made sure to record the data into the Excel spreadsheet. With the LabView program, we could close Excel, perform the next experiment being recorded in LabView, then open the saved spreadsheet in Excel and the new test results would be there.  After we had all our data we found the sum of squares of the voltages using (v2). The sum of squares finds the average number between the points showing a line in regression the graph. In the graph, this shows the voltage points between each shaking intensity. In this experiment we found that more is more is more. The higher intensity shakes with a greater number of shakes showed more voltage generated.  Below is a link to the excel spreadsheet.

GeneratorLab

MIT Nuclear Reactor

This past week we went to the nuclear reactor at MIT.  I felt fortunate enough to be apart of what goes on behind a nuclear reactor plant. It took us a few minutes to find the right place, but once we were there, it was apparent. There was someone waiting for us at the front desk, immediately discussing safety precautions we needed to know before seeing the plant. Our tour guide began by taking down everyone’s names and in exchange, giving us a radioactive tracker with a specific number and read level that was written down as well. Once everyone was situated, we began our tour.

First, our tour guide began with basic information about the plant. The reactor is generally kept at 50 degrees Celsius. Captured heat goes into the secondary system then into the cooling towers. Evaporation equipment is used where the temperature drops to 30 degrees Celsius. The fuel is in the core of the reactor, which is about the size of a 30-gallon trash barrel. It is inspected every six months to make sure the core is not being blocked. It is currently HEU based, one of the two plants left in the United States to be converted to LEU. About 2,200 gallons of water is being pumped throughout the reactor every minute to cool the fission and lower energy. It is designed to keep water from boiling around the aluminum. If the reactor met a critical point, power would be significantly increased to stable the fission. D20 reflectors scatter and bounce throughout the core of the plant. There are 6 boron/stainless steel blades that expose the fuel to the reactor around it. The boron’s absorb the neutrons created and remove harmful chemicals. The intent for the MIT nuclear reactor is to create radiation for research.

As we made our way past the buzzing door, we approached a wall with thousands of small circular lights indicating who was in the reactor. It was amazing to see the procedure of monitoring everyone that was in the plant, at all times. We passed a unique looking machine to place your hands and feet on upon exiting the reactor that checked for contamination. Our guide informed us of the difference between radiation and contamination. Radiation is the energy coming off of the radioactive particle. The particle, however, is the contamination. Since safety is a huge concern at this plant, steel and lead are used to protect the workers in the reactor from radiation and contamination. Only 5 REM of contamination are allowed per year. Refueling occurs within the reactor to make sure the system is running properly. Static and neutrons surround the core, often changing so refueling happens every two-three months. Cadmium is used to assist the absorption of the neutrons.

When we were in the basement of the reactor, our guide informed us of various research projects that took place at this particular plant, one of them being brain cancer research. Patients who had become terminally ill were given a certain amount of radiation from the neutron beam. In many cases, the results showed six to eight months more life. Prostate cancer was also another treatment researched and tested at this plant. Gold was placed in the body to irradiate tumors in the particular area. Decay had a half-life of about 2.5 days. A half-life is the period of time it takes for the amount of a substance undergoing decay to decrease by half.

The MIT nuclear reactor tour was one of the most informational fieldtrips I’ve experienced. I learned so much in the short amount of time we were alloted to tour the plant. We also we discovered we schedule tours anytime throughout the year which is great if anyone has company coming to town!


Solar Energy Blog

This week we did an experiment with a solar lab cell. We looked at the different measurements of voltage between the front and back of a solar cell, as well as adjusting the light with different color swatches. We used a ruler to measure the distance of the light to the solar lab cell and measured the voltage produced by LabView. First we started at a distance of zero, with the light directly on the cell. Light intensity is the amount of energy of light. Voltage is the amount of energy, per charge, required to move the charge through the circuit. The stronger the intensity, the more photons produced. A larger amount of photons means a greater current flow and greater voltage. The further away we moved the light from the cell, there was less light intensity and lower voltage. The color swatches affected the cell in a similar way. We used three different color swatches, blue, pink and teal. All swatches were held right on top of the cell. Pink had the highest light intensity, followed by blue and teal with the lowest light intensity. Below is the tables and graphs of our results.

Solar Cell Lab

Electric Vehicle

Electric cars have been designed to better our environment and save energy. They have many potential benefits such as the reduction of air pollution, reduced greenhouse gas emissions and less dependency on foreign oil. An interior electrical energy device, such as batteries rather than gasoline, powers an electric car. A controller regulates the energy based on the amount of power utilized based on the accelerator pedal. Common household electricity recharges the power stored in the car’s rechargeable batteries. There are many automobile companies that have extended their collections with a line of electric automobiles. Honda and Tesla are two companies in the electric car industry with rather new vehicles that are said to significantly improve the electric vehicle and improve the environment.

Tesla is a rather new company, founded in 2003 and on the road by 2008, by a group of Sillicon Valley engineers in California who wanted to prove electric vehicles are best. Two years later, they have 1,650 Roadster vehicles in more than 31 countries.

All vehicles need to over come road-load. Road-load is the resistance to the car whether it be wind, mechanical friction or tire rolling resistance. Road-load is greater at higher speeds due to the increase in wind resistance, resulting in the car using more effort to “push” forward. For Tesla, using less friction by designing new brakes, bearings and other rotating parts of the vehicle can minimize road-load. The chemical energy in an electric car is stored in the battery. Due to high-energy density, Lithium-ion batteries are used in Tesla vehicles. The chemical energy frees electrons resulting in 90% more efficiency, where some energy is lost to heat in current conductors and fuses. In a conventional car, gasoline is stored as the chemical energy. Combustion is used to create chemical energy to thermal energy. Unfortunately, the majority of energy stored as gasoline is lost as heat, where at best, it’s 35% efficient.

Vehicles using hydrogen fuel cell technology are the cleanest vehicles because they only emit water vapor into the air. By driving electric cars, we’re reducing the amount of carbon dioxide emitted into the air and reducing the amount of greenhouse gases. Honda’s new energy efficient car, the FCX Honda Clarity, uses fuel cells to combine hydrogen with oxygen to make electricity.  This is a tunnel that runs between the two front seats of the car, generating electricity but zero exhaust emissions. The clarity is a 20% increase is fuel economy, 30% increase in vehicle range at 270 miles, as well as a new lithium-ion battery pack that is 40% lighter and 50% smaller. Not only has Honda come out with a new fuel cell vehicle but is in progress with the creation of a hydrogen fueling station.

Both companies are to release the new lines of energy-saving vehicles in the near future. However, cars a limited and being accessible to southern Californian’s first.

Pandemics

A pandemic is an epidemic of infectious disease that spreads throughout a large mass of human populations. This could be within regions, nations or world wide. However, if the number of people who are infected by the disease stabilizes, it is not a pandemic, but an endemic. In the movie Contagion, the blockbuster movie that hit theaters a few weeks ago, this highly contagious and deadly disease was most certainly a pandemic. It was effecting any and everyone within it’s path. The disease was killing more people before The Center for Disease Control Prevention (CDC) and health officials could even determine what it was, let alone how to cure it. People all over the world were crazed over the disease that was killing so many in such a short amount of time. Unfortunately, since the CDC and health officials had never experienced such an outbreak with a disease killing so quickly, people were acting like animals because they had no answer or solution to such a deadly and infectious pandemic.

Pandemic of influenza is the most common pandemic. The scariest part of a pandemic is having little or no warning of an outbreak. It can be spread all over the world before we even know what it is. Leading health specialists and disease control specialists have no way of determining when an outbreak may occur, how it’s being spread and how to treat it. There are endless strains from countless diseases that could form. Strains form and mutate in knots that have no sign or predetermination. It could take health officials days before figuring out the strains and even longer for test results to come back. The CDC deals with the outbreaks of these disasters.

The movie Contagion shows the effect such a pandemic has on the people, to members in the CDC, to the doctors trying to figure out where the disease came from and how to keep it from spreading. Matt Damon’s character, Mitch Emhoff, is one of the ordinary, everyday people, who happens to be the first to experience this horrendous infection. His wife Beth Emhoff, played by Gwenyth Paltrow, is the first to be infected with the disease in Hong Kong on a business trip and dies a few days later because of it. Lawrence Fishbourne plays as Dr. Ellis Cheever, a disease control specialist for the CDC. Throughout the the movie he is working with Dr. Erin Meers, played by Kate Winslet, who is an Epidemic Service Officer. She is sent to Minneapolis to begin the investigation and traceback. Unfortunately, while she is away preparing to quarantine the city and take in infected people, she becomes ill with the sickness herself. There will be controversy no matter what the disaster or catastrophe, blogger and journalist Alan Krumwiede, portrayed by Jude Law, posts videos and blogs over the internet that claim he has found a cure for the disease based on forsythia. Panicked people attempt to get a hold of forsythia by breaking into pharmacies and drug stores. Alan Krumwiede begins blaming the CDC for keeping information to the people a secret and accuses Dr. Cheever of only telling his loved ones of the seriousness of the diseases and that they should evacuate the city immediately. Later, it is found Krumwiede was only attempting to enhance the demand of companies producing and distributing the treatment.

The scariest part of the movie is that it could happen. Swine Flu and made cow disease are a few examples, of a much smaller pandemic in comparison to the movie Contagion.


http://www.imdb.com/title/tt1598778/

http://contagionmovie.warnerbros.com/index.html

http://www.csmonitor.com/The-Culture/Movies/2011/0909/Contagion-movie-review


Robotics Activity

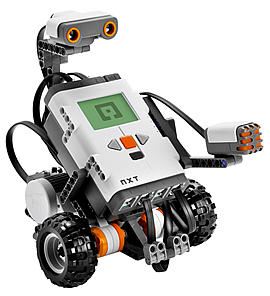
This experiment, Audra and I tested the accuracy of human measurement in correlation to the accuracy of computer systems. We began by building the lego robots; tiny lego piece by tiny lego piece, only following direction from pictures. Once the robot was completed, we plugged USB cords in the designated spot on the robot and then to the computer’s USB port to be calculated by the LabView software. After taking the circumference of one of the robot’s wheels at 5.5 cm, we were ready to begin. We converted the 5.5 cm to meters – 5.5cm x 3.14 / 100% = .1727 m. Getting the most accurate measurement of the wheel would only benefit the rest of our results later in the experiment. After completing this calculation, we made sure all the settings matched in LegoMindstorm. We did three experiment trials, using 1 second each time for the robot’s travel time.

Our first trial started with the power measurement of 75. The robot’s power could be adjusted anywhere between 0-100. We measured .29m where LabView calculated .28. Next we adjusted the power to 25. Audra and I got a measurment of .08m where LabView was a meter less, .07m. Finally, we made the last trial at a power of 85 and measured .34m, much more than LabView with .32m

The formula we used to get the percentage of error = 100% (distance measured – distance LabView calculated) / (avg. of distance measured and distance of LabView)

and % error  = 100{(Dm – Dl)/ [(Dm+Dl/2)]}

Trial 1

Dm= .29               Dl=.28

%Error = 100 {(.29-.28)/ [(.29+.28)/2] }

Error = % 3.5

Trial 2

Dm= .08              Dl=.07 %

%Error = 100 {(.07-.)/ [(.08+.07)/2] }

Error = % 0.9

Trial 3

Dm= .34               Dl=.32

%Error = 100 {(.34-.32)/ [(.34+.32)/2] }

Error = % 6.06


Demand Response

Demand response is for customers to use less energy during times of peak demand. The intent is to manage customer consumption of electricity in response to supply conditions, similar to dynamic demand mechanisms. For example, having electricity customers reduce their consumption at critical times or in response to market prices. The difference is demand response mechanisms respond to explicit requests to shut off, where dynamic demand devices passively shut off when stress is sensed in the grid. Demand response programs are designed to be fiscally and environmentally responsible when demand peaks.

Storms, heat waves, maintenance and power plant repairs effect the supply and demand for electricity, often occurring during the summer season. Demand response is different from energy efficiency, which means using less power to perform the same task constantly or when the task is performed. Demand response is a component of smart energy demand. This includes energy efficiency, home and building energy management, distributed renewable stress and electric vehicle charging.

There are three types of demand mechanisms. First, emergency demand response is to avoid unexpected service interruptions when supply is scarce. Economic demand response is to allow electricity customers to avoid consumption when the convenience  of using electricity costs less than to paying for it. Ancillary service demand response is a number of special services that make sure a secure operation in the transmission grid  that have been originally provided by generators. RTCP Controls is a company that creates effective demand response programs.

http://rtpcontrols.com/public/dema_main.html

http://science.howstuffworks.com/environmental/green-science/demand-response.htm

Demand Response: What It Is & What It Means For You


Fukushima Disaster

The earthquake and tsunami that attacked Japan on March 11, 2011 caused the Fukushima nuclear power plant to collapse. It was the largest of the 2011 Japan nuclear accidents. A series of equipment failure, nuclear  meltdowns and release of radioactive materials made for the largest nuclear accident Japan has seen since the 1986 Chernobyl disaster. Multiple reactors and spent fuel pools make the disaster even more complex.

Emergency generators started up to run the control electronics and water pumps needed to cool the reactors. The entire plant was flooded by the 49 ft tsunami wave, including generators and the electrical switchgear in the reactor basements and externals pumps for supplying cooling seawater. At the time of the quake, reactors 5 and 6 had been shut down for planned maintenance and reactor 4 had been de-fuelled. The rest of the reactors automatically shut down once the earthquake hit.

Connection to the electrical grid was broken as the Tsunami destroyed power lines. Power for keeping the plant cool was destroyed and the reactors started overheating. Extra assistance would be needed to keep the plant cool from the flooding and earthquake damage. Reactors 1, 2 and 3 experienced full meltdown in the days and hours that followed the natural disaster. Hydrogen explosions destroyed the upper housing of reactors 1,3 and 4 with explosions at reactors 1 and 3, damaging the remains of reactor 2 and multiple fire outbreaks in reactor 4.

Fuel rods stored pools in each reactor began to overheat as water levels dropped. Radioactivity releases led to a 12 mile radius evacuation around the plant. Workers suffered radiation exposure and were temporarily evacuated. On March 20 grid power was restored in parts of the plants but reactors 1-4 remained inactive due to damaging flooding, fires and explosions. Areas where repairs were needed through the basement of the plant remained inaccessible because of flooding with radioactive water. It wasn’t until May 5th that workers were finally able to enter the reactor safely since the accident. Areas in Nothern Japan, 30-50km away from the plant showed radioactive caesium levels high enough to cause concern. Food grown in the area was banned from being sold. Iodine and Caesium levels released from those isotopes from Fukushima are of the same magnitude from Chernobyl in 1986. Officials advised that tap water used to prepare food for infants was not used.

Japanese officials assessed the accident as a level 4 on the International Nuclear Event Sales, although view from other agencies thought it should be much higher. Eventually the INES level was raised to a 5 and again to a 7. The Japanese government was criticized for poor communication with the public and improvised clean-up. A workforce in the hundreds or even thousands would take years to even decades to clean up the area.

http://www.independent.co.uk/news/world/asia/why-the-fukushima-disaster-is-worse-than-chernobyl-2345542.html

http://www.naturalnews.com/032035_Fukushima_physics.html

http://www.guardian.co.uk/world/2011/sep/09/fukushima-japan-nuclear-disaster-aftermath