Final Presentation: Peltier Effect

After a semester long of conducting various experiments to learn through actual observations different scientific theories, we were given the opportunity to create and exhibit to another science class our own experiment. As a group we took this challenge as an opportunity to demonstrate our understanding of energy and its many sources. Our first impulse was to build an experiment based on renewable energy such as solar or wind power. Then after thorough discussions we concluded that given the chance to teach others on energy we should consider an experiment that incorporates both the utilization and the generation of energy. We were then reminded of one of the demonstrations of Mr. Vale in our class on the Peltier device, and that was our starting point.

What is the Peltier Effect?

The Peltier effect is when electrical current flows through two dissimilar conductors and depending on the direction of current flow the conductors will either absorb or release heat.

Background

The Peltier effect is named after the French physicist Jean Charles Athanase Peltier (1785–1845), who discovered it in 1834 – eight years after Thomas Seebeck published his results on the first thermoelectric effect, which bears his name.

Peltier found that the junctions of dissimilar metals were heated or cooled, depending upon the direction in which an electrical current passed through them.

Peltier Device

A ‘typical’unit is a few millimeters to a few centimeters thick and is looks like a sandwich formed by two ceramic plates with an arrangement of Bismuth Telluride in between. It is important to emphasize that inside the Peltier device we will find the p-type and the n-type semiconductors which are normally connected through cooper material.

Why is it relevant?

Peltier devices are used to build refrigerators or to convert thermal energy into electric energy. Other usage of this technology is applied to generate power for satellites or space shuttles because the battery life is not sufficient. Central Processing Units for PC have also benefited from the Peltier effect. One of the most common usages, one that we come across in our everyday life would be the camping coolers.

EXPERIMENT

Objective

The purpose of the experiment is to determine how changes in temperature affect the levels of electrical voltage generated and vice versa where input of voltage would create temperature differences in the Peltier device. We will then determine what and if there is a correlation between these concepts.

To familiarize the students with the terms we would be using we have noted down some important ones.

Heat – Energy transferred in a thermodynamic system through kinetic energy. Energy is transferred from particle to another in thermal conduction. Also known as heat energy

Thermoelectric Effect – It is the direct conversion of temperature (heat energy) to electric voltage. Temperature difference created when voltage is applied and generated when varying temperatures are applied. Also known as the Peltier Effect

Voltage – the electric driving force that determines an electric current. Voltage is the equivalent to energy per unit.

Voltage Source – an electric circuit in which the voltage across is different than the voltage within.

Conducting the Experiment

Our experiments consists of two parts: the first is to generate noticeable temperature differences in the Peltier device by applying two different voltage measurements 2V and 5V; while the second is to generate voltage by increasing the temperature differences in the device through an ice cube.

When we were presenting the experiment to the class, the group had some technical difficulties because the devices are very sensitive and do overheat quickly. Regardless, we were able to deliver substantial results to demonstrate the application of the Peltier effect.

RESULTS

In the first part of the experiment, when we applied two different voltage inputs we recorded a temperature difference between 5 to 7 degree Celsius. While during the second part of the experiment, we measured the voltage output in two scenarios: first we just held the device in the hand, so that the warmth of the hand would create temperature difference with the cold side- the results was about 0.1 joule in voltage. In the second scenario we placed an ice cube on the cold side of the Peltier device- the results were significant- we generated almost 2 joule of voltage.

Impressions

The group presentation can be considered an overall success. During our demonstration of the Peltier effect the class seemed to enjoy the experiment; several members of the class came and experienced firsthand how the device works and felt the temperature differences of the device. The students who participated in the experiment enjoyed what they discovered. Throughout the presentation we were asked questions such as: what this device is used for in the present and what is the cost of the device. The class as a whole was polite and seemed interested in what it was that we were trying to convey to them. To make more interesting we emphasized on the importance of such effect and its current usage in space shuttles, coolers, and CPU. We also pointed out that we all should be thankful to Mr. Peltier, as it is because of him that people today enjoy appliances such as refrigerators.

TEAM:

Gentiana Spahiu, Courtney Hughes, Caroline Gendron, Helene Aufranc, Anna Sideri, Belcium Birilik

SOLAR ENERGY

Gentiana Spahiu

(You can find the word format of the lab with all the graphs at: solar-lab)

Being that we have spent so much time in class talking about energy, its use and its necessity as well as the different forms of how the energy could be captured and used to our benefit at the lowest cost, Solar Cell Lab would be a great demonstration of such opportunities. Solar energy is classified as a renewable source and a potential candidate to substitute the current expensive (long term and with regards to global warming) use of fossil fuels.

Facts on Solar Energy:

+  Solar energy is the heat and the light that derives from the sun.

+1990- A world record was set when a solar powered aircraft flew 4060km across US, using no fuel.

+It can be used to: heat up or cool down a house, create electricity, power cars, cook, communicate, and much more.

+Solar energy could be captured and stored in batteries, reflected, insulated, absorbed and transmitted. *

+It takes about 8 minutes for the sun light to reach earth- therefore when we see the sun set- the sun had been gone for 8 minutes.

Solar energy is at no cost to us.

+ All television and communication satellites are powered by solar panels.

+  Currently- turning the solar energy into electrical energy is quite costly.

Back to the classroom setting

To conduct the experiment we were provided with a solar cell, one voltage probe, a light source (flashlight), colored film filters, and a ruler. It is important to emphasize that our lab-marathons have always run on NXT robots and the LabView application, which also are present in this experiment.

The objective of this experiment is to familiarize us with the relationship between the light intensity, its wavelengths, and the voltage output of the solar cell.

Experimenting…

There are two parts of this experiment. First we measure the voltage output of the solar cell under different wavelengths. Second we observe the correlation between the light intensity (through colored filters) and the voltage output.

Part 1:

We connected the solar cell with the NXT adapter and the voltage probe and ran the LabView application. The data retrieved was recorded in an Excel spreadsheet. We call the first run the Baseline. We then placed the solar cell on the table, placed the flashlight (turned on) on top of it and ran the program again to retrieve data for the No Distance test.

DISTANCE

VOLTAGE

0

9.4032994

5

0.613124667

10

0.570785667

Afterward we decided to look at the voltage output of the solar panel with two different distances (measured with the ruler) from the light source, one at 5 inches and the next at 10 inches.

All the data was recorded into the Excel sheet. The table and the graph demonstrate the findings:

Part 2:

With the solar cell on the table and a constant distance of 5 inches we ran the test 3 more times, each time using a different color filter- respectively yellow, blue, and red. We then gathered the recorded data from the spreadsheet and build a table and a graph to demonstrate how the voltage output is affected by the light intensity. Here are the findings:

***The data in the table is the average of 30 points measured in two minutes.

BLUE

YELLOW

RED

0.59801

0.61268

0.625948

Conclusions:

As expected on part one the highest voltage output happen when there was no distance between the solar cell and the source of light. In addition, from the second part we found out that the color red was a stronger receptor transmitter of light because of the highest voltage output. On the other hand, the color blue test resulted in the lowest output. In regards to the wavelengths of the colors, red has the longest, followed by yellow and lastly the shortest is the blue color. Interestingly the voltage output followed the same pattern, thus we can safely assume that the longer the wavelength of colors (brighter colors) the higher the voltage output of the solar cell.

The above picture represents the largest solar-powered building in the world- China, 2009

THERMAL HEATING

Gentiana Spahiu

There are multiple ways for students to learn theories, techniques and other information they would eventually need in their lives and I believe that the best way of teaching is through demonstration and student activities. The chapter of Lab experiments continues with yet another demonstration of things we know just because we are told of them. And yet again we have the chance to actually perform and witness different dynamics of substances, events, and chains of actions and reactions.
The Lab on Thermal Heating would inform us on the amount of energy absorbed by various liquids with different characteristics when heat is involved. (A copy of the lab in word format:
Thermal Heating Lab)

For this experiment we were provided with two 100 ml beakers where one contained 80 ml of water and the other carried 80 ml of vegetable oil, both of room temperature. We were also given a hot plate (something similar to what they used to cook a while back) and two temperature probes. Last but definitely not the least, we were provided with access to our constant companions of these labs:  NXT Motor and LabView application. To conduct the experiment the professor pointed out the famo

us formula of the day would be:

Δ
E=m c ΔT= volume c ΔT

where :

Δ E: Amount of energy absorbed (J)

m: mass of a liquid (g)

c: Heat capacity: (J/g-K)

ΔT : change in temperature (K)

r: mass density (g/ml)

Looking at the formula and at the experiment instructions we realized that some prep work was needed. First we plugged the hot plate and set it to 1.5 to warm up. Then the formula required that we researched the internet to find the heat capacity (c) and mass density (r) of both water and oil.

GOOD TO KNOW:
Heat capacity or Thermal Capacity: the measurable physical quantity that characterizes the amount of heat required to change a body’s temperature by a given amount. It is usually measured in Joules per Kelvin.

Mass Density: material’s mass per unit volume.

WATER

OIL

22.351101

20.32272

22.351101

20.22076

22.351101

20.22076

22.250099

20.22076

22.250099

20.42462

22.250099

20.628241

22.351101

20.83165

22.351101

20.933281

22.452049

21.23786

22.552971

21.339279

22.65386

21.64328

22.85552

21.74452

ΔT= 0.504419

ΔT= 1.421

So, we found:
Coil = 2 J/K
r oil = .92

C water = 4.184 J/K r water= 1

On with the Experiment……
Once the hot plate was warmed enough we placed the two beakers of liquids on it and inserted a temperature probe in each of them without touching the glass walls. We then ran the LabView application for a preset time of two minutes to gather the temperature changes in the liquids and record them on an Excel Sheet.
The findings are shown in the table.

Interestingly, when looking at the table we see that the water starts off with slightly a higher temperature than the oil, but as both liquids are warming up and the temperatures are increasing I noticed that Oil was warming up more than water (as expected). When the two minutes were up, the water still had a higher temperature but in terms of temperature oil had absorbed more heat. I found that many were confused on why the water had a higher temperature at the end and I guess we can attribute that to the fact that water initially had a higher temperature to start with. Meanwhile we need to pay attention to the change of temperature in both liquids. In our experiment such change was (initial temp- ending temp.):

ΔTwater= 0.504419

ΔToil= 1.4218

Clearly the oil’s temperature changed the most. Now that we have all the elements needed to plug in the formula we can calculate the energy absorbed by both liquids:

ΔE water = 168.84 J

ΔE oil= 209.29 J

We were then required to calculate the percent error for the experiment and possible the source of it. To compute the error percentage we used the formula:

ΔE water ΔE oil|/Average(ΔE water, ΔE oil) 100%  = 21.4%

The result of 21.4% I thought it was relatively decent considering the human error in conducting the experiment. Other reasons why such error occurred could be the fact that the initial temperatures of the liquids were different (very relevant), the problem our group had with heating up the hot plate and moving the beakers around before we finally inserted the temperature probes (to emphasize here- We never let the probes touch the glass walls).


Conclusion:

As expected the oil heat up faster than the water and this is due to the different characteristics that materials and liquids have. Such knowledge helps people to better define the kind of materials they would use for different projects. A person who is thinking of building a house will certainly consider the different building materials (wood, bricks, or glass) not only in terms of cost but even in terms of heat absorption and retention.

Mr. Vale presenting: Tesla Coils

Gentiana Spahiu

On last Monday’s class we welcomed Mr. Vale again for another delightful presentation on some other remarkable scientific inventions. This time around Mr. Vale introduced us to Tesla Coil and also arranged a demonstration with a medium size device- even though to us it seemed quite big. I had previously heard of Tesla in a lengthy passionate conversation with a friend of mine. He has finished his graduate studies in nanotechnology and he was extremely fascinated with Tesla and his innovations. So, evidently afterwards I had done my little homework on Tesla already. Needless to say when I heard that Mr. Vale was going to talk about Tesla it sparked my attention even more.

Nicola Tesla, Austrian-born inventor, had a difficult childhood because of multiple diseases he incurred. A very eccentric person he never gained popularity as a social person. Tesla since the early years of his life had a fascination with electricity; therefore he decided to dedicate his time to improvements and new discoveries in the field. There are more than 278 known Tesla patents throughout the world and the most celebrated are the AC (alternative current) power transmissions and the Radio. Tesla inventions probably sparked the Second Industrial Revolution. Unfortunately though, for some bitter reasons Tesla has not been recognized and promoted as he should have been, because of Thomas Edison’s shadow in the field. Sometimes even history is written by and for the investors rather than inventors.

Tesla Coil

It essentially is a high frequency air-core transformer, or a resonant transformer. Tesla coils are known to create extremely powerful electrical fields, high voltage, and high frequency alternating current electricity. Under such strong fields fluorescent lights can lit up even in a 50 feet distance without being connected to an electric grid, therefore the Tesla coil constitutes as a wireless transmission of power.

Mr. Vale turned off the lights in the classroom so that the demonstration would be performed in better condition, and it made sense. He then plugged the Tesla Coil in an outlet and amazed us all as he would take different bulbs one by one close to the coil and they would all lit up- all wireless. To add more sensation to the demonstration he extended a wooden stick with e metallic end towards the top of the coil and sparks just burst out in a lightning structure.

If Tesla provided us with the option of wireless electricity, then why are we not implementing it? Indeed scientists are not unintelligent or indifferent towards such inventions, but bigger concerns refrain them from widely applying them. Tesla coils even though generate wireless energy, the strong field damages radios, TV, and even pacemakers, hence their limited use. The Tesla coils are mostly used for scientific experiments, x-ray generation, military experiments, lightings, and individual use.

If only we could find around the side effects of the Tesla coils, then we would surely have had a greener planet.

MAGNETIC GENERATOR


Gentiana Spahiu

March 21st, 2011

MAGNETIC GENERATOR

It only occurred to me later that I had previously (on my last camping trip) used a flashlight where there was no need to get batteries for. I indeed was intrigued and made a note to     myself that when returning to the civilization from the woods I would look into it. Well I never did until now. In the last science class we were asked to carry out the Generator Experiment. We again were provided with all the necessary tools some of which were new and others that we had previously used like the NXT adaptor, NXT motor, and the LabView application. We were handed flashlights where instead of the battery there was a magnetic generator. The generator consisted of a magnet that slid inside a coiled wire which if moved enough would generate enough electricity as to light the bulb in the flashlight. The task of the experiment was to observe and conclude if there is any correlation between the numbers of shakes of the generator (the flashlight) with the voltage output. Through this experiment we are to demonstrate the accuracy of Faraday’s Law which states that alternating the magnetic fluxes through coiled wires we could generate electricity, the faster the change the greater the amount of voltages produced.

EXPERIMENT

We connected the NXT motor with the computer and opened the provided LabView application. Then we attached the voltage probe with the lose wires of the flashlight, the magnetic generator so we can record the currents of electricity that go. For a start we run the application without any shakes so that we could retrieve the baseline data. The data would show the amount of voltage in the flashlight without manipulating it through shakes. After retrieving the baseline data and placing it on an Excel sheet I performed the experiment 5 more times at the same 30 seconds interval but with different shake rhythms. Each time I executed the experiment I had various numbers of shakes: 0, 22, 33, 58, 59, and 76 as I evidently had different voltage measurement. All was recorded on the Excel sheet. Once the experiment was executed I moved on to calculations. As instructed I derived the sum square of the gathered voltage data for every run of the experiment. Then I created a table to demonstrate the findings:

# of Shakes

Sum of the square of the voltages

0

0.131294259

22

146.8104

33

106.708698

58

104.8284

59

122.3611

76

173.3937

Based on these data I configured a scattered plotted graph to visually see if there is a correlation between the number of shakes and the sum square of the voltages. The following is the plotted graph (because of technical problems I was unable to paste it here, therefore I created a PDF format of it- click to open):

graph

CONCLUSIONS

Clearly we see that there is a linear correlation between the number of shakes and the voltage generated. The higher the number of shakes is, progressively greater the number of voltages. Somehow the first experiment after the baseline does not follow this trend and I believe the reason could be the human error. Other than that I conclude that this experiment demonstrated that the Faraday’s Law is accurate. In a nutshell we can safely assume that the more intense the movement of the shake, therefore the sliding of the magnet within the coiled wire, the higher the number of the voltages generated for electricity. Try it yourself:

http://phet.colorado.edu/sims/faradays-law/faradays-law_en.html

Plasma Physics and the AlCator C-Mod

Gentiana Spahiu

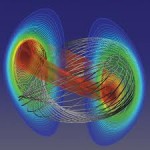
Last Monday’s science class was held at the Plasma Science & Fusion Center of MIT. The purpose of the field trip was to familiarize us with concepts of plasma and its possible use in energy production. At the center we were received by two of the graduate students who are conducting research in plasma physics and magnetic fusion energy. The trip was organized in two parts where in the first 45 minutes one of the grad students Zach Hartwig gave us an overview of what the whole fuss is about regarding fusion energy, how it is achieved, why is needed, and its pros and cons. In the second half we were taken to see the actual lab where the experiments take place and also introduced to the Alcator C-Mod. The Tokamak is a donut-shaped confinement device which through a magnetic system is able to control and contain the fusion plasmas.

What is plasma?

Even though it was only discovered, or rather scientifically articulated, in 1879 by Sir William Crookes, plasma “compromises almost all the visible matter in the universe, approximately ~ 99%.” Plasma is considered to be the fourth phase of the matter. We all are familiar with the first three: solids, liquids, gases. To be taken in consideration is the temperature, or energy, which is essentially what makes the matter float through these phases. The higher we raise the temperature the higher the speed of the molecules in the matter and the greater their distance, which generally brings less density as we move from solids to plasma. The general public is progressively becoming more accustomed with plasma even as a term through many of its current uses. Plasma TVs are some of the most known, despite the fact that plasma etching forms the backbone of the $250 billion semiconductor processing industry, or that plasmas are used in powerful, energy sufficient propulsion thrusters for small spacecraft.”

Another revolutionary use of plasma is in the lighting industry like the compact fluorescent bulbs (CFC).

We measure plasma’s temperature in terms of eV (electron-volt). How does this compare with the most common temperature units that we are familiar with?

1 eV = 11330  ̊C = 20400   ̊ F

We now know Plasma…. So how does Energy come in?


The nucleus of an atom consists of protons and neutron which are bounded together by a very strong nuclear force. The mass

of the atom is more depended on the weight of the nucleus than that of the electrons, and according to Einstein’s formula of Energy E = m*c2 we can derive that mass converts into energy as well. There are two major types of extracting energy out of the atom:

Nuclear fission – Nuclei with large numbers of nucleons are split.

Nuclear fusion – Nuclei with small number of nucleons are combined.

When the temperature is increased to ~100 million degrees the nuclei will and significant amounts of energy will be created. The largest part of the energy that goes into heating up fusion plasma comes from high power radiofrequency (RF) waves.

Alcator C-Mod tokamak

In the second part of the trip we were led into the lab where the plasma fusions take place. The Alcator C-Mod was much bigger than what I initially expected and was surrounded by numerous wires. To demonstrate the durability and the safetiness of the device we were shown in of the 96 bolts they use to keep the tokamak together other than the steel case and the tons of cement. To indicate the efficiency of the bolts, we were told that it only takes 2 -3 of them to hold down the space shuttle. In the last 65 years of experimenting with the plasma fusions they have seen an increase in the efficiency of retrieving the data. First they would only operate the Alcator C-Mod for only a tiny fragment of a second, while now they are able to support it for about 2 seconds and they run it about 30 times a day. To be kept in mind is the fact that one run of the tokamak (2 sec) consumes as much energy as the whole city of Cambridge does in a day. We were also told that the plasma fusion is the largest and the most expensive experiment that MIT is currently conducting and it is DOE funded.

So in a nutshell the tokamak is a magnetically confined nuclear fusion device. It basically controls and contains the plasma fusion through a very strong magnetic field. The three major parts of the Alcator C-Mod are: toroidal magnetic fields coils, central solenoid coils, and poloidal magnetic fields coils.

ITER is one of the biggest global projects of this decade and it is sponsored by several nations. The plant will be build in France and it is estimated to cost about $16 billion.

In conclusion we see a trend that more attention is given to the alternative sources of energy as the na

tions are realizing that with the current resource expenditures and the levels of pollution, renewable energy is part of solution.

References:

The Power Point presentation that Zach Hartwig, the graduate student at MIT who lectured us on plasma and energy.

Mass, Power, Potential Energy….

Gentiana Spahiu

February 28th, 2011

Mass, Power, Acceleration, Battery Discharge, Time, Potential Energy…

Please for a detailed lab blog follow this link lab-21 For some technical reason I was unable to enter the scattered graphs in the blog, but the word format has the complete lab write-up.

Thank you for your understanding.

How inter-related are the above concepts?

In the last two science classes we explored important concepts like, mass, power, and energy and we ran basic experiments to measure how one affects the other. The students were provided with the appropriate tools, like the Pulleys and the weights, the Lego Mindstorm motor, and of course the LabView application which made it that much easier to record and process the data.

We were divided in groups and we were given specific instructions on how to conduct the experiments, what and how to measure the data, the respective formulas for each of the tests. These experiments require us to identify the variables that we are measuring:

Independent variables (the variables we are manipulating): mass, power levels

Dependent variables (the va

riables that are affected by manipulation): acceleration, battery discharge, potential energy, power used.

How would we execute the experiment?

We would attach the pulley to the Lego Mindstorm motor through a USB cable so that the data would be recorded in the LabView application. Then we would attach the different weights in the hook of the pulley and ran the motor so that the weights would be lifted. The recorded measurement would be recorded in the LabView. Through this application we would be able to later manipulate the power level so that we can trace its outcome on the acceleration variable.

After performing the experiments we should be able to conclude based on data the different correlations of mass, force, power levels and power used, time, acceleration, battery discharge, and potential energy.

The following are the experiments that my group and I conducted. We also build scattered charts with the data collected, which makes the relation between what we are measuring more understandable.

Acceleration vs. Mass

In the first experiment, we changed the mass variable to three different measurements: 0.05 kg, 0.13 kg, and 0.25 kg while keeping all the other variables constant to see how the acceleration was affected. In order to gather as accurate of data as possible we executed the test nine times, three times per each mass. This way we would be able to derive consistent results on how the mass change affects the acceleration. Observing the result we can conclude that change of mass indeed affects the acceleration of the motor: the heavier the weight the smaller the acceleration.

Speed (RPM)

Battery disch (mV)

Mass (kg)

Power level

Time (s)

Acceleration(RPM/s)

MASS

Ave Acceleration

87.873192

56

0.25

75

3.249

27.046227

0.25

22.12013

56.13612

14

0.25

75

3.732

15.041833

71.846847

56

0.25

75

2.96

24.272583

87.722965

70

0.13

75

2.392

36.673481

0.13

31.51186

74.822819

97

0.13

75

2.869

26.079756

83.39685

69

0.13

75

2.624

31.782336

81.468841

69

0.05

75

2.637

30.894517

0.05

31.56166

86.405229

41

0.05

75

2.55

33.884403

80.836108

83

0.05

75

2.703

29.90607

Power level

Acceleration(RPM/s)

Average Acceleration

30

2.92634

3.008051

30

2.672375

30

3.425438

50

12.364987

12.18651

50

11.641745

50

12.552812

80

35.650478

33.876445

80

31.80605

80

34.172807

Acceleration vs. Power

The above experiment was performed again, but this time instead of changing the weight we kept it constant and we manipulated the power in three different levels: 30, 50, 80. Then again we watched how the acceleration was affected because of the induced change. We noticed that the change of power with all the other variables virtually constant (weight constant at 0.2 kg) had quite an impact on the acceleration. We concluded that: the lower the power the lower the acceleration of the motor. Following is a simplified table and also the accompanying graph:

Mass (kg)

Battery discharge (mV)

Acceleration(RPM/s)

Average Battery discharge

0.05

69

30.894517

64.333

0.05

41

33.884403

0.05

83

29.90607

0.13

70

36.673481

78.666

0.13

97

26.079756

0.13

69

31.782336

0.25

56

27.046227

42

0.25

14

15.041833

0.25

56

24.272583

Mass vs. Battery Discharge

The third expe-riment consisted running the motor with different weights on the pulley: 0.05 kg, 0.13 kg, 0.25 kg and watch how the battery discharge levels were changing, if they were. Again, we kept all the other variables virtually constant. Looking at the data gathered we noticed that there is some correlation between mass and battery discharge, but it seems like it is not that strong. The R2 of this equations is a merely 0.4785.

Power used vs. Power Levels

The last experiment was a little more elaborated because we had to manually enter certain formulas to calculate Potential Energy before we would graph the Power used vs. levels and see how they were correlated. Initially we use the formula:

Potential Energy = m * g * h

Then, to calculate the Power used we divided the above by the time it required for the motor to lift the weights.

Power used= m*g*h/  t

We noticed that the higher the power level the higher the energy used to lift the weights which was confirmed by the R2= 0.8358. The following are the graph and the simplified table of the experiment.

Mass (kg)

Power level

Time (s)

GRAVITY

HEIGHT

m*g*h

Power used

Power level

0.2

50

4.186

9.8

0.24

0.4704

0.11237458

50

0.2

50

4.264

9.8

0.23

0.4508

0.10572233

50

0.2

50

4.028

9.8

0.26

0.5096

0.1265144

50

0.2

80

2.47

9.8

0.2

0.392

0.15870445

80

0.2

80

2.609

9.8

0.19

0.3724

0.14273668

80

0.2

80

2.518

9.8

0.28

0.5488

0.21795075

80

0.2

30

8.184

9.8

0.25

0.49

0.05987292

30

0.2

30

8.651

9.8

0.25

0.49

0.05664085

30

0.2

30

7.545

9.8

0.27

0.5292

0.07013917

30

In conclusion, this experiment almost objectively showed us how correlated mass, power levels and power outcomes through power used and battery discharge are correlated. This was quite a learning experience for me because it made it that much easier to visualize some theories that we all know and take them ‘as is.’

Demand Response

Gentiana Spahiu

February 14th, 2011

What is Demand Response?

Demand Response entails customers changing their normal consumption patterns in response to changes in the price of energy over time or to incentive payments designed to induce lower electricity use when prices are high or system reliability is in jeopardy.” (1)

Considering this ‘official’ definition of Demand Response (DR), we can safely assume that DR is directly related to price changes in the cost of energy and how the consumers respond to it. DR encompasses numerous programs created to maintain energy consumption in check especially during peak-hours or the “FERC (Federal Energy Regulatory Commission) definition of DR covers the complete range of load-shape objectives and customer objectives, including strategic conservation, time-based rates, peak-load reduction, as well as customer management of energy bills.” (2)

To be in balance, the supply-demand curve needs that at any point when the demand increases the supply mechanism should provide a matching amount of energy. With a price-volatile energy market, at times such excess amounts could be very expensive or even unavailable. Hence the role of Demand Response in such circumstances is crucial because it adds reliability and more control over the prices.

There are two types of Demand Response:

1- Emergency Demand Response

In emergency cases like unusual cold or hot weather, when the amount needed to be supplied to the increased demand is not available, then the electric utility providers call on their emergency programs. This translates into minimal usage of energyfrom commercial and industrial consumers, levels of which are previously defined. Such measures prevent a considerable power outage which could have cost much more than merely reducing the electric usage to a minimal functioning level, consequently making the electricity more reliable and cheaper.(3)

2- Economic Demand Response

The programs in this category help the utility providers help consumers to reduce costs. In a nut shell, even though we, the customers, generally pay a flat rate for kWh, the utility providers pay a fluctuating price throughout the year. The cost that is transferred to consumers is the average price that providers pay, therefore placing the amount of energy consumed directly related to the cost per unit that we use. Economic Demand Response runs programs that provide some incentives to the consumers if they use energy during off-peak hours, or by placing time-based pricing (higher cost rates) to the ones that use it during peak times. (3)

DR programs allow for users to be more aware of their energy consumption and the real-time prices, therefore leading to more educated decisions in how, when, and at what cost and time is more feasible to use electricity.

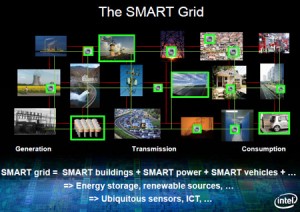
SMART Grid Applications

http://www.youtube.com/watch?v=yGk13U_kgGM&feature=autoplay&list=QL&index=1&playnext=2

What makes the communication possible between the providers and the consumers of electricity are the Smart Application Grids. This technology provides products and services that facilitate the monitoring and the dynamic control of electricity usage. (4) New and better data are collected through such communication networks from which valuable information is generated into improving the distribution system of electricity as well as its consumption rate. Another positive aspect of the Smart Grids is that it has the potential to accommodate renewable energy sources, which perfectly fits with the energy-efficient agenda that the world is pursuing.

Limitations….

A downside of Demand Response is the fact by being just a response; DR has a short life-span and does not treat the issues of the energy consumption from the core. DR routinely breaks certain patterns of electricity usage within the consumers for a limited amount of time, but does not change them. Therefore the benefits derived just by DR programs are generally short-lived, but nonetheless crucial in the master plan of creating an energy-efficient world.

A solution to the above limitation is through pairing up Demand Response with the Energy Efficiency platform. Such coalition would indeed boost the awareness on electricity cost and its effect on the social budget as it would facilitate the accomplishment of the National

Action Plan for Energy Efficiency’s Vision to achieve all cost-effective energy efficiency by 2025.(1)

Interested in knowing what affects the cost of electricity? Measure it….

Wattage   x   Hours used  ÷  1000  x  Price per kWh  =   COST OF ELECTRICITY

1- National Action Plan for Energy Efficiency (2010). Coordination of Energy Efficiency and Demand Response. Prepared by Charles Goldman (Lawrence Berkeley National Laboratory), Michael Reid (E Source), Roger Levy, and Alison Silverstein. www.epa.gov/eeactionplan

2- ELECTRICLIGHT&POWER, What is Demand Response? By Dr. Steve Isser, Good Company Associates, June 2009

http://0web.ebscohost.com.library.law.suffolk.edu/ehost/pdfviewer/pdfviewer?hid=14&sid=8b7de6cc-eb62-4bf4-84fc-cbd19e2927ec%40sessionmgr12&vid=6

3- http://www.energydsm.com/demand-response/

4- Demand Response and Smart Grid Coalition

http://www.drsgcoalition.org/resources/factsheets/Demand_Response_and_Energy_Efficiency.pdf

Mr Vales’ Presentation

Gentiana Spahiu

Last Monday in our science class we were visited by Mr. Vale, the lab coordinator who brought along a box, which I called the “magician’s hat.” One after the other very enthusiastically he brought out a few eco-friendly miniature engines and other interesting objects. He introduced us to the following:


The Stirling Engine: a substitute to the steam engine. The way this device works is based on the temperature differentiation of air and fluid

which results into a net conversion of heat energy to mechanical work (explains the wheel movement). The Stirling Engine was introduced in 1816 and it was considered high efficient operating at 40% compared to the other hot air engines.

The Peltier Engine: 19th century device. This engine is build with two dissimilar metals one of them heated and the other cooled where energy is created as heat travels from one end to the other. Such device is usually used in coolers.

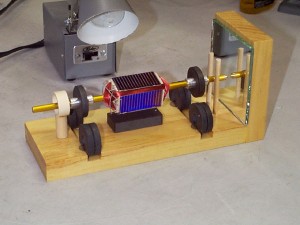
Mendocino Motors were another interesting mechanism. This is a magnetically levitating solar powered motor generally used to demonstrate how solar energy can be converted to electrical or mechanical energy. The magnets on the base create floating movements in the central shaft where solar panels are placed. This movement is transferred into mechanical energy that rotate the motors in the devices.

Bug Zapper: an household gadget to kill insects. It operates with batteries and it kills the bugs through an electric shot.

BIC lighters are build on a small piece of quartz. This metal once it is struck it emits an electrical impulse (piezoelectric effect) which lights the fuel. They are mostly used in lighters.

LEGO MINDSTORM ROBOTS

Gentiana Spahiu

Lego Mindstorm Robots

Technology is ‘almost’ just another word for many of us, until we are introduced to some practical aspects of it. We rarely think of how    most of the appliances or machineries we use today are build. How or what kinds of applications run many of our cell phones, computers,   ATMs and numerous more devices. We take things for granted and go about life until the next ‘big hit’ comes along.

The two past science classes we worked on Lego Robots, not the ones you find at Toy’s R US for children, but rather toys for adults. We were provided with a building kit which included parts of different size and functions as well as a mini computer piece which was the CPU of the car we were to build. The activity was engaging as we were to assemble the car together based on the instruction manual and make it ready to use. The challenging part came when we were required to utilize an application named “Lab view” to create moving patterns for our Robot-Car.

Under the instruction, help and supervision of the professor we put together a program which ‘ordered’ the car to move based on predetermined patterns. The Lab View was a little challenging for me because other than not having used it before, it offered many options which could easily get one lost. Together with my team we were able to replicate a ‘program’ for the car based on professors requirements, which made the Robot –Car to move forward, backwards, break,

play a song while moving and also to go in circle. Another challenge for the group was to make the car drive in a one meter radius circle forwards and backwards. This activity required us to figure out the different speeds that the car wheels had to turn in order for it to complete the one meter radius circle. Another task for us was to measure the distance traveled by the car and also figure out how the distance was related to the number of turns the wheels made. To make us understand the usefulness of Lab View we were asked to manually measure the distance by calculating it according to the formulas provided and compare it with what the predicted outcome of the application stated. Interestingly, the results were quite similar taking in consideration the human error by manually measuring the distances.

This activity made me think how sometimes we take discoveries for granted and how unaware most of us are in regards of the amount of work it goes into creating and building technology so that our lives would be more convenient.