Category Archives: Uncategorized

Solar Cell Lab

solar-energy-experiments-for-kids-img

Solar Cell Experiment

For this week’s experiment, my teammate Xiaofeng Zheng and I performed an experiment to generate a voltage using solar cells. The purpose of this experiment was to Look at what the light intensity is, how that affect the voltage we generated and look at how the color of the light affects the voltage that we generate.

In order to do it, we performed two (2) experiments followed by series of steps.  For experiment #1 we took a solar cell and a flashlight we shined on the solar cell and monitor for 30 second the amount of voltage we got as a result of it. Measured the distance of how far is the flashlight from the solar cell to obtain light intensity #1 from which we got 30 different data points from which we got the average voltage the next step to obtain a difference intensity of light we changed the distance from which the light shined to the solar cell. These steps were repeated 5 different distances in order to complete the first experiment.

The chart below demonstrates the results obtained with regard to distance and voltage (experiment #1) The five (5) different distances we used in this experiments consisted of 0 cm,  2cm, 4cm, 6 cm and 8 cm.   As we can see from the chart most of the times when we moved the distance farther away from the solar cell, the amount of voltage decreased. This is because the closer the light source to the solar cell the higher the voltage as we discussed in class.

voltage vs distance

The second experiment consisted on, using color filters (which are meant to reflex a particular color of light) We used purple, green blue and red  and measured using four (4) different color filters while maintaining 0 cm distance. The chart below represents our results with regard to the filters by looking at the chart we can see how green allowed for the highest amount of voltage, purple was the second followed by blue while red allowed for the lowest voltage. By doing this experiment we saw dependence on color of light.
voltage vs color

Tesla

N.Tesla

Nikola Tesla (1896)

Nikola Tesla is an engineer and physicist born in Croatia on July 10 of 1856. Tesla moved to America, New York, in 1884 where he was hired as an engineer to work for Thomas Edison at Thomas Edison’s Manhattan headquarters, where he worked for about a year impressing Edison with his cleverness while making notorious improvements to Edison’s inventions. Nevertheless, after a few months working together, Edison and Tesla started to have scientific conflicts which ended their relationship. After several failed attempts his life changed when he developed an alternating current (AC) system and funded his new Tesla Electric Company where he had successfully filed several patents for AC- based inventions.

teslamotor7

Over time, his inventions caught the attention of George Westinghouse, and American engineer and businessman who had been looking for a solution to supply the nation with long distance power. In 1888, Westinghouse purchased Tesla patents becoming a direct competition to Thomas Edison.

In 1890’s Tesla created the “tesla coil” today best defined by the dictionary as “a form of the induction coil for producing high-frequency alternating currents” but in reality, it is a creation by Tesla in his search for wireless electricity. This image below shows in a series of simple steps how this system works

tesla-coil-070914final

How does it work? 

  1. The transformer boost the voltage
  2. The power source is hooked up to the primary coil. The primary coil’s capacitator acts like a sponge and soaks up the charge.
  3. Electric current builds up in the capacitor until it reaches a tipping point. The current streams out of the capacitor into the coil. Once the first capacitor is completely wrung out and has no energy left the inductor reaches its maximum charge and sends the voltage into the spark gap.
  4. The huge voltage current flows through the spark gap into the secondary coil. The energy sloshes back and forth between the two coils.
  5. The secondary coil has a top- load capacitor that concentrates all the current and can eventually shoot out lighting like bolts. (Information by live science)

In addition to all his creations, in 1895 “Tesla designed what was among the first AC hydroelectric power plants in the United States, at Niagara Falls. The  following year, it was used to power the city of Buffalo, New York, a feat that was highly publicized throughout the world.”

Current work and technology in this area

hero-01section-exterior-profile

One of the newest technologies in this area in the Tesla Electric Car, This car claims to be zero emissions and zero compromises utilizing an advanced electric powertrain that delivers “exhilarating performance” The tesla website describes this technology consist of “ only one moving a piece: the rotor. As a result, acceleration is instantaneous, silent and smooth. Step on the accelerator and in as little as 2.8 seconds Model S is traveling 60 miles per hour, without hesitation, and without a drop of gasoline. Model S is an evolution automobile engineering”

-Consist of two (2) motors one in the front and one in the rear

-This car uses a three-phase alternating current (AC) induction motor.

-The motor has two primary components a rotor, which is a shaft of steel with copper bars running through it. The stator surrounds but does not touch the rotor. The stator has two functions: it creates a rotating magnetic field and it induces a current in the rotor.

– A touch screen controls most of the car’s functions

In addition, to all this wonderful creation, the fact that this car is chargeable is not a disadvantage. Tesla has created a wide range of supercharging stations. “The word’s fastest charging station” which are free connectors that charge the tesla car in minutes instead of hours. Yes, the process last longer that a gas station but this stations are strategically placed to minimized stops during long distance travels conveniently located along the road.

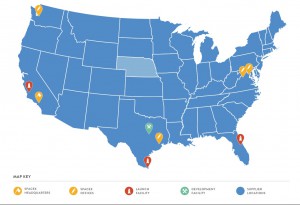
Today we count with 597 supercharger station with 3,481 superchargers. The picture below shows with red dots supercharger locations on the map. 

supercharger

References:

http://www.biography.com/people/nikola-tesla-9504443

http://www.history.com/topics/inventions/nikola-tesla

http://www.livescience.com/46745-how-tesla-coil-works.html

https://www.teslamotors.com/supercharger


Generator Experiment

IMG_2329

Shake it up 

For this week’s lab, we decided to shake up things a little bit. We started working on groups of 3 Carter Hubert, Shahad Alsudais and I worked together in this generator experiment. The lab consisted of demonstrating Faraday’s law which states that changing magnetic flux in a coil produces electricity. The purpose of this experiment was to understand the relationship between the energy and power with a hand powered flashlight

In order to perform the experiment, my group and I each shook the tub for a period of thirty (30) seconds maintaining a constant rate. We each counted the number of times we shook the tub and recorded the number. As we shook the tub, we got 30 data times which then, using an excel spreadsheet we took the numbers recorded by the program and squared each number. The next step was to add the numbers all up and obtain a total. This process was repeated four different times recording different rates of shakes. This was done to obtain 5 different results and create a graph with a trend line which shows the end result of our experiment.

The chart below shows our results obtained with the experiment

chart lab 3

Generally, when doing this experiment, you will expect data to increase with a number of shakes however we experience the opposite as it’s easy to see in the graph below how our numbers actually decreases with the number of shakes. When doing experiments, we are exposed to any form of human errors we might have done during the experiment.

graph lab 3

It possible could mean that the last few trials we were low in energy and our shakes were different which caused an alteration in our final results. Regarding the results of this experiment, the actual practice was good to reinforce the concept of Faraday’s law just discussed in class.

Space X Technology: Making life multi-planetary


3044866-poster-p-1-watch-live-spacex-launches-a-rocket-and-tries-to-land-it-on-a-floating-drone-ship

What is it?

Space Exploration Technologies Corporation best known as SpaceX was founded in 2002 by Elon Musk, PayPal co-founder, in order to “revolutionize space technology.” SpaceX is an American aerospace manufacturer and space transport service that produces and launches rockets and spacecraft. This ambitious company was created with the ultimate goal of making spaceflight an affordable routine and to allow people to live on other planets transforming humans in multi-planet species. What started with an aspiring idea, today occupies about half-million sq ft in facilities in Hawthorne, California with more than 4,000 employees.  SpaceX manufacturing facilities are located in Southern California and their structural test facilities are located in Central Texas, besides these two locations this corporation has a different launch facilities, space offices and supplier locations around the US as best shown in the picture below.

spacex map

The video below displays a quick summary of SpaceX and  its essence 

Analysis + Energy and force concepts used

Most of us have the impression that once we “step out” of planet earth reaching a certain altitude we reach a “zero g” and start to float. According to SpaceX website information, gravity never stops and its range it’s infinite. The reason why astronauts seem to be floating is because they have no net acceleration. “The outward acceleration of (apparent) circular motion, which wants to sling them out into deep space, exactly balances the inward acceleration of gravity that wants to pull them down to Earth.” To complete this action, it’s necessary to utilize kinetic energy. During the process of trials and errors for this corporation, they have encountered that both stage rocket system has a staging altitude of 100km, plus a minus 20km. the rocket booster really consists on how fast it can throw a payload of what mass at roughly 100 km. “The amount of energy needed to achieve a given velocity increases with the square, so going from 0km/h to 2000 km/h, takes four times as much energy as going from 0km/h to 1000km/h, not twice as much. When trying to understand the value of a reusable rocket booster, the kinetic energy transfer at a 100km reference altitude is what matters. That altitude is the equivalent of the starting line of a race. The race itself is the kinetic energy.” Says Elon Musk.

Spacecraft

Falcon 9 / Falcon Heavy and Dragon are the three “vehicles” owned by SpaceX as of today.Falcon 9 is the first rocket completely designed and developed in the 21

Falcon 9 is the first rocket completely designed and developed in the 21st century. This is a two-stage rocket designed to transport satellites and the dragon spacecraft into orbit.

falcon9vertical2


Dragon was designed from the outset to carry astronauts. This spacecraft made history in 2012 by being the first commercial spacecraft in “history to deliver cargo to the International Space Station and safely return cargo to Earth” as of today NASA is working in agreement with SpaceX to make Dragon crew-ready expecting its first text flight in 2 years.

dragon-lab


Falcon Heavy, it’s under construction and will be the “world’s most powerful rocket”  SpaceX is definitely the world’s fastest growing provider of launch services which has launch more than 60 launches on its manifest and has been working together with NASA is several missions.

falcon heavy

We are definitely seeing the future closer to us, and SpaceX seems to be previews what’s next the world.

References:

http://www.nasa.gov/offices/c3po/partners/spacex/

http://www.spacex.com/about

http://www.airspacemag.com/space/is-spacex-changing-the-rocket-equation-132285884/?no-ist

http://www.spacex.com/news/2015/12/21/background-tonights-launch

Lab 2 Pulley Lab

Pulley Lab


For this week’s experiment following the class lecture my teammate, Xiaofeng Zheng and I, performed the pulley lab activity together. The goal of this lab was to study and explore Newton’s 2nd law of force and motion. In order to perform this lab, we used once again the Lego Mindstorm robots to evaluate two different scenarios. The first scenario we did consisted of recording how acceleration changed when the power applied was changed and mass was fixed. While the second scenario consisted of recording how acceleration changed when mass changed and power was fixed both scenarios were performed five (5) different times to evaluate five (5) different values ten (10) time in total.

constant forceconstant mass.jpg graph'

As we were expecting acceleration varies with mass. When we interchanged different values of masses leaving a constant power of 60 acceleration decreased as mass decreased. The graph below shows the results obtained when this scenario was performed

constant force.jpg graph

On the other hand, the acceleration also varied when a power level was changed. When we interchanged different power values leaving a constant mass at 0.24 kg the acceleration increased as power increased. The graph bellow shows the results obtained when this scenario was performed

constant mass

Note: 33 cm were recorded from the bottom of the pulley to the top which was constant during the whole experiment.

Nation’s Energy Grid


smart-grid-1

What is “The grid” or Energy Grid?

“The Grid” essentially refers to the electric grid. It is the electrical system that basically connects electricity producers and consumers all with transmissions and distributions lines and related facilities.  According to smartgrid.gov “Our current electric grid was built in the 1890s and improved upon as technology advanced through each decade. Today, it consists of more than 9,200 electric generating units with more than 1 million megawatts of generating capacity connected to more than 300,000 miles of transmission lines.” Without even noticing we use electricity every day almost in all the activities we perform and it is important to understand how the energy grid works since it is the grid is both complicated and vital for our everyday lives. The nation energy grid is based on four (4) major components: Individuals generators, transmission lines, distribution and consumer use or “load.”

Individual generators: This consists of a range of facilities that generate electricity and it can include natural gas, hydroelectric dams, and nuclear power plants, wind turbines solar panels and more. Their location varies depending on their uses.

energy-coal-power-plant-navajo-generating-station-3

Transmission lines: this are used to carry high-voltage electricity over long distances and to also connect electricity generators with electricity consumer. This can be located overhead or underground.

Row of hydro electric towers Quebec Canada

Distribution: this is the system of wires that collects where transmission lines are left. Normally start at the transformers and end with entities such as homes, schools and/or businesses. The rates of this distribution are regulated by the state.

Consumer use of “load”: This whole process reaches its end when it gets to the consumer (us) where it allows us to turn perform normal activities such as turn  on and on the lights, watch television, wash our clothes etc.

energy-graphic-structure-electricity-grid

What is a Smart Grid or what makes a grid smart?

The use of technology or addition of technology to the grid system allows it to be a “smart grid.” The digital technology allows communication between a two- way system (utility and customers.)  All the controls and sensing used thought the system makes it smart such as the internet, automatization of the system and new technologies working together to bring a better service to the client allowing for a quick respond to the high electric demand.

How does it work?

The smart grid link to connections, while it monitors and measures for competitors of the global financial community. It examines real-time usage while It also provides the consumer with technologies to easily monitor and use their resources while knowing how much they will be paying.


Pros

  • More efficient transmission of electricity
  • Faster restoration and management cost for utilities
  • Allows user to have control over their power bill
  • Reduced peak demand helping to lower electricity rates
  • Increased integration of large-scale renewable energy systems
  • Improved security

Cons

  • Privacy and safety: According to The Wall Street Journal reported that spies from China, Russia and other countries had penetrated the U.S. electrical grid, leaving behind software that could be used to disrupt the system
  • Health: high exposure to the radiofrequency radiation of wireless technologies. “All appliances will transmit wireless data with peak power bursts far above current safety standards – at frequencies between 917 MHz and 3.65 GHz in the ultra-high frequency/microwave ranges of the electromagnetic spectrum, several times a minute.” Said Chellis Glendinning in his article “the problem with smart grids”


References:

  • http://www.ucsusa.org/clean-energy/how-electricity-grid-works#.Vq6UGvkrKhc
  • https://www.smartgrid.gov/the_smart_grid/smart_grid.html
  • http://www.smartmeters.com/what-is-a-smart-grid/
  • http://www.counterpunch.org/2011/03/18/the-problems-with-smart-grids/

Robotics Activity

During our class, we practiced an experiment using Lego robots. This activity consisted of launching a computer software together with the used of the robot and experimenting with three different settings for the motors.  For this experiment, my teammate, Xiaofeng Sheng and I, performed three different trials per power setting in order to obtain different results and evaluate the possible % of errors between each trial. In order to perform the experiment the right way we followed a series of steps to get ready the Lego robot. First with a ruler, we measured the diameter of the wheel and computed the circumference of the wheel in meters then we connected the robot to the computer and played changing the power and recording different numbers provided by the computer software as well as measurements we got by measuring the distance completed in each trial with a ruler.

dc44262c349406a1ddae458599c1bdb9

The following chart shows the results obtained in each trial:

Wheel Diameter= 5.5 cm    Circumference: 0.1728 m

Calculation: C=2 πr

Calculation to obtain % of error = [dm – dc] / (dm+dc/2) * 100%

Set 1 using power= 60 and

time=1

Set 2  using power= 50 and time=1

Set 3 using power= 40 and time=1

TRIAL (A)

TRIAL (A)

TRIAL (A)

Rotation: 442 degrees Rotation: 356 degrees Rotation: 284 degrees
# wheel turns: 1.22778 # wheel turns: 0.988 # wheel turns: 0.7888
Distance: 0.21216 m Distance: 0.17088 m Distance: 0.136 m
Velocity:021216 m Velocity:0.17088 m Velocity:0.136 m

Trial (A) measured by students

Trial (A) measured by students

Trial (A) measured by students

Distance: 22 cm Distance: 18 cm Distance: 14 cm
Margin of error: 3.6283% Margin of error: 5.1984 % Margin of error: 2.6636 %

TRIAL (B)

TRIAL (B)

TRIAL (B)

Rotation: 440 degrees Rotation: 362 degrees Rotation: 283 degrees
# wheel turns: 1.22 # wheel turns: 1.00556 # wheel turns: 0.78611
Distance: 0.2112 m Distance: 0.17376 m Distance: 0.13584 m
Velocity:0.2112 m Velocity:0.17376 m Velocity:0.13584 m

Trial (B) measured by students

Trial (B) measured by students

Trial (B) measured by students

Distance: 22 cm Distance: 18 cm Distance: 14.5 cm
Margin of error: 4.0816% Margin of error: 3.5278 % Margin of error: 6.5233 %

TRIAL (C)

TRIAL (C)

TRIAL (C)

Rotation: 441 degrees Rotation: 360 degrees Rotation: 283 degrees
# wheel turns: 1.225 # wheel turns: 1 # wheel turns: 0.78611
Distance: 0.21168 m Distance: 0.1728 m Distance: 0.13584 m
Velocity:0.21168 m Velocity: 0.1728 m Velocity:0.13584 m

Trial (C) measured by students

Trial (C) measured by students

Trial (C) measured by students

Distance: 22 cm Distance: 18 cm Distance: 13.7 cm
Margin of error: 3.8547% Margin of error: 4.0816 % Margin of error: 0.8503 %

In conclusion to this experiment by looking at the results, we can appreciate that when the power is lower the distance gets shorter and a full rotation is not completed by the car’s wheels. When the power is higher than 50 a full rotation starts to happen in some trials performed by us in the class. As shown in the set where the power reached 60 it shows how the rotation goes over a full turn of 360 degrees. Each trial showed a different margin of error displaying a wide variety of numbers between each trial and each set shows a wide range between each of its trials. Utilizing this method to understand the calculations explained in the class were very helpful to visualize it and understand it while practicing it with the robots. I found the experiment to be a good and different way to understand formulas and utilized then.

Fontus a self-filling water bottle

 A self-filling water bottle


It is not a secret that global warming has become an issue for everyone. We as the world population have to take action in this problem that affects all of us, but in reality in order for this planet to work the way we want it to work and to last as long as we wish we all have to work together. Kristof Retezár, an industrial designer based in Vienna, Austria, knows that we all have to add a little bit of our part to have a better planet, and that’s what he did. Retezár, created a “self-filling water” bottle that attaches to your bicycle. This incredible device, as simple as it sounds collects the moisture contained in the air, condenses it and stores it as safe drinking water for the user.usr-135-img-1397486054-b2d15-535x356

His inspiration for this project was his concerned about water scarcity around the world. This issue is among the main problems for many societies; a big number of regions and places are facing water shortage. According to the United Nations, “water scarcity already affects every continent. Around 1.2 billion people, or almost one-fifth of the world’s population, live in areas of physical scarcity, and 500 million people are approaching this situation. Another 1.6 billion people, or almost one-quarter of the world’s population, face economic water shortage.” If we continued using our water resources as we have up until now future generations will encounter strong challenges.

Using a method that has been mastered in past generations, Retezár goal was to “create a small, compact and self-sufficient device able to absorb humid air, separate water molecules from air molecules and store water in liquid form in a bottle.” This unique water bottle, not only functions as a sporty accessory but this can highly serve on long bike rides or can be even be utilized in a place where obtaining freshwater is a struggle.

How does it work?

The solar-powered device consists of a condensator (which functions like a cooler) that is connected to a series of hydrophobic surfaces that repel water. As the bike-mounted gadget takes in the air, and these surfaces get cold, you’re left with condensation, Retezár said.

Fontus, the bottle name, can produce 0.5 liters of water in one (1) hour under the right climate conditions which will be considered between 86 degrees and 104 degrees Fahrenheit, and according to its creator, Retezár, the water produced will be clean unless the air it’s really contaminated. Fontus, also includes a filter to keep dust and bugs out of the water since its original purposed was to be used in nature where highly contaminated air would not be an issue, however, Retezár said he is working on a future version that could be used in regions of the world where humidity is high, but water is scarce.rendering explicado

Check out this video and see how Fontus works:

http://www.livescience.com/53398-new-bike-attachment-generates-water-as-you-ride-video.html#ooid=l5NXU3MDE65NF7z29smvNQCpI9v2Nbwr


References:

  1. http://www.jamesdysonaward.org/es/projects/fontus-2/
  2.  http://www.un.org/waterforlifedecade/scarcity.shtml
  3. http://www.livescience.com/53401-fontus-converts-humidity-into-water.html
  4. Images credit: Kristof Retezár