Solar Energy Around The World


Solar power has grown exponentially in the last years, driven largely by the need to develop and meet the challenges of energy generation.


This growth has occurred through different mechanisms that have been building out in different countries, which have increased the overall capacity of manufacturing, distribution and installation of this technology.


Screen Shot 2014-03-22 at 6.21.23 PM

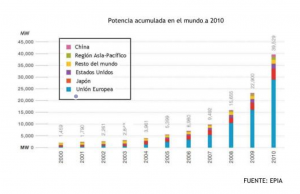
At the end of 2010, the accumulated power in the world, according to the European Photovoltaic Industry Association (EPIA), was 40,000 MVp, of which nearly 29,000 MVp focused on the European Union.


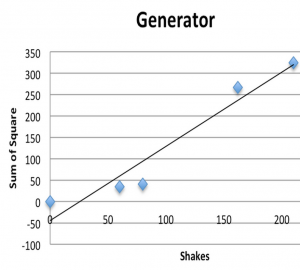
In the graph below we can see the historical representation of the global MV and the great growth that has been experienced. The three areas with higher global interest in this source are: Europe (most notably Germany and Spain with more than 52% of the world total), Japan and USA.


As we can see, the largest increase took place in 2010, which over the previous year, represented a growth of 72%.


Screen Shot 2014-03-22 at 6.24.16 PM

Germany


It is one of the world leaders in the installation of this type of energy, largely because legislation promotes and contributes to the installation and use of renewable energy (“German Renewable Energy Act”). In 2011 were installed near 7.5 GW, which produced 3% of the energy consumed in the country.


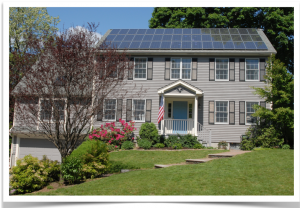
It is very common to find this kind of energy in domestic houses, residents pay a small tax that allows defray in

Japan


This country is characterized by its rapid expansion since 1990, getting to be a world leader in the manufacture of photovoltaic modules, and is among the top 5 in terms of installation.


EEUU


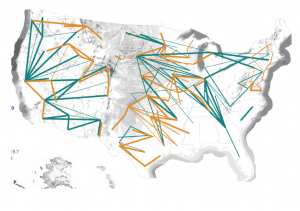
Since 2010 is one of the largest photovoltaic markets activity, and has numerous plants, including the largest plant in the world dedicated exclusively to this kind of energy.


Although USA doesn’t keep a fair policy in all states, have been setting many goals independently as to renewable energy is concerned, allowing a globally growth.


Many homes enjoy their own solar panel, especially in California, built during the “Million Solar Roof” initiative.


The main challenge being pursued is to innovate facilities to become energy directly plug (plug-and-play), ie, make it as accessible and simple as accessing the network.


Screen Shot 2014-03-22 at 6.27.38 PM


Sources:


http://www.energia-solar.org.es/m-energia-solar-usa.html

http://www.censolar.es/menu2.htm

http://web-japan.org/niponica/pdf/07/Niponica_07_digest_Spa.pdf

http://www.csd.ca.gov/Portals/0/Documents/FinalSpanish.pdf

Generator Experiment


In this experiment, we had to study Faraday’s law.


Professor gave us a little generator (magnet that moves back and forth inside a coil of wire), which was connected to a robot, and then finally to the computer. In the computer, Labview VI was open, and let us measure the voltage output of the generator.


Our goal in this experiment was simple, we had to show that the faster you shake the tube, the greater will be the generated voltage.


In a thirty second time interval, we had to count the number of shakes. The data given in the Labview and the number of shakes was registered into excel.


First thing we did is to measure how much electricity would be generated if we don’t shake the flashlight.

Then, we would increase the number of shakes in that thirty second time interval.

We increased the number of shakes 5 times, and the result was this:


Screen Shot 2014-03-22 at 5.52.23 PM


So, finally, we could show that the faster you shake the tube, the greater will be the generated voltage.


Robot #2


This post is about the second day with robots.

I’ll start saying the formula of the error:

Error% = Distance (measured) – Distance (Lab view)


Distance (measured) + Distance (Lab view)                     X 100%


First thing we had to do, is to calculate the circumference of the wheel. (C= Pi * d)


We figured out that it was 5.5 cm and what is the same, 0.055m


Circumference =  Pi * 0.055  = 0.173


Trial 1:


In both wheels the strength was the same (left & right) were 525 degrees.


The distance was 0.249.


We noticed that the left wheel didn’t have the same strength than the other wheel, making our robot goes a little to the left.


We tried this, with the same variables, three times, and we found out that there weren’t any error.


Trial 2:


We decided to change the power in the two wheels, but in a different amount, trying to make the robot going straight. (The left at 504 degrees and the right wheel at 511 degrees).


Number of wheels turned =1.4

Distance = 0.24

Velocity = 0.24

Time Traveled = 1 second


After testing this trial we found an error percentage of approximately 1.5%


Trial 3


We decided to chang the power in both wheel.  (The power in the left wheel, 87, and the right one, 80).


Number of wheels turned = 1.67

Distance = 0.289

Velocity = 0.289

Time Traveled = 1 second


Error:


0.295-0.290

0.295 + 0.290/2  X 100% = 1.7%


-By increasing the power in the wheels the number of wheels turned, distance, velocity, and rotation increase.


Electricity Generation


Electricity can be obtained in many ways. I’ll explain three different sources: coal, natural gas and nuclear power, and how this plants transform those sources in energy.


                                                         -Coal


An electricity generation plant is a station that produces energy from a particular material and a technology used, such as in this case coal.


In the following link we can see a video that shows the process this material passes to be converted into energy:


http://www.youtube.com/watch?v=e_CcrgKLyzc


As we see, the coal is stored in a location near the central park and is driven by a conveyor to a hopper where it is sprayed. Later it is injected into a boiler and is mixed with hot air to be burned; thus the steam is obtained, and this one drives the turbines and makes the electric motor moves, converting mechanical energy into electricity.


The steam used in the previous process becomes liquid by a condenser which acts with cold water from the sea or river.


Screen Shot 2014-03-19 at 9.50.28 PM


Nuclear power


A nuclear power plant uses the heat that is obtained by the fission of uranium nuclei to produce electricity installation. This heat, as in the previous station, is used to generate steam which drives the turbine or generator and power is obtained.


The most characteristic part of a nuclear plant is the containment building, usually composed of a cylindrical base and finished in a dome shape. In this part we can find the main components are the reactor, pressurizer, and coolant pumps.


Once the heat is generated by the fission of the nuclei in the reactor, is transmitted to the refrigerant being liquid and is conducted to the steam generators, where through different pipes get the turbine and is converted into electricity with the help of an electric generator.


Screen Shot 2014-03-19 at 9.52.44 PM

-Natural gas


Natural gas is a combustible gas that is located in nature, in underground reservoirs in porous rocks, and is a mixture of hydrocarbons (mainly methane). It is the most used energy source after oil and coal.


The process can be divided into the following stages: separation, dehydration, refrigeration of gas and liquids and distillation.


Natural gas processing consists of separating all of the various hydrocarbons and fluids from the pure natural gas, to produce what is known as ‘pipeline quality’ dry natural gas. Associated hydrocarbons, known as ‘natural gas liquids’ (NGLs) can be very valuable by-products of natural gas processing. NGLs include ethane, propane, butane, iso-butane, and natural gasoline. The actual practice of processing natural gas to pipeline dry gas quality levels can be quite complex, but usually involves four main processes to remove the various impurities:


1.Oil and Condensate Removal


2.Water Removal


3.Separation of Natural Gas Liquids


4.Sulfur and Carbon Dioxide Removal


Screen Shot 2014-03-19 at 9.55.16 PM

Screen Shot 2014-03-19 at 10.01.06 PM

Sources:


https://primis.phmsa.dot.gov/comm/FactSheets/FSNaturalGasProcessingPlants.htm

http://www.mobilindustrial.com/ind/spanish/yourindustry_energy_coal.aspx

http://www.taringa.net/posts/apuntes-y-monografias/9720762/Que-es-y-como-funciona-una-planta-nuclear.html

http://comunidad.eduambiental.org/file.php/1/curso/contenidos/docpdf/capitulo16.pdf

http://www.circuloastronomico.cl/energia/carbon.html

Germany’s Green Energy Policy


The renewable energy sector in Germany, had a big change by the entry of the Greens in the Federal Government between 1998 and 2005, especially with the law that required to the companies to buy electricity generated from renewable sources.


People who produced energy in their own home, were guaranteed by the State that they would have the chance to sell their “product” at fixed prices for 20 years. This created a boom in the production of clean energy.


The energy conversion is clearly popular. Has an upper 90% support in the polls; and it’s not only for ecological awareness, that is a lot, but for profit: farmers and municipalities make money with renewables.


Between 2005 and 2010, the Federal Government allocated around € 800 million for scientific research in the country.


-Wind energy


In 2005, Germany was the leading country in the world in wind power. One third of the world’s wind power was being generated in this country. Europe contributed 75% of global wind power, with Germany and Spain as leading countries.


Screen Shot 2014-03-19 at 7.30.34 PM

  -Solar energy.


Germany was in 2004 the first world producer of solar PV (363 MW).


In July 2005 in Franconia, Bavaria, opened the largest solar power plant in the world. (not largest anymore).


Screen Shot 2014-03-19 at 7.32.52 PM

  Goals for 2030:


-Reduction of 55% of the emission of greenhouse gases.


-Decrease of 10% of electricity demand by more efficient compared to 2008.


-Save 10% of energy use in transport for 2005.


-50% Of electricity consumption based on renewable energy.


Goals for 2050:


-Decrease between 80% and 95% of emissions of greenhouse gases.


-Reduction of 25% of electricity demand by more efficient compared to 2008.


-Save 40% of energy use in transport compared to 2005.


-80% Of electricity consumption based on renewable energy.


By the way, I found a really interesting information about village in Germany which is self-sufficient in energy. I leave the article in the link below.


http://www.presseurop.eu/en/content/article/4402611-feldheim-model


Sources:


http://www.energias-renovables.com/articulo/alemania-quiere-almacenar-el-viento-en-forma-20131213/

http://www.lavanguardia.com/natural/20140120/54399327504/alemania-recortara-ayudas-nuevas-plantas-energia-renovable.html

http://www.energiadiario.com/publicacion/spip.php?article3126

Robot #1


  Hello, this has been my first class of Contemporary Science and Innovation. I had high expectations for this class before starting it, and at the end, they were actually far exceeded.

  The second part of the class consisted in creating a robot and program it, so it could make simple movements.The first task, was to build the robot, joining parts, and connecting a few cables. What at first seemed quite complicated, it turned out not to be, and easily, between my partner and I, were able to build it really fast.

Screen Shot 2014-03-19 at 6.27.22 PM


The second part was not as easy as the first one… Since we had never used this software, we were a little lost, and the professor had to give us a hand; with what we put our new little friend in motion quickly.


In the link below you can see a video about how our robot was running.


robot 1 – Medium


Hurricane Sandy


First of all, I’ll explain that a hurricane is a tropical storm with winds that have reached a constant speed of 74 miles per hour or more.


Hurricanes are categorized on a scale of 1 to 5 based on their wind speed, a scale known as the Saffir-Si mpson hurricane wind scale.


Screen Shot 2014-03-19 at 5.53.36 PM


Hurricane Sandy began as a tropical wave in the Caribbean on October 19, but it quickly grew up, becoming a tropical storm in just six hours. It was labeled as hurricane on October 24 when its maximum winds reached 74 mph (minimum speed to be considered as a hurricane).


After cutting a destructive path through the Caribbean, Hurricane Sandy made a big damage along the East Coast. Sandy made landfall in southern New Jersey and brought, among other things, flooding and structural damage. New York City was especially hard hit.


Screen Shot 2014-03-19 at 5.57.31 PM


According to NCAR senior climatologist Ke vin E. Trenberth, does agree that the storm was caused by “natural variability” but adds that it was “enhanced by global warming”. One of the facts that made that strength in the storm was the increase in the sea surface temperature offshore the East Coast of the United States; more than 5 °F above normal. As the temperature of the atmosphere increases, the capacity to hold water increases, leading to stronger storms and higher rainfall amounts.


Screen Shot 2014-03-19 at 5.59.46 PM


“Manmade climate change significantly worsened the chances a unique superstorm like Sandy would devastate New Jersey and New York. If humanity’s unrestricted emissions of carbon pollution continue una bated, however, Sandy-type storm surges will become the norm on the East Coast.”


http://www.weather.com/outlook/weather-news/hurricanes/articles/hurricane-what-is-a-hurricane_2010-05-24

http://www.boston.com/bigpicture/2012/10

http://thinkprogress.org/climate/2013/10/28/2843871/superstorm-sandy-climate-change/

The Nation’s Energy Grid

  The U.S electric grid is not actually an unified system, but rather a complex network of local and regional power authorities. It is a giant network of independently owned power plants and transmission lines.

  America’s electric grid is actually comprised of three smaller grids, called interconnections, that move electricity around the country. The Eastern Interconnection, the Western Interconnection and the Texas Interconnected system.

  The power comes from several sources of energy like coal, oil and natural gas.

  In the next picture we can see the approximately 5.000 power-producing facilities in the country that contribute energy to thew electric grid.

Screen Shot 2014-03-19 at 5.22.06 PM


This one represent the solar power capacity of the U.S and the lines that would carry the solar energy into the electric system.


Screen Shot 2014-03-19 at 5.26.03 PM


The next picture represents the wind power.


The green lines represent the wind power transmission lines in 2030; while the orange ones represents the new wind power transmission lines projected after 2030.


Screen Shot 2014-03-19 at 5.27.54 PM


How Energy Grid works:


The electric power is generated at power plants and then it’s moved by transmission lines to substations. A local distribution system of smaller, lower-voltage transmission lines moves power from substations to he customer.


                                                     Screen Shot 2014-03-19 at 5.29.49 PM


Only as something curious, I could mention that was Thomas Edison who created the first commercial power grid, known as The Pearl Street Station, in lower Manhattan in 1882.


Sources:


http://www.npr.org/templates/story/story.php?storyId=110997398

http://energy.gov/articles/top-9-things-you-didnt-know-about-americas-power-grid

http://www.science.smith.edu/~jcardell/Courses/EGR220/ElecPwr_HSW.html