Monthly Archives: March 2014

Hurricane Sandy


First of all, I’ll explain that a hurricane is a tropical storm with winds that have reached a constant speed of 74 miles per hour or more.


Hurricanes are categorized on a scale of 1 to 5 based on their wind speed, a scale known as the Saffir-Si mpson hurricane wind scale.


Screen Shot 2014-03-19 at 5.53.36 PM


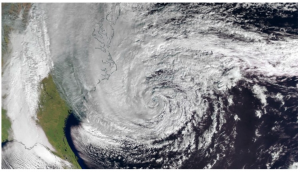
Hurricane Sandy began as a tropical wave in the Caribbean on October 19, but it quickly grew up, becoming a tropical storm in just six hours. It was labeled as hurricane on October 24 when its maximum winds reached 74 mph (minimum speed to be considered as a hurricane).


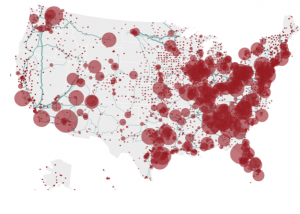
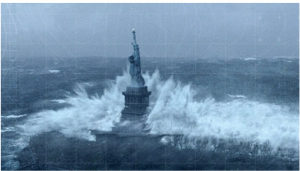
After cutting a destructive path through the Caribbean, Hurricane Sandy made a big damage along the East Coast. Sandy made landfall in southern New Jersey and brought, among other things, flooding and structural damage. New York City was especially hard hit.


Screen Shot 2014-03-19 at 5.57.31 PM


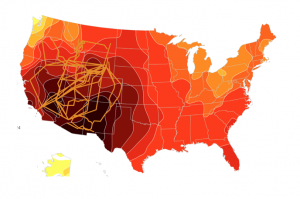
According to NCAR senior climatologist Ke vin E. Trenberth, does agree that the storm was caused by “natural variability” but adds that it was “enhanced by global warming”. One of the facts that made that strength in the storm was the increase in the sea surface temperature offshore the East Coast of the United States; more than 5 °F above normal. As the temperature of the atmosphere increases, the capacity to hold water increases, leading to stronger storms and higher rainfall amounts.


Screen Shot 2014-03-19 at 5.59.46 PM


“Manmade climate change significantly worsened the chances a unique superstorm like Sandy would devastate New Jersey and New York. If humanity’s unrestricted emissions of carbon pollution continue una bated, however, Sandy-type storm surges will become the norm on the East Coast.”


http://www.weather.com/outlook/weather-news/hurricanes/articles/hurricane-what-is-a-hurricane_2010-05-24

http://www.boston.com/bigpicture/2012/10

http://thinkprogress.org/climate/2013/10/28/2843871/superstorm-sandy-climate-change/

The Nation’s Energy Grid

  The U.S electric grid is not actually an unified system, but rather a complex network of local and regional power authorities. It is a giant network of independently owned power plants and transmission lines.

  America’s electric grid is actually comprised of three smaller grids, called interconnections, that move electricity around the country. The Eastern Interconnection, the Western Interconnection and the Texas Interconnected system.

  The power comes from several sources of energy like coal, oil and natural gas.

  In the next picture we can see the approximately 5.000 power-producing facilities in the country that contribute energy to thew electric grid.

Screen Shot 2014-03-19 at 5.22.06 PM


This one represent the solar power capacity of the U.S and the lines that would carry the solar energy into the electric system.


Screen Shot 2014-03-19 at 5.26.03 PM


The next picture represents the wind power.


The green lines represent the wind power transmission lines in 2030; while the orange ones represents the new wind power transmission lines projected after 2030.


Screen Shot 2014-03-19 at 5.27.54 PM


How Energy Grid works:


The electric power is generated at power plants and then it’s moved by transmission lines to substations. A local distribution system of smaller, lower-voltage transmission lines moves power from substations to he customer.


                                                     Screen Shot 2014-03-19 at 5.29.49 PM


Only as something curious, I could mention that was Thomas Edison who created the first commercial power grid, known as The Pearl Street Station, in lower Manhattan in 1882.


Sources:


http://www.npr.org/templates/story/story.php?storyId=110997398

http://energy.gov/articles/top-9-things-you-didnt-know-about-americas-power-grid

http://www.science.smith.edu/~jcardell/Courses/EGR220/ElecPwr_HSW.html