Monthly Archives: March 2014

Fukushima Daiichi


On 11th March 2011 happened one of the most serious nuclear accident in history after the one occurred in Chernobyl.


Screen Shot 2014-03-24 at 5.02.11 PM

One the most violent earthquake recorded and one tsunami off the coast of Japan seriously affected the Fukushima Daiichi nuclear power plant.


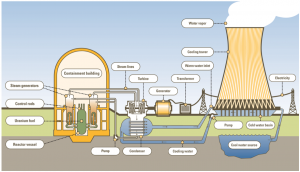
At the moment of the accident there were a total of 6 reactors available, three of them were in operation; immediately after the earthquake they stopped automatically, however, electrical energy was needed to cool them, but the supply of electricity stopped because of the earthquake, so diesel engines were used, but with the subsequent arrival of the tsunami also stopped working. At this time the problems started: unable to cool down, the meltdown of the reactors was confirmed.


Screen Shot 2014-03-24 at 5.05.58 PM

The day after the earthquake, there were several explosions that led to the evacuation of the population within first 20 kilometers and 40 kilometers later, since it was an accident classified Level 7 of INES (radioactivity were released to the exterior).


Screen Shot 2014-03-24 at 5.07.01 PM

Fukushima marked a before and after in the development of nuclear energy.


Japans new energy strategies:


Ambitious Targets Toward 2030:


-Halving CO2 emissions from the residential sector.

-Maintaining and enhancing energy efficiency in the industrial

sector at the highest levels in the world.

-Maintaining or obtaining major shares of global markets for

energy-related products and systems.


+Domestic energy-related CO2 emissions will decline by 30% or

more in 2030


—Securing resources and enhancing supply stability

—An independent and environment-friendly energy supply

structure

—Realizing a low carbon energy demand structure

—Building next-generation energy and social systems

—Developing and disseminating innovative energy technologies


You can see a really clear information about the Specific Measures to Achieve Targets of Japan in the below link (second point):


http://www.jetro.go.jp/mexico/topics/20100708514-topics/01_ANRE_METI.pdf


Sources:


http://energia-nuclear.net/accidentes-nucleares/fukushima.html

http://www.izt.uam.mx/newpage/contactos/anterior/n80ne/fukushima.pdf

http://www.jetro.go.jp/mexico/topics/20100708514-topics/01_ANRE_METI.pdf


Iceland’s Use of Geotermal Energy


Iceland is located in the Mid-Atlantic Ridge, which makes it in one of the most tectonically active places in the world, with great potential to produce renewable energy. It has more than 200 volcanoes and 600 hot springs (high temperature fields reach up to 250º).


Screen Shot 2014-03-24 at 4.50.14 PM


The uses of steam fields are really varied, offering everything from pools to heat homes. Initially, and focusing on geothermal energy, its inhabitants used the hot springs for bathing and washing clothes.


In 1907 they realized that they could give other uses as heating system. Since that moment, and throughout the years, pipes and pipelines were constructed. Through these tubes, hot water got houses, schools and hospitals nearby.


Screen Shot 2014-03-24 at 4.51.59 PM

It is noteworthy that the government has also played an important role at this development as it has economically driven research of this phenomenon in order to take advantage.


Currently this geothermal energy heats more than 60% of households also can generate electricity, space heating, pools, greenhouses …


I should also say that, besides geothermal energy, the region is fed on a larger scale  with hydropower, able to supply a large part of the inhabitants of electricity.


Iceland is the first country in the world that has a primarily fueled by renewable energy economy.


With the next video you could perfectly understand how geothermal energy works in Iceland.


Sources:


http://www.europarl.europa.eu/news/es/news-room/content/20120203STO37172/html/Islandia-experta-en-energ%C3%ADas-renovables-y-en-el-%C3%81rtico

http://www.claneco.com/cl/energia-geotermica-en-islandia/

http://grupo02termo.wordpress.com/


Stirling Heat Engine – Peltier Device


Stirling Heat Engine

Screen Shot 2014-03-24 at 4.21.41 PM

This is a closed cycle heat engine which operates by cyclic compression and expansion of air or other gas at different temperature levels, so the mechanical energy is produced.


It was conceived in 1816 as a competitor of the steam engine by Robert Stirling and its use was limited to various domestic applications that require low power, compared with the steam engine, is more efficient, quiet and easy to use, since you can use it with almost any heat source.


In the below video, you can see how a stirling heat engine works:


http://www.youtube.com/watch?list=PL4AA8E4EB073924A5&v=Dc2QoP0JQSA


At present, due to the compatibility with alternative sources it has become very important, as concerns about depletion and increases in oil prices have led to increase the interest in this type of engine that combines heat and electricity.


Some of its main applications are: automotive engines, electric vehicles, aircraft engines, marine motors, or pump motors.


The Stirling engine is well suited for power systems under water where electrical work is required continuously. Many submarines work from the hand of these engines since 1980, and it is still used today.


Screen Shot 2014-03-24 at 4.24.17 PM

Peltier Device


Also known as thermoelectric modules are small solid-state devices that work as heat pumps, when electricity is applied, the heat is absorbed from one side of the device to the other, so that one will be cold and the other hot (Peltier effect).


It serves to heat exchange without the need for moving parts, that is, to heat or cool in both directions.


Screen Shot 2014-03-24 at 4.25.51 PM

Currently, its most common use is as part of the CPU cooling computers, but can also be found in household dehumidifiers equipment as it is quieter and more compact than the compression system.


Sources:


http://www.physics.rutgers.edu/ugrad/351/oldslides/Lecture11.pdf

https://www.stirlingengine.com/

http://www.heatsink-guide.com/peltier

Solar Energy Lab


In this solar experiment, we were asked to understand the relationship between light intensity and the voltage output of the solar cell as well as the relationship between the wavelength of light and the voltage output of the solar cell.


To perform this experiment, we are provided with one solar cel, one voltage probe, one light source and several colored film filters. We’ll need the same program than with before experiments (Labview VI) to find out the voltage output of the solar cell. Then finally, we’ll had to use Excel to write down all the data and make a chart.


We can distinguish two parts in this experiment.


The fist one, where we just had to put the light over the solar cel without any filter. We repeated this process six times, each time putting the light farther from the cell, so changing the light intensity.


Distance      Average Voltage

0cm              0.069 (no light)

0cm             0.404 Light

5 cm            0.356 Light

8 cm           0.298 Light

10 cm         0.333 Light

12 cm         0.325 Light


Screen Shot 2014-03-24 at 3.43.37 PM

   We can understand with this that the further the distance the lower the voltage; this is due to the fact that the solar cell captures less light when the flashlight is at a greater distance.


In the second part of the experiment, we didn’t change the distance of the light, but we put different colored filters. We tried 5 different times; the first one without filter, and then changing from light blue to red.


In this chart we can see how the filter affect to the voltage even in the distance of the light doesn’t change:


Screen Shot 2014-03-24 at 3.53.14 PM

PS: at the end of the experiment we found out that a cable was a little broken so maybe the data is not exactly.

Solar Energy Around The World


Solar power has grown exponentially in the last years, driven largely by the need to develop and meet the challenges of energy generation.


This growth has occurred through different mechanisms that have been building out in different countries, which have increased the overall capacity of manufacturing, distribution and installation of this technology.


Screen Shot 2014-03-22 at 6.21.23 PM

At the end of 2010, the accumulated power in the world, according to the European Photovoltaic Industry Association (EPIA), was 40,000 MVp, of which nearly 29,000 MVp focused on the European Union.


In the graph below we can see the historical representation of the global MV and the great growth that has been experienced. The three areas with higher global interest in this source are: Europe (most notably Germany and Spain with more than 52% of the world total), Japan and USA.


As we can see, the largest increase took place in 2010, which over the previous year, represented a growth of 72%.


Screen Shot 2014-03-22 at 6.24.16 PM

Germany


It is one of the world leaders in the installation of this type of energy, largely because legislation promotes and contributes to the installation and use of renewable energy (“German Renewable Energy Act”). In 2011 were installed near 7.5 GW, which produced 3% of the energy consumed in the country.


It is very common to find this kind of energy in domestic houses, residents pay a small tax that allows defray in

Japan


This country is characterized by its rapid expansion since 1990, getting to be a world leader in the manufacture of photovoltaic modules, and is among the top 5 in terms of installation.


EEUU


Since 2010 is one of the largest photovoltaic markets activity, and has numerous plants, including the largest plant in the world dedicated exclusively to this kind of energy.


Although USA doesn’t keep a fair policy in all states, have been setting many goals independently as to renewable energy is concerned, allowing a globally growth.


Many homes enjoy their own solar panel, especially in California, built during the “Million Solar Roof” initiative.


The main challenge being pursued is to innovate facilities to become energy directly plug (plug-and-play), ie, make it as accessible and simple as accessing the network.


Screen Shot 2014-03-22 at 6.27.38 PM


Sources:


http://www.energia-solar.org.es/m-energia-solar-usa.html

http://www.censolar.es/menu2.htm

http://web-japan.org/niponica/pdf/07/Niponica_07_digest_Spa.pdf

http://www.csd.ca.gov/Portals/0/Documents/FinalSpanish.pdf

Generator Experiment


In this experiment, we had to study Faraday’s law.


Professor gave us a little generator (magnet that moves back and forth inside a coil of wire), which was connected to a robot, and then finally to the computer. In the computer, Labview VI was open, and let us measure the voltage output of the generator.


Our goal in this experiment was simple, we had to show that the faster you shake the tube, the greater will be the generated voltage.


In a thirty second time interval, we had to count the number of shakes. The data given in the Labview and the number of shakes was registered into excel.


First thing we did is to measure how much electricity would be generated if we don’t shake the flashlight.

Then, we would increase the number of shakes in that thirty second time interval.

We increased the number of shakes 5 times, and the result was this:


Screen Shot 2014-03-22 at 5.52.23 PM


So, finally, we could show that the faster you shake the tube, the greater will be the generated voltage.


Robot #2


This post is about the second day with robots.

I’ll start saying the formula of the error:

Error% = Distance (measured) – Distance (Lab view)


Distance (measured) + Distance (Lab view)                     X 100%


First thing we had to do, is to calculate the circumference of the wheel. (C= Pi * d)


We figured out that it was 5.5 cm and what is the same, 0.055m


Circumference =  Pi * 0.055  = 0.173


Trial 1:


In both wheels the strength was the same (left & right) were 525 degrees.


The distance was 0.249.


We noticed that the left wheel didn’t have the same strength than the other wheel, making our robot goes a little to the left.


We tried this, with the same variables, three times, and we found out that there weren’t any error.


Trial 2:


We decided to change the power in the two wheels, but in a different amount, trying to make the robot going straight. (The left at 504 degrees and the right wheel at 511 degrees).


Number of wheels turned =1.4

Distance = 0.24

Velocity = 0.24

Time Traveled = 1 second


After testing this trial we found an error percentage of approximately 1.5%


Trial 3


We decided to chang the power in both wheel.  (The power in the left wheel, 87, and the right one, 80).


Number of wheels turned = 1.67

Distance = 0.289

Velocity = 0.289

Time Traveled = 1 second


Error:


0.295-0.290

0.295 + 0.290/2  X 100% = 1.7%


-By increasing the power in the wheels the number of wheels turned, distance, velocity, and rotation increase.


Electricity Generation


Electricity can be obtained in many ways. I’ll explain three different sources: coal, natural gas and nuclear power, and how this plants transform those sources in energy.


                                                         -Coal


An electricity generation plant is a station that produces energy from a particular material and a technology used, such as in this case coal.


In the following link we can see a video that shows the process this material passes to be converted into energy:


http://www.youtube.com/watch?v=e_CcrgKLyzc


As we see, the coal is stored in a location near the central park and is driven by a conveyor to a hopper where it is sprayed. Later it is injected into a boiler and is mixed with hot air to be burned; thus the steam is obtained, and this one drives the turbines and makes the electric motor moves, converting mechanical energy into electricity.


The steam used in the previous process becomes liquid by a condenser which acts with cold water from the sea or river.


Screen Shot 2014-03-19 at 9.50.28 PM


Nuclear power


A nuclear power plant uses the heat that is obtained by the fission of uranium nuclei to produce electricity installation. This heat, as in the previous station, is used to generate steam which drives the turbine or generator and power is obtained.


The most characteristic part of a nuclear plant is the containment building, usually composed of a cylindrical base and finished in a dome shape. In this part we can find the main components are the reactor, pressurizer, and coolant pumps.


Once the heat is generated by the fission of the nuclei in the reactor, is transmitted to the refrigerant being liquid and is conducted to the steam generators, where through different pipes get the turbine and is converted into electricity with the help of an electric generator.


Screen Shot 2014-03-19 at 9.52.44 PM

-Natural gas


Natural gas is a combustible gas that is located in nature, in underground reservoirs in porous rocks, and is a mixture of hydrocarbons (mainly methane). It is the most used energy source after oil and coal.


The process can be divided into the following stages: separation, dehydration, refrigeration of gas and liquids and distillation.


Natural gas processing consists of separating all of the various hydrocarbons and fluids from the pure natural gas, to produce what is known as ‘pipeline quality’ dry natural gas. Associated hydrocarbons, known as ‘natural gas liquids’ (NGLs) can be very valuable by-products of natural gas processing. NGLs include ethane, propane, butane, iso-butane, and natural gasoline. The actual practice of processing natural gas to pipeline dry gas quality levels can be quite complex, but usually involves four main processes to remove the various impurities:


1.Oil and Condensate Removal


2.Water Removal


3.Separation of Natural Gas Liquids


4.Sulfur and Carbon Dioxide Removal


Screen Shot 2014-03-19 at 9.55.16 PM

Screen Shot 2014-03-19 at 10.01.06 PM

Sources:


https://primis.phmsa.dot.gov/comm/FactSheets/FSNaturalGasProcessingPlants.htm

http://www.mobilindustrial.com/ind/spanish/yourindustry_energy_coal.aspx

http://www.taringa.net/posts/apuntes-y-monografias/9720762/Que-es-y-como-funciona-una-planta-nuclear.html

http://comunidad.eduambiental.org/file.php/1/curso/contenidos/docpdf/capitulo16.pdf

http://www.circuloastronomico.cl/energia/carbon.html

Germany’s Green Energy Policy


The renewable energy sector in Germany, had a big change by the entry of the Greens in the Federal Government between 1998 and 2005, especially with the law that required to the companies to buy electricity generated from renewable sources.


People who produced energy in their own home, were guaranteed by the State that they would have the chance to sell their “product” at fixed prices for 20 years. This created a boom in the production of clean energy.


The energy conversion is clearly popular. Has an upper 90% support in the polls; and it’s not only for ecological awareness, that is a lot, but for profit: farmers and municipalities make money with renewables.


Between 2005 and 2010, the Federal Government allocated around € 800 million for scientific research in the country.


-Wind energy


In 2005, Germany was the leading country in the world in wind power. One third of the world’s wind power was being generated in this country. Europe contributed 75% of global wind power, with Germany and Spain as leading countries.


Screen Shot 2014-03-19 at 7.30.34 PM

  -Solar energy.


Germany was in 2004 the first world producer of solar PV (363 MW).


In July 2005 in Franconia, Bavaria, opened the largest solar power plant in the world. (not largest anymore).


Screen Shot 2014-03-19 at 7.32.52 PM

  Goals for 2030:


-Reduction of 55% of the emission of greenhouse gases.


-Decrease of 10% of electricity demand by more efficient compared to 2008.


-Save 10% of energy use in transport for 2005.


-50% Of electricity consumption based on renewable energy.


Goals for 2050:


-Decrease between 80% and 95% of emissions of greenhouse gases.


-Reduction of 25% of electricity demand by more efficient compared to 2008.


-Save 40% of energy use in transport compared to 2005.


-80% Of electricity consumption based on renewable energy.


By the way, I found a really interesting information about village in Germany which is self-sufficient in energy. I leave the article in the link below.


http://www.presseurop.eu/en/content/article/4402611-feldheim-model


Sources:


http://www.energias-renovables.com/articulo/alemania-quiere-almacenar-el-viento-en-forma-20131213/

http://www.lavanguardia.com/natural/20140120/54399327504/alemania-recortara-ayudas-nuevas-plantas-energia-renovable.html

http://www.energiadiario.com/publicacion/spip.php?article3126

Robot #1


  Hello, this has been my first class of Contemporary Science and Innovation. I had high expectations for this class before starting it, and at the end, they were actually far exceeded.

  The second part of the class consisted in creating a robot and program it, so it could make simple movements.The first task, was to build the robot, joining parts, and connecting a few cables. What at first seemed quite complicated, it turned out not to be, and easily, between my partner and I, were able to build it really fast.

Screen Shot 2014-03-19 at 6.27.22 PM


The second part was not as easy as the first one… Since we had never used this software, we were a little lost, and the professor had to give us a hand; with what we put our new little friend in motion quickly.


In the link below you can see a video about how our robot was running.


robot 1 – Medium