Solar Energy Efforts and New, Innovative Solar Projects

Renewable energy is defined to be energy that comes from a natural resource such as sunlight, wind, rain, tides, waves and heat. Solar energy is a renewable resource because it uses sunlight to generate power. Using solar energy has many advantages, and that is why so many countries choose to use more renewable energy today. Solar energy is not only cheaper, but it is less harmful to the environment.

The top seven countries who use solar energy are Germany, Spain, Italy, Japan, china, Unites States and Czech Republic.

Germany is the leading country for using solar energy and the leading buyer of solar energy panels. They have installed thousands of solar panels, but they have planned to be using nothing but renewable energy by the year 2050. During 2009, Germany installed eight times more megawatts of photovoltaics of solar energy capacity than America did that year!

Spain is making an effort to use renewable energy more and more throughout the years. Around ten percent of Spain’s energy comes from solar power, which is five times more than the average of two percent in the rest of the world.

Italy’s power consists of nine percent solar power. Every two months, there are more solar energy panels installed in Italy than there are in California during a whole year.

Japan invested $9 billion in an attempt to encourage solar energy within the country, but unfortunately it wasn’t as successful as hoped. Though, in the same year, the prime minister announced that 32,000 public schools within Japan would use solar power.

In 2009, China has grown it’s solar capacity by six thousand percent- from less than one third of a gigawatt of capacity, to 18.3 GW.

In the United States, Americans are showing more interest in solar energy because electricity costs are getting higher. California is the state with the most solar energy with sixty percent of all solar installations in America.

The Czech Republic has been installing solar power since before the year 2007. The Czech Republic doesn’t have as much solar power as the other countries listed, however, those other countries see a lot more sun each year and they have much larger populations. Land is cheaper in the Czech Republic so that increases the growth of solar power significantly. The low cost of buying land has compromised the lack of sunshine each year.

There are also some new solar innovations that could potentially change different countries. These innovations include Bringing light to developing countries, infrared solar energy, building integrated photovoltaics, solar leaf, solar powered mobile gadgets, solar powered transportations, and new solar manufacturing processes. “Green” companies such as Greenlight planet, D.Light, and Angaza Design have developed small, durable solar charging lamps and appliances. These lamps can replace kerosene lamps, which have caused health hazards and frequent accidents. Other companies are developing “microgrids” which are solar panels that provide electricity for up to 100 households.

Only about 60% percent of the light that hits the surface is visible light, the rest lies in the infrared and ultraviolet spectrums. A group of MIT researchers developed a new carbon- based solar panel that can harness the infrared light and visible light. They need very little material so they do not cost much.

Building Integrated Photovoltaics (BIPVs) are thin solar panels that fit into your roof shingles, curtain walls, facades, and windows. BIPVs are a great alternative because they cut out many installation costs on new buildings. These are especially appealing to consumers who do not want a large solar powered rack mounted on their roof.

The “Solar Leaf” is made from a thin silicon solar cell, and when dropped into water, it separates into hydrogen and oxygen molecules connect to fuel cells that produce electricity. They do not create as much energy as traditional solar photovoltaics, but they are cheap to make.

Solar Powered Mobile Gadgets: There are over 1 billion cell phones, and although they take up a short amount of power individually, collectively they take up to 10 trillion pounds of CO2 every year. There are new innovations that with just one hour of sunlight, the SolarKindle gathers enough charge to run your device for three days.

Solar powered transportationis also in effect. Solar powered flights are being worked on as well as electric cars.


Sources:

http://planetsave.com/2012/03/06/top-6-countries-using-solar-energy/

https://joinmosaic.com/blog/7-new-solar-innovations-could-change-world/

http://energyinformative.org/where-is-solar-power-used-the-most/

http://pureenergies.com/us/blog/top-10-countries-using-solar-power/


Lab Friday 9/26 Power Generation

The purpose of this lab was power generation. Faraday’s Law states that changing magnetic fluxes through coiled wires generate electricity (currents and voltage). The greater the change in magnetic flux, the greater will be in the generated voltage. In this lab, we had to shake a flash light, which had a magnet, that traveled back and forth through a coil of wires. The faster the flashlight was shaken, the greater the generated voltage. Our task was to find the number of shakes of the generator, in a thirty second time interval, and the voltages that the generator created. We shook the flashlight six times to collect the data. These were the results:

Screen Shot 2014-10-02 at 11.02.08 PM


Screen Shot 2014-10-02 at 11.08.36 PM


The results prove that the greater you shake the device, the greater the voltage that the coils generated.

Tesla and Fisker Electric Vehicles 10/2

01-2012-tesla-model-s-fd-1347336745

Tesla Electric Vehicle:

Unlike most cars that use fuel power, the Tesla vehicle uses electricity power. These cars play a significant role in reducing gas emissions. The car is powered by either a 6o or 85 kWh battery. Unlike the internal combustion engine with hundreds of moving pieces, the Tesla motor has only one moving piece: the rotor. As a result to this, the acceleration is instantaneous. The Tesla car offers all-wheel drive, comparable to many all-wheel drive cars, which allows it to adjust instantaneously to any road conditions. It’s electronic power steering also automatically reacts to driving conditions to ensure a safe and comfortable drive. The Tesla car comes standard with everything you need to plug into the most common 240-volt outlets and standard 120-volt wall outlets and public stations. Depending on the type of model you get, determines the rate of which the car can be recharged. Model S can be recharged at a rate of 29 miles of range per hour. You can receive a 50% charge in as little as 20 minutes with the Tesla Supercharger.  Most Tesla owners plug their car in at night, like they would do with a cell phone. The Tesla does not have a tailpipe to spew harmful emissions. Gasoline-powered vehicles and hybrids burn refined petroleum. Tesla vehicles can use electricity however it is produced, such as coal, solar, hydro, geothermal, or wind power.


Fisker electric vehicles:

Fisker automotive was established in 2007 by Henrik Fisker and Bernhard Koeler. Their goal was to produce the worlds first premium hybrid electric vehicle. The brand is now under new management and owned by a Chinese company called Wanxiang. The Fisker car pairs a large battery pack and a small gasoline engine to get the most from each element. The batteries can be charged from traditional in home outlets or through a generator turned on by the car’s engine. The car includes an option for roof- mounting solar cells to help recharge the car and an optional solar array for mounting on top of a house or a garage. The makers of the car consider it to be environmentally friendly due to the accents carved out of reclaimed wood and leather seats crafted using 85% of cow’s hide.

2010-fisker-karma-16_600x0w


Sources:

http://www.teslamotors.com/

http://thenewfisker.com/

http://auto.howstuffworks.com/fuel-efficiency/hybrid-technology/fisker-karma.htm

Lab 9-19

The point of this lab was to measure speed, time and acceleration using the lego mindstorm motor to lift weights with a pulley. The applcations we used on the computer were Labview and Excel. First, we had to pick a weight (in grams) between 50-250. Then we had to pick a power level of the motor and a set amount of time in seconds. Once you adjust the power level, it sets the toque on the motor wheel which will result in a particular force used to lift the masses.The higher the power level, the greater the force.  Once we hit start, the scale would react to the instructions that we originally typed into the computer, to let it know what to do. After the scale stopped, the Excel application automatically took down the information for the test including speed (RPM), battery discharge, mass(kg), power, time(sec), and acceleration.


We had to repeat this process four times in order to create three graphs comparing mass, acceleration and power.


These are the results we got for the tests:


Speed Battery Mass Power Time Accel. PE/t
98.71625 0 -42 0 0.08 0 80 0 6.024 0 16.38716 0.036441
108.6957 0 153 0 0.08 0 80 0 3.818 0 28.46927 0.057496
95.28377 0 125 0 0.08 0 80 0 2.085 0 45.69965 0.105285
95.69226 0 111 0 0.08 0 80 0 2.097 0 45.63293 0.104683
123.1702 0 83 0 0.08 0 100 0 1.594 0 77.27116 0.137716
121.3734 0 153 0 0.1 0 100 0 1.597 0 76.00088 0.171822
119.6835 0 69 0 0.12 0 100 0 1.685 0 71.02877 0.195418
118.8207 0 96 0 0.16 0 100 0 1.679 0 70.76875 0.261489
120.8845 0 166 0 0.14 0 100 0 1.711 0 70.65136 0.224524
55.38249 0 166 0 0.1 0 50 0 3.852 0 14.37759 0.071236
70.13761 0 167 0 0.1 0 60 0 3.246 0 21.6074 0.084535
81.51966 0 97 0 0.1 0 70 0 2.619 0 31.12626 0.104773
93.04753 0 139 0 0.1 0 80 0 2.076 0 44.82058 0.132177
104.8212 0 152 0 0.1 0 90 0 1.846 0 56.7829 0.148646
121.2793 0 125 0 0.1 0 100 0 1.579 0 76.80766 0.173781
113.5266 0 97 0 0.1 0 100 0 0.897 0 126.5625 0.305909
113.6508 0 97 0 0.12 0 100 0 1.05 0 108.2389 0.3136
115.0639 0 153 0 0.14 0 100 0 1.279 0 89.96392 0.30036
111.1655 0 97 0 0.16 0 100 0 1.021 0 108.8791 0.43001
108.0931 0 55 0 0.18 0 100 0 0.902 0 119.8372 0.547583

Graph comparing Mass vs. Acceleration:

Mass vs. Acceleration


Acceleration vs. Power Level Graph:


Acceleration vs. Power leverl

For the second step, we had to explore the law of conservation energy by computing the potential energy. The calculations for potential energy=mgh with h as height that the center of mass of the weights travel. My potential energy calculations are on my results sheet.


For the third step, we had to calculate the average power used by the motor. The calculations to find this are :

power used= potential Energy/ time= mgh/time.

same Mass vs. Power used

Same mass vs. Power


The graph shows that there is no curve at all. This is because it doesn’t matter what the power level is, if the mass stays the same, then the graph will stay at a constant.

Coal-fired, Natural gas, and Nuclear Power Plants. 9/25/14

Coal Fired Generation:

Though the 1970’s through the 1990’s, the popular electricity generators were coal or nuclear powered pla

coal-fired-powerplants-jpg

nts. Coal power is an electricity source that provides inexpensive and reliable power. Coal power became more important when oil and natural gas supplies diminished. Coal is used as a substitute energy source for oil and natural gas. In 1995, coal burning produced about 55% of the electricity generated in

the U.S. Coal reserves are expected to last for centuries at current rates of usage. In the coal burning for power process, the coal is crushed into fine powder and fed into a combustion unit where it is burned. Heat from burning the coal is used to generate steam that is used to spin one or more turbines to generate electricity.


Natural Gas Electricity:

Due to economic, environmental and technological changes, Natural Gas electricity has been a very popular fuel generator in the 1990’s because of its clean, burning nature. The Energy Information Administration (EIA) estimates that between 2009-2015, 96.65 gigawatts of new electricity capacity will be added in the U.S. Of this, over 20% will be natural gas emissions. Coal is the cheapest fossil fuel for ge

steam generation unit

nerating electricity, but it is also the dirtiest. Natural gas is a very clean alternative to prevent pollution. The main produ
cts of the combustion of natural gas are carbon dioxide and water vapor, the same compounds we exhale when we breathe. Coal and oil are composed of much higher levels of ha

rmful emissions such as carbon, nitrogen oxides, and sulfur dioxide. Natural gas can be used to generate electricity in a variety of ways. The most basic natural gas- fired electric power generator is the steam generation unit, where fossil fuels are burned into a boiler to heat water and produce steam an

d it turns a turbine to generate electricity. Natural gas may be used for this process.

Gas Turbines and Combustion Engines are also used to generate electricity. In this process, rather than heating steam to turn a turbine, hot gases from burning fossil fuels( natural gas) are used to turn the turbine and generate electricity.


Nuclear Power Plants:

Nuclear power plant

Nuclear Power plants use heat generated from nuclear fission to convert water to steam, which powers turbines to produce electricity. Nuclear power plants operate in most states in the U.S and produce about 20% of the nations power. When an atom of nuclear fuel (ura

nium) absorbs a neutron, the uranium will fission into two smaller atoms and release one to three neutrons. The kinetic energy of the waste is used to convert water to steam which produces electricity. The cons about this process, are that it is very dangerous. If none of the neutrons are absorbed by another uranium atom, then the reactor dies out. If this happens too much, then the reaction grows extremely quickly and could explode. An accident like this could result in dangerous levels of radiation that could affect the health and safety of thousands of citizens living within a 10 mile radius of the power plant. Fortunately,

local and state government agencies and the electric utilities have emergency response plans and procedures in the event of a nuclear power plant incident. The plans cover two “zones”. One zone covers an area within a ten mile radius of the plant, where people could be harmed by radiation exposure. The second zone covers up to a fifty mile radius from the plant, where radioactive materials could affect water supplies, food crops, and livestock.


The release of radioactive material is so dangerous because the exposure can release radioactive gases and particles into the air. The major hazards to people exposed are radiation exposure to the body from the cloud and particles deposited on the ground, inhalation of radioactive materials and ingestion of radioactive materials. A high exposure to radiation can cause serious illness or death.


Sources:

http://www.rst2.edu/ties/acidrain/iecoal/how.htm

http://naturalgas.org/overview/uses-electrical/

http://www.ready.gov/nuclear-power-plants

http://nuclearinfo.net/Nuclearpower/HowPowerPlantsWork

Robotics Blog

As a class last friday we constructed robots out of legos. To make the robot move, we attached a battery pack to it, and connected a cord from the battery to the computer, in order to tell the robot what to do. To experiment with how the robot moves, you have to set the power level and the number of seconds you want to robot to run. To determine the number of wheel turns, the first step was to find the circumference of the wheels.

C=Pi x (Diameter)            1m=100cm

C=3.14 x (5.75m) = 18 =18cm/100cm/1m=0.18m

# of wheel turns=rotation/degrees/360degrees/rotation

total distance= (#turns) x circumference

velocity=distance/time

My group partner and I chose three power levels and three different times for our sets of calculations. We chose 1 second at 75% power,2 seconds at 80% power, and 1 second at 100% power. These were our results:


group calculations


Then we took the calculations from the computer:

Screen Shot 2014-09-18 at 11.51.58 PM

To find our calculations, we measured the starting point of the robot and the ending point of where the robot was after the test. We measured in cm on a ruler. After the tests, we needed to convert centimeters to meters in order to find the percent error.

Our calculations vs. the computers calculations were a little off so in order to find the percent of the percentage off you need to:


%error= distance we measure-distance computer measures (labview)/ Distance we measured + Distance Labview x 100

These were our calculations for % error:

% error

Based on the percent error data taken, our calculations were not too far off from the computers data. Overall, I thought this assignment was fun and affective. Before the lab, I did not know how to calculate a wheels number of rotations and the distance it traveled so I thought it was pretty cool to learn that!


Blog #2 Hydraulic Fracturing

Hydraulic fracturing, or fracking, is the process in which millions of gallons of water, sand, and chemicals are pumped under ground to break apart the rock and release oil and natural gas. Wells in the ground are drilled vertically hundreds to thousands of feet below the land surface and may include horizontal or directional sections extending thousands of feet. Fracking has created over 35,000 wells in the U.S. Most of us live our lives unknowingly about the processes that help us achieve simple tasks everyday that we usually never think twice about.

The benefits of the Hydraulic Fracturing process is that it provides energy to building local economies. It provides oil and gas to places where conventional technologies are ineffective. It increases our countries energy security, and also improves our ability to generate electricity to heat our homes. Hydraulic fracturing has helped local economies by generating royalty payments to property owners, providing tax

Fracking Diagram

revenues to the government, and creating high paying jobs like construction, hospitality, equipment manufacturing, engineering and surveying, and environmental permitting, just to name a few.


There are some negative effects of fracturing including

-Scientists are worried that the chemicals used in fracturing may pose a threat either underground or when waste fluids are sometimes spilled on the surface of the earth.

-Stress on surfaces water and ground water supplies due to the withdrawals of large amounts of water used in the drilling process.

-Contamination of underground sources of drinking water and surface water due to spills or faulty well construction.

-Harmful impacts from discharges into surface waters or disposal into underground wells.

-Air pollution containing hazardous air pollutants and greenhouse gases.


Natural gas plays a very important role in our nations clean energy future. This is why we use the drilling hydraulic fracturing process to enable greater access to gas in the deep layers of the earth. The positive side is that the Unites States Environmental Protection Agency(EPA) ensures that the natural gas extraction does not come at expenses of public health and the environment. They are trying to do whatever possible to protect the air, water and land where Americans live.


references:

http://www.energyfromshale.org/hydraulic-fracturing

http://www.propublica.org/special/hydraulic-fracturing-national

http://www2.epa.gov/hydraulicfracturing#improving

Blog #1 Energy Grid and Smart Grids 9/12/14

Energy Grid and Energy Sources

An Energy grid is a power grid that delivers electricity from suppliers to consumers.

The energy grid is built up of high voltage electricity transmission lines that transfer from sources to demand centers, distribution lines that connect individual customers, and pipes for oil and natural 
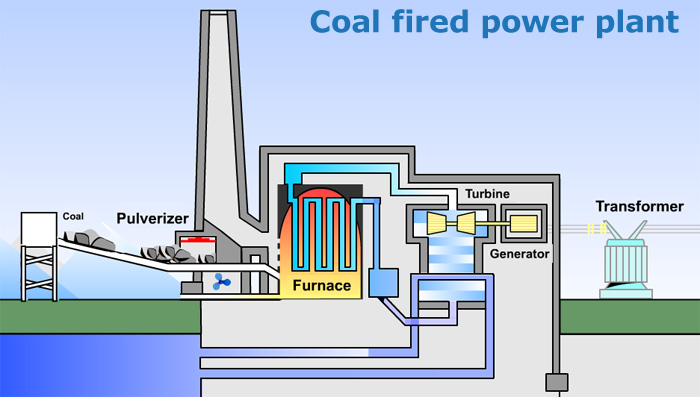
gas. It’s infrastructure also includes facilities that turn raw natural resources into useful energy products. Primary energy sources may include nuclear energy, fossil energy (oil, coal, and natural gas) and renewable sources such as wind, solar, and hydropower. Electricity is a secondary energy source generated by the conversion on fossil, nuclear, wind and solar energy. These sources work together to flow power through our homes.


Smart Grids

A smart grid is an electric grid consisting of a network or transmission lines, substations, and transformers that deliver the electricity from the power plant to the home. However, the digital technology is not ONLY sending electricity to our homes; it is a two-way communication that also exchanges electricity along with information. The smart grid quickly changes to our electric demand. It allows newer technologies to be integrated

such as wind and solar energy production and plug in electric vehicle charging.

Pros associated with the Smart Grid:

  • improved security
  • lower electricity rates
  • lower power costs
  • renewable energy systems
  • more efficient transmission of electricity

Cons associated with the Smart Grid: 

  • A series of failures can affect banking, communications, traffic and security


references:

energy.gov

smartgrid.gov

http://geni.org/globalenergy/library/national_energy_grid/united-states-of-america/index.shtml

http://www.netl.doe.gov/publications/press/2001/nep/chapter7.pdf