The Magic of Electricity

Last week our class watched several demonstrations performed by fellow professor Tom Vale. The demonstration we viewed during class gave us an opportunity to see many of the forms of energy we have learned about and their real life applications. It gave us an insight about how electricity works and how certain objects may be powered using everyday things from around the house.

One of the first demonstrations resembled the picture below. This device is a solar panel attached to a motor and is held up by magnets. When the sun (or a flashlight) hits the solar panels it powers the motor and allows it to continuously spin as long as there is light.


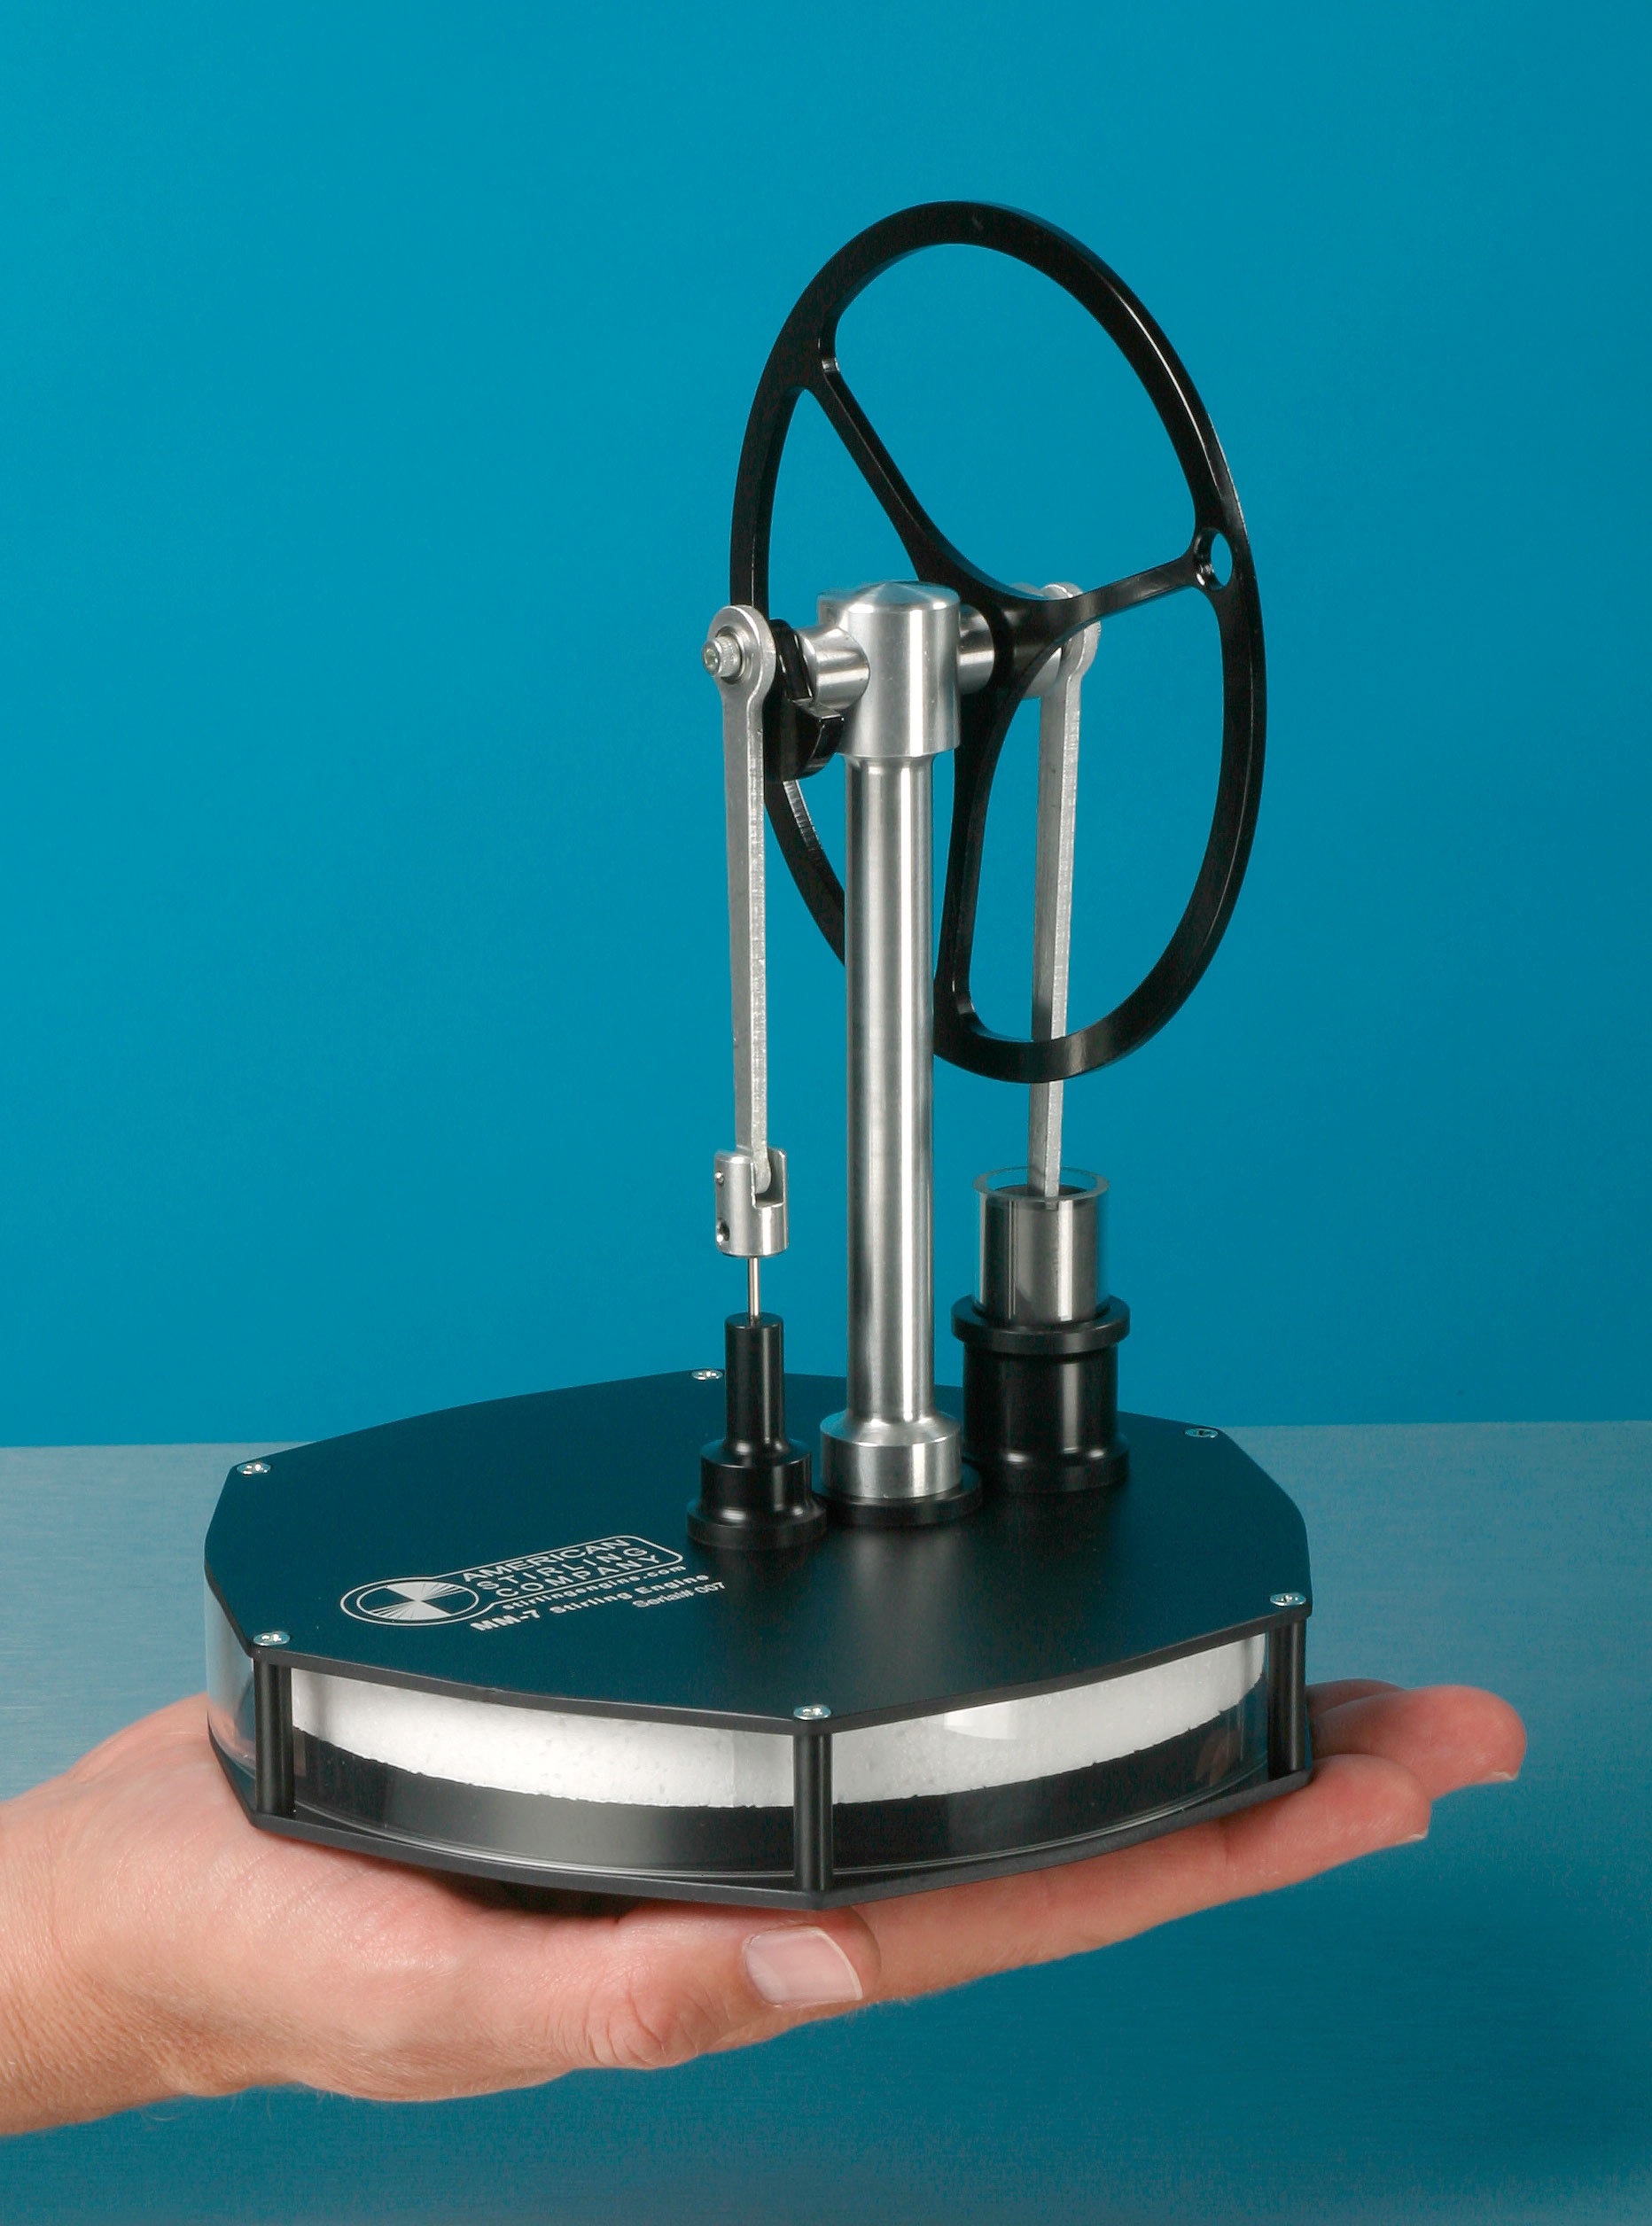
Mr. Vale also showed us something called the stirling engine (pictured below). He placed two valves of the engine in one hot cup of water and one cup that was room temperature. The temperature differential causes a change in pressure and powers the engine. The technology can be used to power submarines because of how quietly it operates.


The most impressive part of the demonstration however was Mr. Vale’s homemade Tesla coil. The tesla coil (as explained in a previous blog post) produces an electric current using a spark gap and a change in the electromagnetic field. Mr. Vale used a variety of glass tubes to demonstrate the power of the coil. One tube was filled with a variety of colored glass and lit up when put near the top of the coil. The second tube that he used was filled with xenon gas (the same thing used in a camera flash) and resembled a blue lightening bolt when touched near the coil and made a crackling noise to match. The last tube was filled evenly with gas but had two different diameters on each end of the tube. He demonstrated that although the gas was the same throughout, the different diameters of the tube turned different colors when brought into the electric field produced by the coil. One end of the tube glowed blue while the other glowed neon pink.


The final demonstration was a series of quack medical devices. These violet ray machines were simply variously shaped class devices that channeled electricity. Decades ago these devices were used to treat basically every ailment known to man. However it was later proven that these devices were actually completely ineffective, and most patients that were “cured” by these devices actually experienced the placebo effect. Depending on the shape of the glass, they were used to treat every section the body for everything ranging from a sore throat to psoriasis.

Pandora’s Promise

Pandora’s promise is a pro-nuclear film created in response to the growing power debate and the pressure to find alternative energy sources. The film points to nuclear energy as a safe alternative due to the fact it contributes little to none pollution and greenhouse gasses.  The movie features many previously anti-nuclear experts who changed their mind and now support this movement. They movie uses key environmentalists and anti-nuclear democrats to show that hey! if these people can be pro-nuclear energy, so can you.

The truth is that nuclear energy is highly efficient, and most definitely can handle the energy capacity needs that wind and solar have failed to do. Nuclear energy is much cheaper overall as well (if you subtract the initial expensive cost to build the plant).

The problem that I have with this film is that although it does address nuclear disasters such as Chernobyl and Fukushima it barely scratches the surface of how truly detrimental these meltdowns were. It describes the overwhelming amount of radiation as “normal” and “natural” using a handheld radiation thermometer. It also downplays what happens to the disposal of all nuclear waste and possible nuclear leaks (Hint: it hurts the environment too).

The movie also tries to cover the other side of the nuclear debate and that is its use for weaponry. Producers tried to cover this debate by pointing out that half of our nuclear energy has come from repurposed Russian war heads but fails to mention the fact that the majority of other threatening countries haven’t given up the technology with the potential to annihilate an entire city.

Overall, this movie works hard to convince any skeptics that nuclear energy is not the infamous harbinger of destruction that its made out to be. Although a lot of evidence clearly points to nuclear energy as a possible alternative, there are also plenty of deterrents that the movie fails to acknowledge. Perhaps when our technology evolves enough to avoid these possibly catastrophic meltdowns and design errors, nuclear energy will have its time. Until then, many will remain unconvinced.

The Presidential Approach

As our planet grows warmer every day, our modern civilization must take responsibility for the growing destruction of earth in an effort to preserve what is left for future generations. In 2013, the executive branch released a “President’s Climate Action Plan” with specific new steps that would be taken by one of the largest polluters in the entire world in order to combat climate change and the growing global crisis. The plan lists many different courses of action that will be taken in order to reduce emissions and promote energy efficiency: below are some of the biggest solutions.


The first solution is cutting carbon pollution from power plants.  Power plants are the largest concentrated source of emissions in the United States, together accounting for roughly one-third of all domestic greenhouse gas emissions. More than 35 states have renewable energy targets in place, and more than 25 have set energy efficiency targets. Limits have already been set on arsenic, mercury and lead pollution but there is no law preventing power plants from releasing carbon into the air.

In April 2012, The Environmental Protection Agency proposed a carbon pollution standard for new power plants under the Obama Administration. The proposal reflects and reinforces the ongoing trend towards cleaner technologies, with natural gas increasing its share of electricity generation in recent years. With abundant clean energy solutions available, and building on the leadership of states and local governments, the Obama administration aims to continue to drive American leadership in clean energy technologies, such as efficient natural gas, nuclear, renewables, and clean coal technology.

Another huge change is increasing fuel economy standards. Heavy-duty vehicles are currently the second largest source of greenhouse gas emissions within the transportation sector. In 2011, the Obama Administration finalized the first-ever fuel economy standards for Model Year 2014-2018 for heavy-duty trucks, buses, and vans. These standards will reduce greenhouse gas emissions by approximately 270 million metric tons and save 530 million barrels of oil. The Obama Administration has already established the toughest fuel economy standards for passenger vehicles in U.S. history and will continue to do so throughout his term. A lot of work has already been done in his second term to tackle fuel emissions for all new diesel trucks and high performance vehicles. These standards require an average performance equivalent of 54.5 miles per gallon by 2025, which will save the average driver more than $8,000 in fuel costs over the lifetime of the vehicle and eliminate six billion metric tons of carbon pollution which is more than the US produces in a year.


The last huge and important initiative is reducing methane emissions. Curbing emissions of methane is critical to our overall effort to address global climate change. Methane currently accounts for roughly 9 percent of domestic greenhouse gas emissions and has a global warming potential that is more than 20 times greater than carbon dioxide. Across the economy, there are multiple sectors in which methane emissions can be reduced, from coal mines and landfills to agriculture and oil and gas development. For example, in the agricultural sector, over the last three years, the Environmental Protection Agency and the Department of Agriculture have worked with the dairy industry to increase the adoption of methane digesters through loans, incentives, and other assistance. In addition, when it comes to the oil and gas sector, investments to build and upgrade gas pipelines will not only put more Americans to work, but also reduce emissions and enhance economic productivity.

Museum of Science

As part of our class, we visited Boston’s museum of science in order to see some of the things we have been learning about in action. We collected information about various exhibits and spent the afternoon looking at related topics.

The first exhibit that was related to our syllabus was the “Catching Wind” exhibit about the use of wind energy and its productivity in the New England area. The exhibit first gives a quick introduction about how wind occurs in the first place (warm air rising and cold air moving to fill the space) and how the wind energy is measured (kilowatts).  The next section of the exhibit breaks down the parts of the turbine and how they actually produce energy when moved by the wind. It also shows a map of Massachusetts and where the wind turbines are located (there are only a few) due to the fact there are few open spaces large enough to house these turbines. The last panel in the exhibit gives pictures of each different kind of wind turbine and how much energy each prospective device generates. Some very clearly produce more than others but are also much larger and require higher wind power to use them.


The next exhibit that we viewed was titled “conserve at home” and was designed to teach the average consumer ways to save electricity and energy in and around their homes. One specific part of the exhibit explored the different lightbulbs options that people use within their homes and how much energy required to power each one. It required the participant to crank a generator until the lightbulb was powered on thus demonstrating which lightbulbs required more energy than others for the same amount of illumination. It concluded that LED lightbulbs only need 8 watts of energy, CFL lightbulbs only need 9 watts of energy, while incandescent lightbulbs need 40 watts of energy to produce the same 450 lumens. I liked this exhibit because you could clearly see how much more energy certain lightbulbs required over others when you had to power the generator yourselves.


Although we have been learning about solar energy through phovoltaics I found one exhibit interesting that explored the other ways we can harness solar energy. Solar collectors use mirrors to reflect all sunlight into one central point which generates enough heat to boil water and use the steam in the same way a coal or petroleum plant would. According to the exhibit, there are three collection methods: towers, troughs, and parabolic dishes.

Below is an example of how the sunlight is reflected to heat the water.


The last exhibit we saw that related to class was titled “Investigate!”. It featured many things relating to our everyday lives and demonstrated many things that you possibly knew about but never understood. For example, one of the parts of the exhibit explored why some foods grow mold quicker and greater than others? Another part of the exhibit (which unfortunately wasn’t up and running) was to investigate if styrofoam cups really your drinks hotter longer? My favorite part of the exhibit however was to investigate what happens when you put various objects in the microwave. I was already aware of what happens which you put marshmallows in the microwave since I have previously done it but what surprised me was what happens when you put soap in the microwave (a similar reaction) and when you put a lightbulb in the microwave (a subsequent energy surge).


This is what happens when you put soap in the microwave for all who wondered as well:

Nuclear Energy

Although nuclear energy has come a long way since it was first developed, the technologies we use are still never 100%. We have experienced multiple nuclear disasters in past decades and although some have been minor accidents others have been detrimental to the environment and the communities surrounding the affected areas.

The largest nuclear disaster in history was undoubtably Chernobyl in 1986. The meltdown was caused by plant operator error combined with a flaw in the design of the reactor. The meltdown was caused by an unexpected power surge, and when an emergency shutdown was attempted, an exponentially larger spike in power output occurred, which led to a reactor vessel rupture and a series of steam explosions. Eventually the reactor ignited when exposed to stored chemicals causing radioactive material to be expelled into the air.

The accident destroyed the Chernobyl 4 reactor, killing 30 operators and firemen within three months. One person was killed immediately and a second died in hospital soon after as a result of injuries received. Acute radiation syndrome (ARS) was originally diagnosed in 237 people on-site and involved with the clean-up and it was later confirmed in 134 cases. Of these, 28 people died as a result of ARS within a few weeks of the accident.

The explosion contaminated thousands of square miles reaching all the way from Russia to Belarus.


The second largest nuclear disaster in history happened in 2011 in Fukushima, Japan. The disaster was caused by a massive earthquake of magnitude 9.0 on March 11th 2011.  In Fukushima, when the victims had been working on cleaning up their surroundings after the earthquake and tsunami, a large explosion occurred at the Fukushima Daiichi nuclear power plant and the piping facility in the building, the facilities for the external power supply and backup power were destroyed. The next day, 12th in the early morning, the leakage of radioactive materials had been found in front of the main gate of the nuclear power plant. The steam was filled in the building by the core melt down caused by the dysfunction of the cooling system.

Lots of radioactive materials were scattered in the environment to reduce the internal pressure and the hydroponic explosions of the nuclear reactors. Based on the data from TEPCO, the amount of radioactive materials released into the air were 770,000 tera Bq until beginning of Apr.11,2011, and still going on with high risk. It is said that this amount is about 20% of the Chernobyl accident. On April 12th, 2011, Nuclear and Industrial Safety Agency raised the rate of the accident from level 5 to the level 7, the same level as Chernobyl.

The Map below shows the spread of the nuclear waste according to wind patterns and ocean currents.

The real question is: how can we make this growing energy source safer? There are clearly very dangerous repercussions if this energy is not managed correctly and many people are in favor of outlawing it entirely. There are many risk factors associated with nuclear energy use such as waste disposal and proper protection from radiation.

According to the International Atomic Energy Agency (IAEA), a nuclear security plan can be achieved through “prevention, detection of and response to malicious acts, and Information coordination and analysis.” There are very imporant aspects to consider when choosing nuclear energy. The first is the potential hazard to the local community and choosing appropriate geological locations to construct the power plants. Another is a strong regulatory infrastructure to promote harmonized safety standard. To increase the safety for not only those who work on the site but also live nearby a power plant must be responsible for the disposal of their nuclear waste – either to be buried in deep saline formations or be recycled back into the reactor as currently done by France and Japan


Resources:

http://www.world-nuclear.org/information-library/safety-and-security/safety-of-plants/fukushima-accident.aspx

http://fukushimaontheglobe.com/the-earthquake-and-the-nuclear-accident/whats-happened

http://www.nrc.gov/reading-rm/doc-collections/fact-sheets/chernobyl-bg.html


Geothermal Energy: Going Green

Due to the island’s unique location and nature of formation, Iceland is the perfect country to lead the world in widespread geothermal energy use. The island is situated perfectly between the North American and Eurasian plates at a crack in the earth’s crust, and contains the two most important aspects of geothermal energy: enormous and continually renewed underground reservoirs, and shallow plumes of magma that heat the deepest sections of these reservoirs to upwards of 750 degrees Fahrenheit. On top of it all, the spreading of the seafloor below has become visible on land making Iceland one of the most geologically active countries on the planet.

Historically, Iceland has tapped into this geothermal energy as early as 1930 by straight piping hot water from the nearby springs into schools for heat. However, it wasn’t until the first oil shock of the 1970’s that truly made the country set out to make better use of this renewable and abundant energy source. By financing thermal and electric power plants throughout the country, as well as the infrastructure required to deliver hot water to homes, the Icelandic government not only eliminated the country’s dependence on fossil fuels for heating and electricity, but also jump-started an entire industry.

Geothermal energy works by tapping into water stored deep in the earth and using the steam generated from the heat of the earth’s core to power a steam turbine/generator which in turn generates electricity. The water is then pumped back down into the earth and reheated then reused.

Today, 99 percent of Iceland’s electricity is produced from renewable sources, 30 percent of which is geothermal (the rest is from hydroelectric), according to Iceland’s National Energy Authority. When transportation, heating and production of electricity are considered as a whole, geothermal provides half of all the primary energy used in Iceland. The capital, Reykjavik is home to the largest district heating system in the world, and it has been estimated that were Icelanders still dependent on oil, their heating costs would be five times as high. Across all of Iceland, 90 percent of households are connected to a district heating system, with just a few remote households getting their heat from fossil fuels such as propane.


Iceland is now the leading exporter of geothermal expertise to the rest of the world. Iceland’s third-largest bank, Glitnir, helped finance the world’s biggest geothermal district heating project in the city of Xianyang, China, and currently retains a staff of geologists to evaluate the potential of early stage drilling projects.


References:

http://iceland-times.com/section.php?id=167&id_art=184v

http://www.scientificamerican.com/article/iceland-geothermal-power/

http://www.nea.is/geothermal/


Thermoelectric Devices

Thermoelectric devices are in our everyday lives although many of us are not aware of their existence or how they actually function. All thermoelectric devices are powered through what is known as the thermoelectric effect.

This refers to the reaction caused when a difference in temperature creates an electric potential or vice versa. This specifically may be known as the Seebeck effect, the Peltier effect, or the Thomson effect, although each three laws have different specifics. For many materials, this effect is not productive or useful, but in certain materials that have a strong thermoelectric effect they can be used for things such as power generation and refrigeration.

Thermoelectrics generate the electricity from the movement of electrons within a metal.  Metals are good conductors because electrons can move freely within them, similar to a fluid in a pipe. Heating one end of a thermoelectric material causes the electrons to move away from the hot end toward the cold end.  When the electrons shift from one end to the other they cause an electrical current.

Below shows one generator prototype that uses thermoelectric energy


Although when many people think of thermoelectric devices the word heat comes to mind, thermoelectrics are also key in refrigeration and cooling devices. The Peltier effect was named after the man who discovered that when the electrons of a material are flowing from end to end, heat is absorbed at one end of the junction and released at the other.  This process forms the basis for thermoelectric cooling and temperature control, these are currently the widest applications of thermoelectric devices.  The device has two sides, and when DC electricity flows through the device, it brings heat from one side to the other, so that one side gets cooler while the other gets hotter. The “hot” side is attached to a heat sink so that it remains at ambient temperature, while the cool side goes below room temperature. In some applications, multiple coolers can be cascaded together for lower temperature.


Resources:

http://2.bp.blogspot.com/-oPUED7WQQao/UCaQ7BzkFlI/AAAAAAAAEF8/zL2YYsmYxkA/s1600/scheme_about_technology1b.jpg

https://powerpractical.com/pages/how-do-thermoelectrics-work


http://thermoelectrics.matsci.northwestern.edu/thermoelectrics/index.html

Solar Energy Lab

The most recent lab we conducted revolved around solar energy and voltage produced. The higher the light intensity (energy of the light) the more photons generated and therefore greater voltage. This is why we only put solar panels in places of the world where the light intensity is greatest (ex. the desert).

We conduced the experiment using a flashlight as our “light” and a small solar panel that measured voltage produced hooked up to the lego NXT. When light was shined onto the solar panel the computer recorded the voltage produced.

If done correctly, the voltage should have been greatest when the distance was at 0 because the intensity of the flashlight was greatest. Theoretically, the further away the flashlight the lower the intensity and therefore the lower the voltage. My group however was not able to obtain both sufficient data nor accurate data when using what we did obtain (link below). My group was only able to collect 8 data points at a time (the lego mindstorm program should have run for 30 sec consecutively) and the data points resemble more of a scatter plot.

Solar Lab Data

We also worked using various UV filters that should have affected the light intensity and consequently the voltage as well.

When reviewing this data it is important to understand the connection between the colors of the spectrum and energy.


Out of all the colors of visible light that we are able to see, each color has a certain frequency or wavelength and therefore a different energy. Violet and blue are the shortest wavelengths and therefore produce the most energy. The less frequency wavelengths such as red or orange produce a lower level of energy. White light is the combination of all colors of the spectrum while black is the absence of all color.

When placing UV filters over the flashlight (our experiment used blue, green, orange and white) it will accordingly affect the solar panel depending on which color is reflected while the rest are absorbed.

For our experiment, blue and green produced the higher voltage while orange came in third and white last.

Solar Energy Around the World

In recent years, the implementation and use of solar energy has skyrocketed. In 2011 alone, solar energy use rose 54% and in 2015 solar use was 100 times greater the energy produced in 2000.

As in the case of many markets, China has become the worlds leading PV panel producer. Over half of all solar panels produced come from key companies in China such as Suntech. The company has been able to produce the panels at record-low prices ($1.28/Watt) and now the question of world wide installation isn’t the cost of the technology itself but the often costly price of initial installation. Some of these solar grids are as large as the cities they need to power and it takes both time and money to install every panel.

The top leader in solar energy use however is Germany. The country produces around 30% of the world’s solar powered energy which amounts to almost more than the rest of Europe combined. Although this sounds like great amount (32.4 GW) this only equals about 3% of Germany’s power consumption. The country hopes to eliminate the majority of nuclear power use and harness nearly 25% of all their energy using solar power by 2050.


China is not just the world’s leading producer for solar panels but also the world’s second leading solar energy producer. As the world’s most populous country with one of the largest carbon footprints it makes sense that the country has began to invest in alternatives for their massive energy needs. Sine 2009 China’s solar production has grown a tremendous 9,000%. With the intention of drastically reducing the amount of coal burned China aims to producing 70 GW of solar energy by 2017.


The rest of the leading producers are Italy, Japan, the US and Spain.

Although not yet a leading producer of solar energy, Morocco is currently in the process of building the largest solar plant in the world. Located on the edge of the Sahara desert this power plant is nearly the size of the city it is providing power to. The plant is outside the city of Ouarzazate, and will provide electricity to 1.1  million people 20 hours a day by using the Sun’s heat to melt salt, which will hold its heat to power a steam turbine after the sun has set. By 2020 Morocco aims to produce 42% of its electricity from renewable energy.

Below are some of the more specific details of the solar giant.


Resources:

http://pureenergies.com/us/blog/top-10-countries-using-solar-power/

http://www.thinkglobalgreen.org/solar.html

http://www.bbc.com/news/science-environment-34883224


Generator Experiment

There are billions of people on this earth whose lives are entirely dependent on electricity and energy use. However, as many of our sources of coal and natural gas are becoming exponentially smaller we must examine how we generate our electricity more closely now than ever.

When a person thinks of calories they most likely think of food, but a calories is actually in fact a unit of energy. As you burn calories you are in fact burning stored energy in your body.

The experiment is centered around our body’s ability to produce energy using Faraday’s law. According to the law, changing magnetic fluxes through coiled wire generates electricity just a generator would. The greater the change in the magnetic flux the greater the voltage generated.

In a generator there is some sort of engine that powers a coil which rotates to interrupt the magnetic fields in order to create a current. (As seen below) However during our experiment we shook a tube that has a magnet within which travels back and forth through a coil of wires. The faster the tube is shaken or the higher energy that is used the higher the voltage.

When recording data our task was to correlate the number of shakes of the generator, in a thirty second time interval, with the voltages that the generator generates.

However, when conducting our actual experiment we ran into numerous amounts of problems. We switched out multiple batteries only to find that the program still couldn’t connect to the computer. Even when the computer said it was connected to the lego mindstorm device we were still unable to generate data.

Had it gone correctly we hope that the data would have correlated higher according to how hard the tube was shaken.