Iceland: Geothermal Energy

25% of Iceland’s electricity come’s directly from Geothermal power. After doing some research, I found it startling to see that a country has utilized this capacity so well, and was capable of transforming it into a national cause and developing 1/4th of it’s electrical production on geothermal power.

What is Geothermal Power?—It is thermal energy created and stored within the Earth’s Crust. To put it simply: It is power created from the Earth. http://www.nea.is/geothermal/

Discovering why Iceland is such a leader in Geothermal energy did not take me much time, because after viewing it’s geological location it’s no wonder that 25% of it’s electricity comes from this kind of energy. Iceland is comprised of many volcanos, and the nation’s minds fully take advantage of the Earth’s hot surface to generate power. Also worth noting is the fact that geothermal heating in Iceland is able to almost cover the heat/hot water of the entire country’s population. Iceland lies upon the Mid-Atlantic Ridge(2nd Largest Fault), which is the reason for all of the volcanos in the country, and is one of the only places in the world where you can see plates shifting above sea level. The country is home to over 200 volcanos—-30 of which have blown since the country was settled. This means Iceland is tumultuous country because earthquakes and volcanos can occur at any moment. More pressing, the country contains over 600 hot springs, which are being used for geothermal power. http://www.nea.is/geothermal/the-resource/

geothermal-fields


Below is a High Temperature Field from Iceland on the Left, and a Low Temperature Field on the Right. The difference is that High Temperature fields are extremely hard to access due to rough temperatures(upwards of 386 Celsius).

seltun2laugarnes


After discovering geothermal energy, Iceland has become a prominent player on the world stage. 84% of it’s energy use comes from local sources—64% of which being Geothermal. Post-WW2 the country went into a full on frenzy developing new technologies. Today 9/10 households are powered by geothermal energy. Many by space heating, which is the largest component of geothermal use in Iceland. 7-utilisation_of_geothermal


Lastly, Iceland is beginning to undergo a massive project that will take about 5 years to complete. (Iceland Deep Drilling Project.). This project is being undertaken to determine is using geothermal fluids would improve the power productions from geothermal fields. Drilling will reach about 5km, and a temperature of 450-600 Celsius. http://www.nea.is/geothermal/the-iceland-deep-drilling-project/

Solar Energy Lab

This past week in class, we did an experiment focusing on the effect light has from varying distances, and the changes that occur to it’s power when you add in a second variable—-color. With the assistance of every student’s best friend(LabView), we were able to get firm data and see the difference of power when one draws the light further away from the source.

Below are the Labview Tools for this experiment(Including the computer cables, and color shades to be placed over the source).

IMG_0519IMG_8652

Starting with no color and 2cm of distance, our results were difficult to perceive. But, after adding more trials(8cm, 16cm, 21cm, 32cm), we could clearly notice that the effect of light was waning on the power source the more one pulls the light source away. The experiment took an exciting turn when we threw in the different colors but kept the same distance of 2cm. It was incredible to see a contrast in data with just a thin film of color being placed over the power source.

Here’s our Averages for each trial that we conducted in this experiment.

photo-10

Check out our results in this massive picture below: You can see all of the trials, averages, and graphs of the averages found. We also plotted the points in 2 separate graphs.(1 for the No-Color results, and 1 for the results gathered by adding a film cover, which we used a Bar-Graph).

photo-8

Stirling Heat Engine and The Peltier Device


Looking into the Stirling Heat Engine, one can stir up hundreds of articles, but exploring the Peltier Device is a different problem. Reliable information on the internet is far and in-between, and it took me quite some time finding essential sources for this article.


The Stirling Heat Engine was invented by Robert  Stirling in 1816, and can be currently only be found in a few places, including submarines or yachts where quietness is an absolute necessity. To explain further, the Stirling Engine is unlike cycles in the internal-combustion cycles. The main difference is that there is no exhaust for this engine because the gasses never leave the Stirling engine. As a result the engine is remarkably quiet. Furthermore, the Stirling engine uses a variety of external heat sources and no combustion occurs within the engine(The engine can actually use solar energy as a power source). http://auto.howstuffworks.com/stirling-engine1.htm

Looking into the actual cycle itself, one principle lies at the forefront: a fixed amount of gas is sealed in the engine. To put the system in a simpler mindset, one piston moves down while the other moves up due to gas pressure within the engine, when this happens the engine starts to turn due to the pistons moving. To increase pressure, you increase the temperature, and to decrease pressure one decreases the gas temperature. The key to this engine, is the controlled heating/cooling of the gas sealed inside the engine.

  • “If you have a fixed amount of gas in a fixed volume of space and you raise the temperature of that gas, the pressure will increase.
  • If you have a fixed amount of gas and you compress it (decrease the volume of its space), the temperature of that gas will increase.” http://auto.howstuffworks.com/stirling-engine.htm Check out the diagram of one of the Stirling Engines being used in Submarines today.

AIP stirling_swede

Stirling Engines are not found in common places like the vehicle marketplace, and that’s because at this point due to the fact that the heat source is always external it always takes longer to heat something before it can generate power or change it’s power output. It’s unbelievable that these engines are not more common in our society because they were scripted before gas and diesel engines.

Below is a simple diagram of a Stirling Heat Engine:

Image4


The Peltier Effect was first seen in the 19th Century and ‘occurs whenever electrical current flows through two dissimilar conductors. Depending on the direction of current flow, the junction of the two conductors will either absorb or release heat.’ The Peltier Device can be seen in articles frequently as “Thermoelectric Module”. These applications can be seen more and more in our society nowadays, in areas like food service equipment. These devices perform well on small, isolated situations where they’re needed the most, and clearly outweigh any advantage a compressed gas system would hold over it in that regard. http://www.tellurex.com/technology/peltier-faq.phppeltier


This A/C unit uses the Peltier technology.

tg_3050

Hand Crank Generators

Having missed the chance to get my hand on the hand-crank generators due to having to leave class early, I instead explored the usage of Hand-Crank generators. We take electricity and power for granted because it’s all around us. We can charge our phones through an outlet in the wall, through a USB in our computers, and even in our cars. Yet, what would we do if all of a sudden we could not have the luxury of charging our electronics. A Hand Crank Generator is the perfect solution for those who love the outdoors or who want to prepare for the unpredictable things that mother nature throws at us(hurricanes, blizzards, etc). We want to be able to stay connected in today’s society because news is so constant through our phones. A hand-powered generator is the best solution to charging your phone or battery in the event of losing power.

Looking into how hand-generators actually work, it seems simple enough. Instead of coal or another energy source, the initial energy is provided by our arms. In 1831, Faraday discovered that by spinning a coil of wire around a magnet, one can create a current. This is usually done quickly with steam or gasoline, but if you shrink the equation down to pocket size, your arm becomes the motor is making the current. Simply put: You crank it to spin the coil of wire around a magnet to create the current. The longer or faster you crank it the more energy you can produce. Being in the military myself, I found it interesting to see that hand-crank technologies were first used on the battlefield in the 1960s to charge batteries. Thinking on a much larger scale, wind turbines use the same technology.

I believe that hand-crank generators are an absolute necessity because you never know what can happen in life, and relying solely upon one energy source for power is foolish. When power goes out, we create fire and light candles but lose our phones once their batteries die. This gives a chance for vital communication to still exist with charging your batteries through a hand-crank generator.

Sources: http://electronics.howstuffworks.com/gadgets/travel/hand-powered-generators.htm

http://electronics.howstuffworks.com/gadgets/travel/hand-powered-generators1.htm

http://electronics.howstuffworks.com/gadgets/travel/hand-powered-generators2.htm

wind-up-cell-phone-charger-1– Hand-crank Cell phone Charger

05-Charging an IPhone using hand crank technology.


-Connor


Solar Energy Around the World

I explored Solar Energy efforts being made in 3 different countries: China, Rwanda(With the aid from Israel), and the United States. 3 unique countries, that are located in completely different continents have made significant strides in the area of Solar Energy.


China: The 2nd largest maker of photovalic panels in the massive country has agreed to build an enormous, 1,000 Megawatt solar power plant complex in the Xinjiang Province, which is home to a “harsh, drastic, cold desert” known as the region of Turpan Perfecture . The project is on-going and would take up to four years to complete if approved by Chinese regulatory commissions. I found it interesting that this solar facility is being made in the far western province of China, which is the opposite direction of Beijing and Shanghai, which greatly contributes to pollution due to their 2,300+ coal-fired power plants. I believe this does not make sense because the solar power is not being utilized to it’s fullest potential in the area of the country that needs the most assistance alleviating emissions. On the other hand, construction of this magnitude helps to drive local economies and will contribute many jobs, and hopefully future solar projects in the future. http://thinkprogress.org/climate/2014/01/02/3110821/china-desert-solar/#SolarGraphic-638x517

Rwanda: One could easily evaluate efforts made by Israel instead of Rwanda, but I wanted to explore a struggling country trying to still develop innovative energy projects. With the assistance of the Israeli government and the motivated people of Rwanda, a solution to energy might be found soon. “The East African country currently has a power capacity of just more than 100 megawatts for more than 11 million people — many of whom have no access to electricity. Israel, on the other hand, has about 13,000 megawatts of power available for its 8 million residents”. This struck me profoundly because it means that there is little to no power going around Rwanda, and to those living in poverty, they simply do without it. Isreali energy companies are pouring in $20.3 million to build an 8.5 mega-watt photovoltaic power plan, while advising people in Rwanda of future projects to help develop power in the country. Almost 600 million in Rwanda do not have basic electricity, and the country relies solely upon burning diesel fuel, which contributes to damaging the atmosphere. This project is unique because it provides business for a global power in Israel, relief for a 3rd world country of Rwanda, and a breakthrough in improving world emissions. In the future I hope to see more global powers helping struggling countries develop energy sources. http://www.timesofisrael.com/israeli-group-kicks-off-23m-energy-project-in-rwanda/

Hand-shake-President-Paul-Kagame-Yosef-Abramowitz-305x172– President of Rwanda, and CEO of Energyia Global: Yosef Abramowitz


United States: The U.S meanwhile is seeing a problem arising as it moves to solar energy projects. With two projects set to begin in California, and Nevada, some are outraged that the facilities will push desert tortoises into extinction. Both plants will provide over 700 jobs, and create enough renewable solar energy to power 170,000 homes. So the questions lies within what is more important: The future of desert tortoises, or the future of us? The government meanwhile found a solution by extending the tortoise habitat by 20,000 more acres. It’ll be extremely interesting to see how this battle plays out in the future, because the U.S will likely move to an aggressive approach with renewable energy, and the environment issue will rage on. http://www.businessweek.com/ap/2014-02-20/2-solar-projects-approved-in-california-nevada

1148848_ME_SolarFuture


-Connor


Lego Mindstorm Experiment(07FEB14)

In this lab on February 7th, 2014, we explored: Newton’s 2nd Law, The law of conservation of energy, Velocity & Acceleration, and Power, through the usage of the Lego Mindstorm motor. Despite a significant issue with the problem not functioning correctly, my partner and I were still able to develop some solid results of our findings. We were tasked with several things. The first of which was to see if the Acceleration(Force/Mass) would change if the Power remained the same, but the mass became altered for the weight being supplied to the pulley. We set the initial power on the program at 75 Newtons for 3 trials, and increased the mass from 0.o2kg, to 0.04kg, and finally 0.06 kg respectively. Then we were assigned to find the Potential Energy, by measuring the height of the pulley(M*G*H), which was 30cm. Our results for the first set of trials were as follows.

EXPERIMENT A

  • Trial 1:  Power: 75 Newtons     Mass: 0.02kg       Acceleration: 3750        Potential Energy: 0.059
  • Trial 2: Power: 75 Newtons     Mass: 0.04kg       Acceleration: 1875         Potential Energy: 0.118
  • Trial 3: Power: 75 Newtons     Mass: 0.06kg       Acceleration: 1250         Potential Energy: 0.176

From looking at the results of the first set of trials, one can see a direct correlation. With a greater mass, the acceleration goes down. In trial 1: 75 Power, 0.02kg equated to an acceleration of 3750, and when mass was added but the power stayed the same, the acceleration significantly decreased. Our second set of trials provided a different set of results after altering the power and keeping the mass the same for each trial.

EXPERIMENT B

  • Trial 1: Power: 50 Newtons    Mass: 0.06kg        Acceleration: 833.33     Potential Energy: 0.176
  • Trial 2: Power: 75 Newtons    Mass: 0.06kg        Acceleration: 1250         Potential Energy: 0.176
  • Trial 3: Power: 100 Newtons  Mass: 0.06kg       Acceleration: 1666.7      Potential Energy: 0.176

Our second set of trials yielded much different results after altering the force provided through the program, and keeping the mass on the pulley set at 0.06kg. In this experiment, one can see a sharp rise in acceleration with an increase of force. This is a direct contradiction to the first set of trials, which proves that more force provided would result in more acceleration, and with the same force provided on a heavier mass the acceleration would decrease. Unfortunately due to time restraints, and the program not functioning properly, my partner and I did not get to finish the lab entirely, but with the data we have discovered, we feel confident in our experiment and results.


Graphs-The image on the left is of Experiment A, which shows a decrease in Acceleration due to an increase of mass. The image in the middle is of Experiment B, which shows a steady mass of 0.06kg, and a sharp increase of acceleration. Finally, the images on the right are of the Potential Energy for both experiments. Experiment A is on top which shows a steady rise, while experiment B contained no change in data.

photo-8-This image represents our plotted points(0.02kg, 3750Acceleration. 0.04kg, 1875Acceleration, and 0.06kg, 1250Acceleration).

Pulley

Generating Electricity: 3 Unique Methods

Hello All,

When it come’s to generating electricity, I’d like to turn my focus to coal, natural gas, and nuclear power plants as methods to generating electricity. From our reading in chapter ten of Beyond Smoke and Mirrors by Burton Richter, we acknowledged that 70% of the United States energy production comes directly from coal and natural gas. To provide an overview for my blog, coal has become the supreme leader of energy production not only in the United States, but across the world due to it’s relatively cheap cost, and abudance. Coal has far reaching problems for the environment due to it’s rash of emissions, and Richter highly encourages a change from coal-fired plants to natural gas plants to greatly reduce our overall emissions(We could reduce our emissions to as as much as 25%). As we have seen again, it boils down to cost and coal is much cheaper than gas to produce electricity.


To begin, coal remains an extremely viable and important asset to energy production due to the rising and unstable prices of natural gas. One can always rely on affordable coal that is available for energy production. “Coal and its stable price is a long-term proven hedge against natural gas volatility and coal is critical if we are to continue to provide affordable electricity for our members.”- John Novak. I found John Novak, NRECA executive director of environmental issues, to be brutally honest in the fact that coal helps to keep energy prices down. Not only as a subsidiary to gas in case there is ever a shortage, but also a method of keeping the price of gas down in order to force competition. Coal is the fastest growing energy source in the world, rising 2.3 percent a year through 2018, and poised to dethrone crude oil as the largest source by 2020-IEA. Due to a rough winter in the Northeast, the United States is relying heavily upon coal production to produce electricity now more than ever. This phenomenon can be seen financially in the fact that the price of coal has greatly increased in recent months due to increased demand for production.

Coal-schematic-3D coal-plant-shutdown-240x160
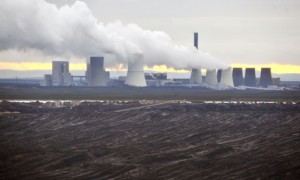
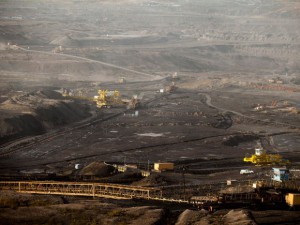
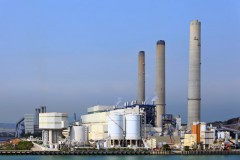
2 images which show coal production.


Next, in regards to natural gas generating electricity, is a nonrenewable resource like coal that can be transformed into usable power. According to the EPA, “Power plants use several methods to convert gas to electricity. One method is to burn the gas in a boiler to produce steam, which is then used by a steam turbine to generate electricity. A more common approach is to burn the gas in a combustion turbine to generate electricity”. A newer technology called, a “combined cycle” is being seen more frequently, which involves burning the natural gas in a combustion turbine to in turn develop steam to drive a steam turbine, which results in a much greater efficiency. “Compared to the average air emissions from coal-fired generation, natural gas produces half as much carbon dioxide, less than a third as much nitrogen oxides, and one percent as much sulfur oxides at the power plant. In addition, the process of extraction, treatment, and transport of the natural gas to the power plant generates additional emissions”. This struck me profoundly because I always believed that natural gas production had to be the single-leading cause for our severe industrial emissions. This form of energy production affects the natural environment in a much less harmful way than coal-production does, yet still it harms several habitats of animals that live in the vicinity of the plants.

Gas-schematic-3D
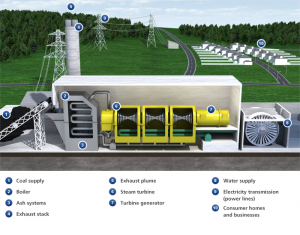
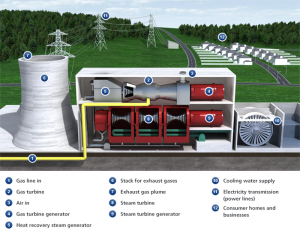
– Natural Gas being turned into Electricity.


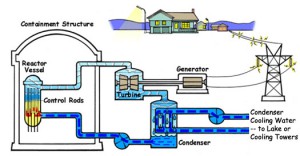
Lastly, in terms of energy production from nuclear power plants, the process is much similar to that of natural gas and coal. Water is still being turned into steam, which in turn causes the turbines to generate electricity. The significant difference lies in the point of having the heat that generates the steam being created when uranium is split, which is called fission. The United States contains 100 nuclear power plants which account for about 20% of all the country’s electricity, without leaving a single trace of emission or pollutants into the atmosphere.I learned that there are two different kinds of nuclear power plants: Pressurized Water Reactors, and Boiling Water Reactors. In both cases, the water can be seen as a renewable energy, because it is recycled through for future usage. About 2/3 of America’s power plants are pressurized water reactors, with the remaining third being boiling water reactors.

Pressurized Water Reactors keep water under a constant pressure, never bringing it to a boil. The water is then circulated through the turbines to cause them to turn into steam which in turn operates the turbine generator which creates electricity.

PWR-schematic-1– Pressurized Water Reactor, also known as PWR.

On the other hand, Boiling Water Reactors, the water literally boils and transforms into steam to power the turbine generator to create electricity.

BWR-schematic-Boiling Water Reactor, also known as BWR.


REFERENCES:

http://www.ect.coop/power-supply/coal-keeps-electricity-cheap/65837

http://www.bloomberg.com/news/2014-02-13/coal-burns-brighter-as-utilities-switch-from-natural-gas.html

http://www.epa.gov/cleanenergy/energy-and-you/affect/natural-gas.html

http://www.duke-energy.com/about-energy/generating-electricity/nuclear-how.asp

http://www.nei.org/Knowledge-Center/How-Nuclear-Reactors-Work

Germany’s Green Energy Policy

“Germany produced more energy by coal last year than it has in nearly a quarter century”. This fact alone roped me into this week’s discussion. How can a country produce that much energy in the course of year? The answer can be found within the false promises of the German government. After pledging to phase out it’s nuclear programs after the Fukushima disaster, the country has instead pushed it’s time and efforts into mining more coal instead of invest in the future of Germany, and the world, with clean and efficient forms of energy. Germany has now become a shadow of it’s promises, and in turn it’s emissions output has significantly rose due to increased levels of burning coal. http://www.the-american-interest.com/blog/2014/01/09/end-result-of-germanys-green-energy-policy-more-coal/Damian in Germany : Coal Power station  : Boxberg lignite-fired power station


Despite efforts to move away from older methods of producing energy, Germany is actually under investigation by European Union investigators due to the fact they are giving huge tax exemption to major companies that are signifigant energy users. All the while energy prices are skyrocketing because Germany cannot pace itself with the amount of money it is shuffling into trying to close their nuclear and coal operations. http://hotair.com/archives/2013/12/19/germany-under-investigation-for-their-green-energy-policies/

coalprotest-Protesting to end the mining of coal in Germany.

On the surface however, Germany appears to be running it’s course of getting away from nuclear power. That is until one delves deeper to see that it is avoiding backlash from severe power shortages by upping it’s energy output from coal production to pick up the slack. Germany’s plan seems extremely seedy and hard to understand, because they are telling the public that everything is going according to plan and that emissions are being slashed, but they are failing to tell the public that where one area of energy production falls(Nuclear0, another rises tremendously(Coal). Even more disturbing is that the country nearly doubled it’s production of new coal facilities in comparison to new wind/solar facilities. In all regards the country is taking one step forward in the public eye, but two huge steps back when the public does not look. http://www.dissentmagazine.org/article/green-energy-bust-in-germany


1371505709BoisvertEnergiewendecoalmining-Miners excavating Lignite(Brown Coal)


-Connor Mulcahy

Lego NXT Robot Round 2

Working through the second week of the Lego NXT experiment proved to be much more technical then the initial set-up. We were tasked with measuring the distance to which the car traveled, both with a ruler and through the program on the computer. Then we had to work through to find the percent error for 3 of the trials that we performed.


The data is as follows: Trial 1

  • 1 Second. 50 Power/50 Power = 0.128(Labview) and 0.16(Ruler)
  • 1 Second. 50 Power/50 Power = 0.142(Labview) and 0.165(Ruler)…Percent Error = 15%
  • 1 Second. 50 Power/50 Power = 0.175(Labview) and  0.143(Ruler)

Trial 2:

  • 1 Second. 75 Power/75 Power = 0.240(Labview) and 0.285(Ruler)
  • 1 Second. 75 Power/75 Power = 0.230(Labview) and 0.285( Ruler)
  • 1 Second. 75 Power/75 Power = 0.234(Labview) and 0.275( Ruler)……Percent Error = 16%

Trial 3:

  • 1  Second. 100 Power/100 Power = 0.340(Labview) and 0.370(Ruler)……Percent Error = 8%
  • 1 Second. 100 Power/100 Power = 0.330(Labview) and  0.370( Ruler)
  • 1 Second. 100 Power/100 Power = 0.330(Labview) and 0.365(Ruler)

As one can clearly see, our percent errors were quite off in 2/3 of the experimental test-runs. Trial #3 proved to be the most successful, with a percent error of 8%. I believe it is difficult to measure the distance traveled using a ruler, so those numbers may not have been as close as I wanted them to be. However, when comparing to the Labview numbers, many are relatively close to aligning with one another. Also, a hinderance I noted was that the car drifted to the left which hurt our data because we had to keep adjusting so that the car would stay on line and get a good measurement reading.


images– The formula for finding Percent Error.

fig_lego_mouse-3572-lg– Lego NXT Robot


-Connor Mulcahy