Category Archives: Uncategorized

Climate Change Initiates

global-warming


In 2009, President Obama pledged to bring the United States greenhouse gas emissions 17% below their 2005 levels by the year 2020.   In 2013, the Presidents Climate Action Plan, was developed and published as the actionable process to bring about a reduction of our countries harmful impact on green house gas emissions on our planet.

While the entire plan is extensive, and can be reviewed in it’s entirety at the citation footnoting this document, I will survey just a few of the initiatives I particularly liked.

Increasing Fuel Economy Standards

Today, almost 1/3 of the energy consumption in the US is spent in transporting people and freight from one location to another.  To help bring this number down, the Climate Action Plan (CAP) call for implementing fuel economy standards for heavy duty trucks, buses and vans ( a first as there currently are no limits ) produced after 2014.  Further, the plan would also shoot for an average performance equivalence of 54.5 miles per gallon for passenger vehicles by 2025.  By the Whitehouse’s estimate that will eliminate over 6 Gigatonnes of carbon pollution.

Phasing Out Subsidies

International Energy Agency estimates that the phase-out of fossil fuel subsidies – which amount to more than $500 billion annually – would lead to a 10 percent reduction in greenhouse gas emissions below business as usual by 2050. At the 2009 G-20 meeting in Pittsburgh, the United States successfully advocated for a commitment to phase out these subsidies, and we have since won similar commitments in other fora such as APEC. President Obama is calling for the elimination of U.S. fossil fuel tax subsidies in his Fiscal Year (FY) 2014 budget, and we will continue to collaborate with partners around the world toward this goal[1]

While this is a notable first step, it does not address all the relevant fuel subsides, for instance, corn farmers still receive subsidies to grow corn. Which is then used to produce ethanol.  While the cost of adding ethanol to gasoline, may be cost competitive with subsides, without it would be a bit harder to sell.  The cost to the environment just to grow and transport the corn, much less process it into ethanol, is down right prohibitive and that is why the corn subsidies should be discarded as well.

Enhancing Multilateral Engagement with Major Economies :

In 2009, President Obama launched the Major Economies Forum on Energy and Climate, a high-level forum that brings together 17 countries that account for approximately 75 percent of global greenhouse gas emissions, in order to support the international climate negotiations and spur cooperative action to combat climate change. The Forum has been successful on both fronts – having contributed significantly to progress in the broader negotiations while also launching the Clean Energy
Ministerial to catalyze the development and deployment of clean energy and efficiency solutions. We are proposing that the Forum build on these efforts by launching a major initiative this year focused on further accelerating efficiency gains in the buildings sector, which accounts for approximately one-third of global carbon pollutions from the energy sector.[1]

While piecemeal efforts to reduce the impact of climate change are important, the most prolific polluters are major powers with significant economic incentive to deliver cheap energy to their economies.  Only two real factors will promote significant reductions, economic incentives (it being cheaper to use clean energy ) that haven’t been realized, or multilateral treaties that obligate polluters to reduce their individual emissions and in that way act in the better interest of all.


With ever more savage, wildfires, storms ,and droughts, climate deniers have grown fewer in number as the preponderance of evidence for human sponsored climate change continues to grow.  That’s great news, but a more informed public is only a portion of the solution.  What the world needs now is actionable procedures to address the problem, as well as the collective will to implement them.  Hopefully, the President’s plan will be but a first in a series of legitimate attempts to meet a very real threat, with very concrete solutions.


Sources:

[1] http://www.whitehouse.gov/sites/default/files/image/president27sclimateactionplan.pdf

Museum of Science

Energy. It’s the driving force for much of what occurs on our planet, whether the war front in Iraq or the more genial conflict of how to lower heating bills at home, who has it and and how much we pay to get it, is a prime motivator.

At the Museum of Science, a multitude of exhibits are devoted to answering a small portion of the bigger questions, namely how Massachusetts residents get their renewable energy.


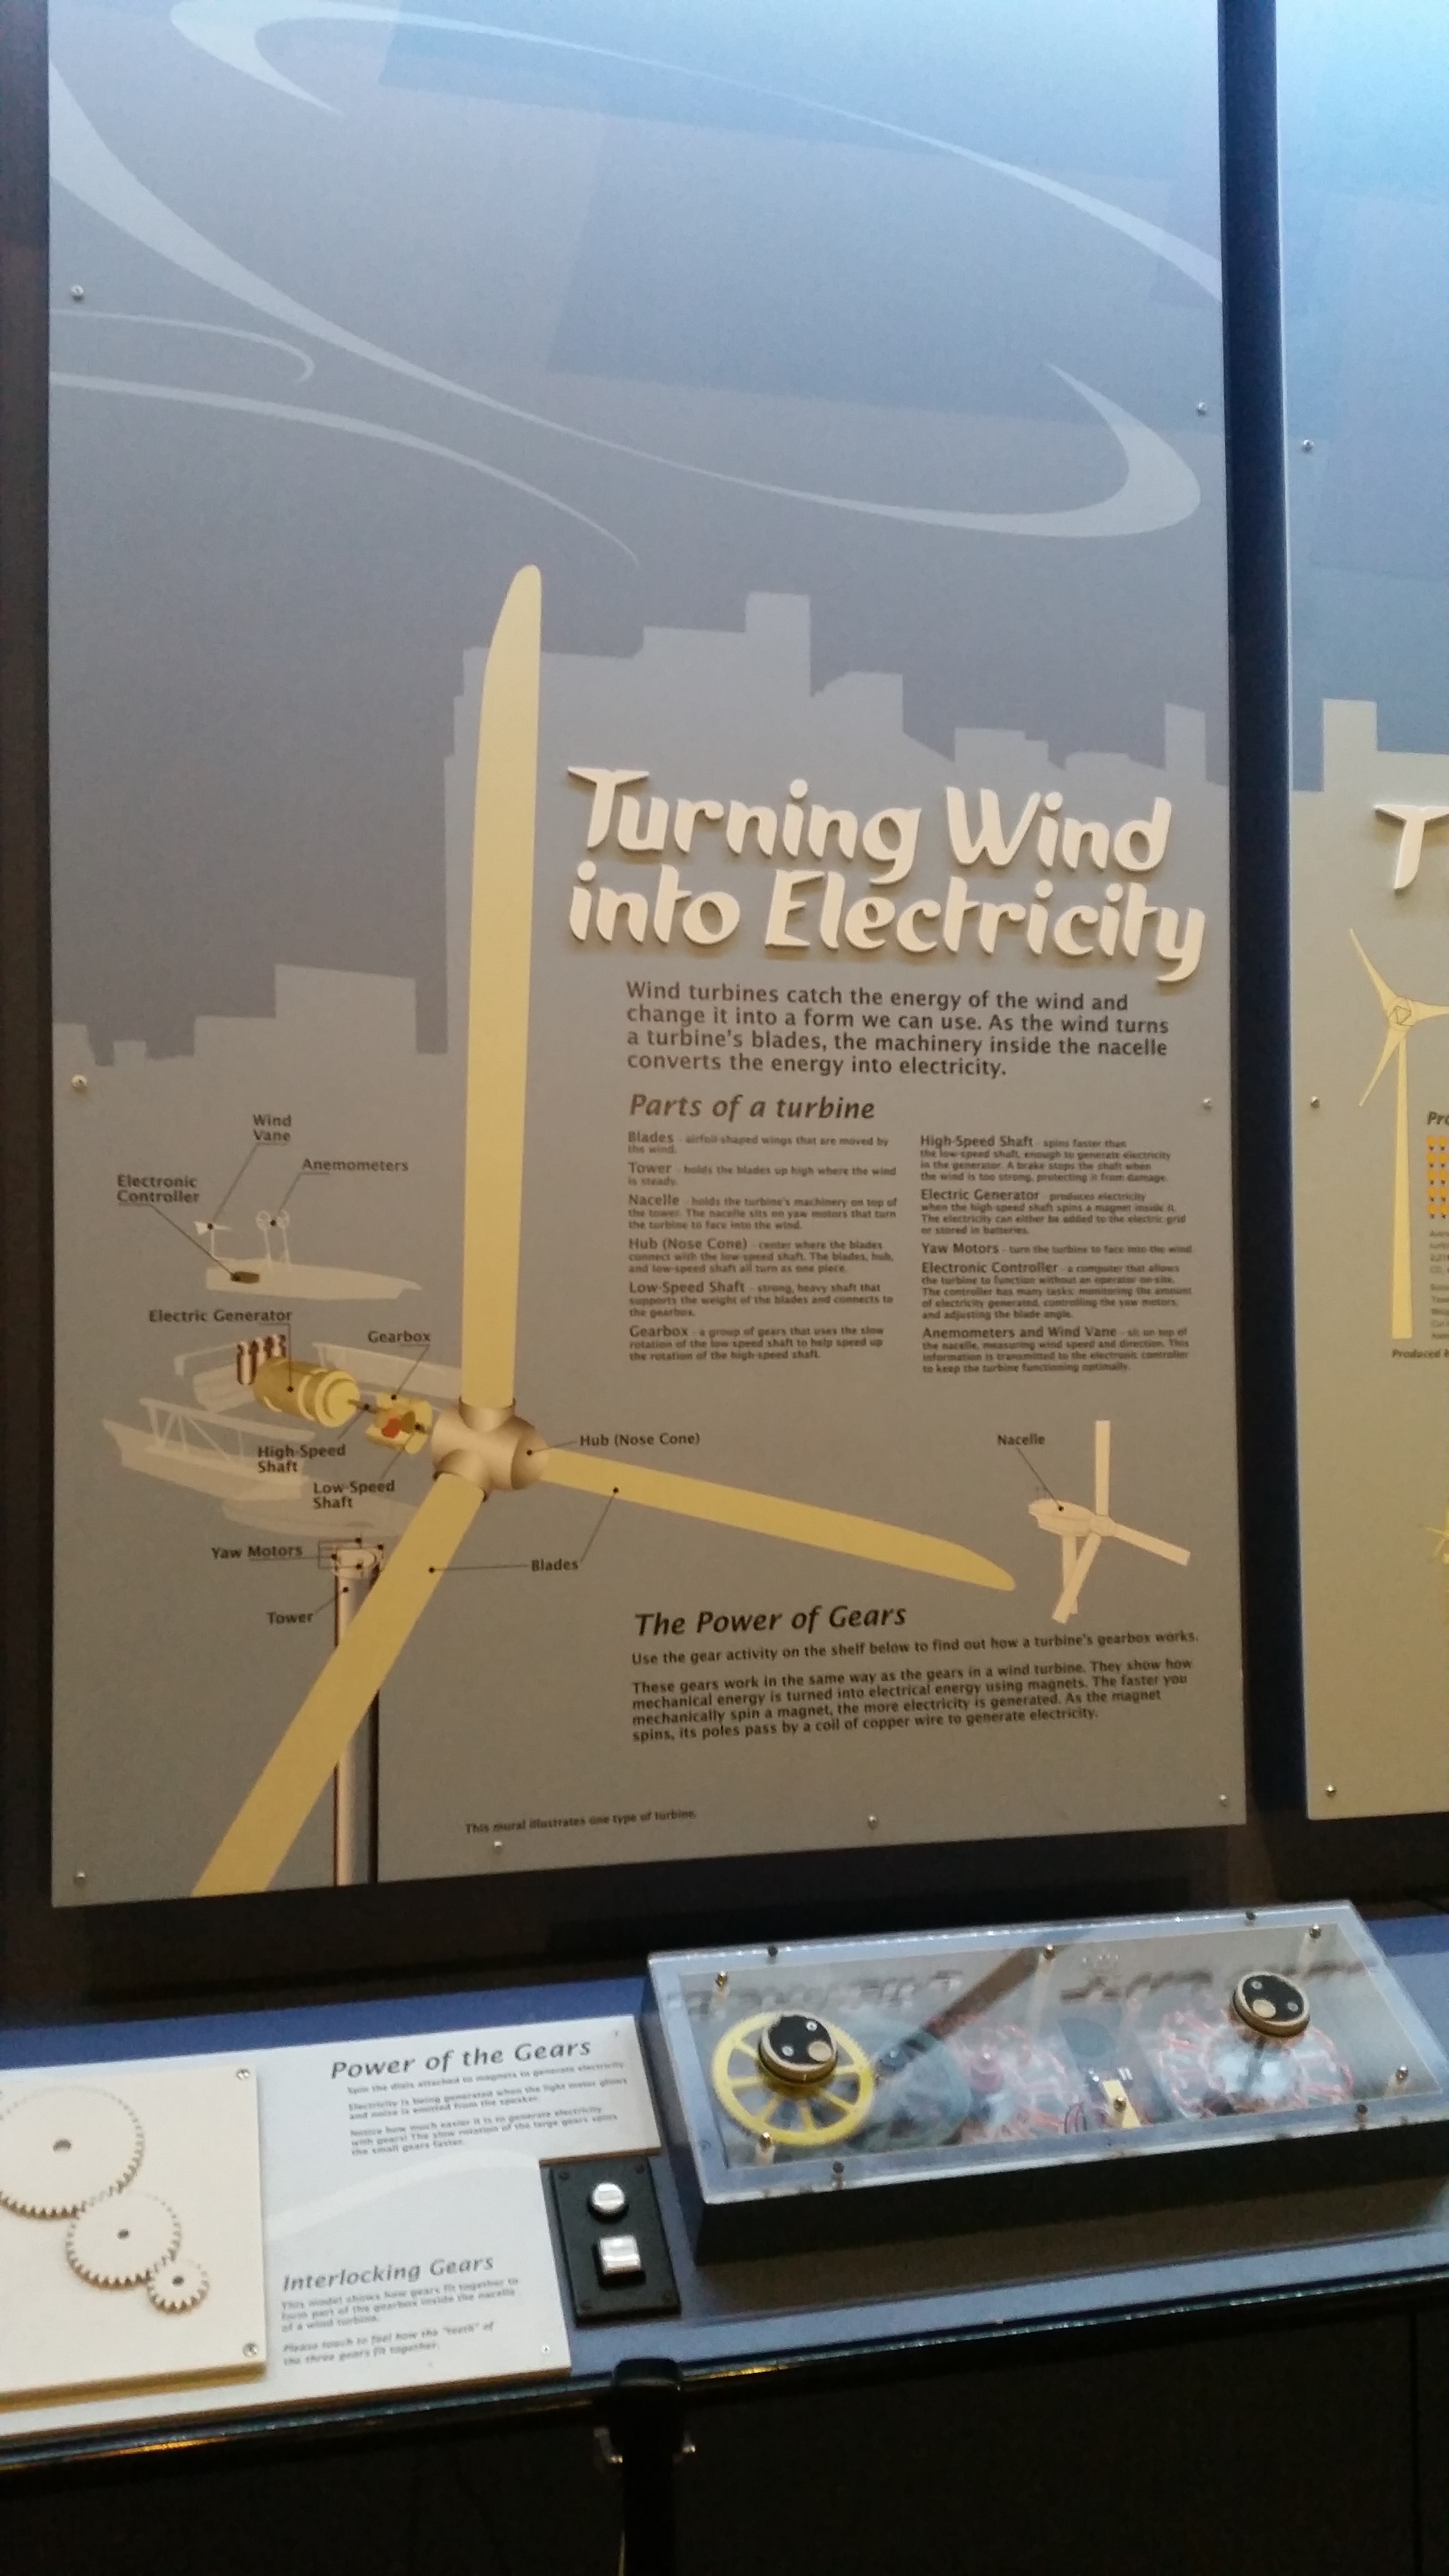
At the Catching the Wind Exhibit, I learned how wind energy is gradually helping Massachusetts become less reliant on fossil fuels.  Further, a brief explanation of how wind turbines produce electricity (basically, passing a magnet across tightly wound strands of copper does the trick), the exhibit allowed me to monitor the electrical output of the turbines mounted upon the roof of the building.  The exhibit further described various wind turbines and the power they produce.  A Proven 6 type can generate up to 5000 kW of electricity in wind speeds above 32 kph.  Given the windy conditions along Massachusetts coasts, this is  particularly promising additive for the state.

20141031_134209


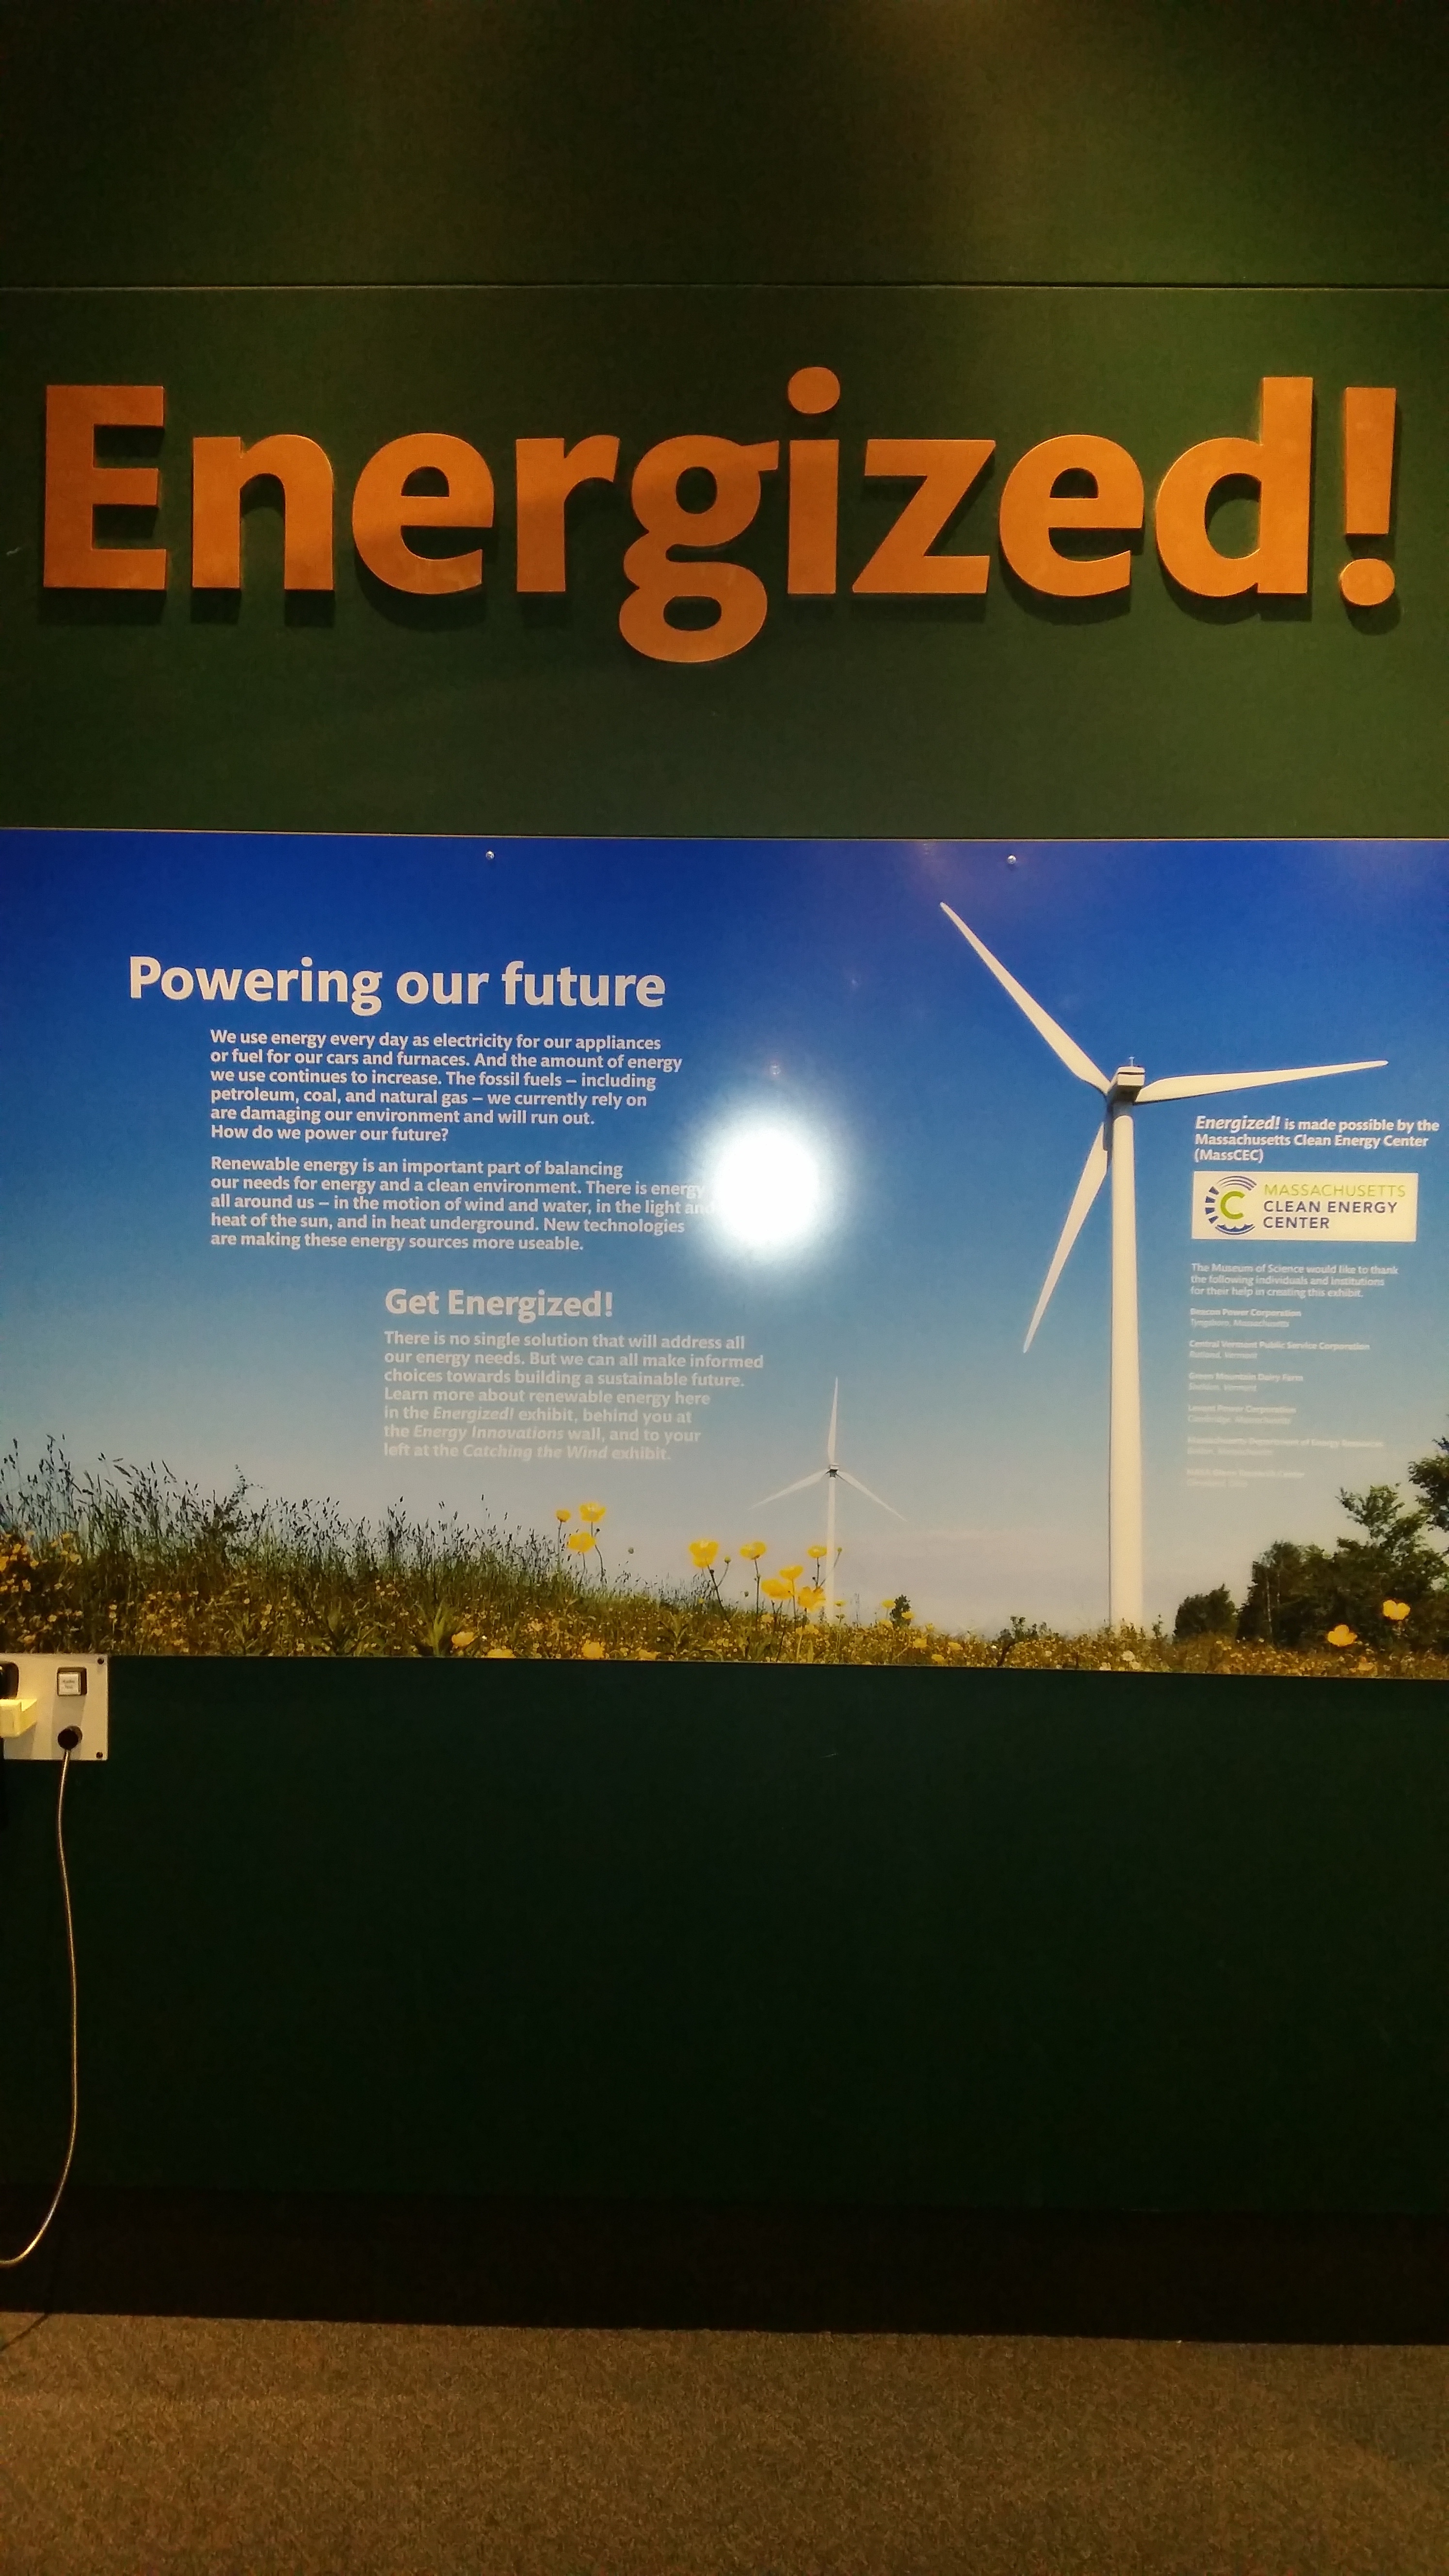
At the Energize exhibit, I found what I think was the most interesting aspect of the tour.  While many displays are devoted to clean energy, the one I lingered over the most was a touchscreen display mapping all of the renewable energy sites across Massachusetts, from 2003 onward.  I could watch the apparent exponential growth of solar, wind, and hydroelectric power sights across the state. While not to scale, the scope of solar power growth over less than a decade( in a state that isn’t particularly gifted in the sunlight department, no less! ), gives a ray of hope that a clean energy future is viable possibility.

20141031_133338

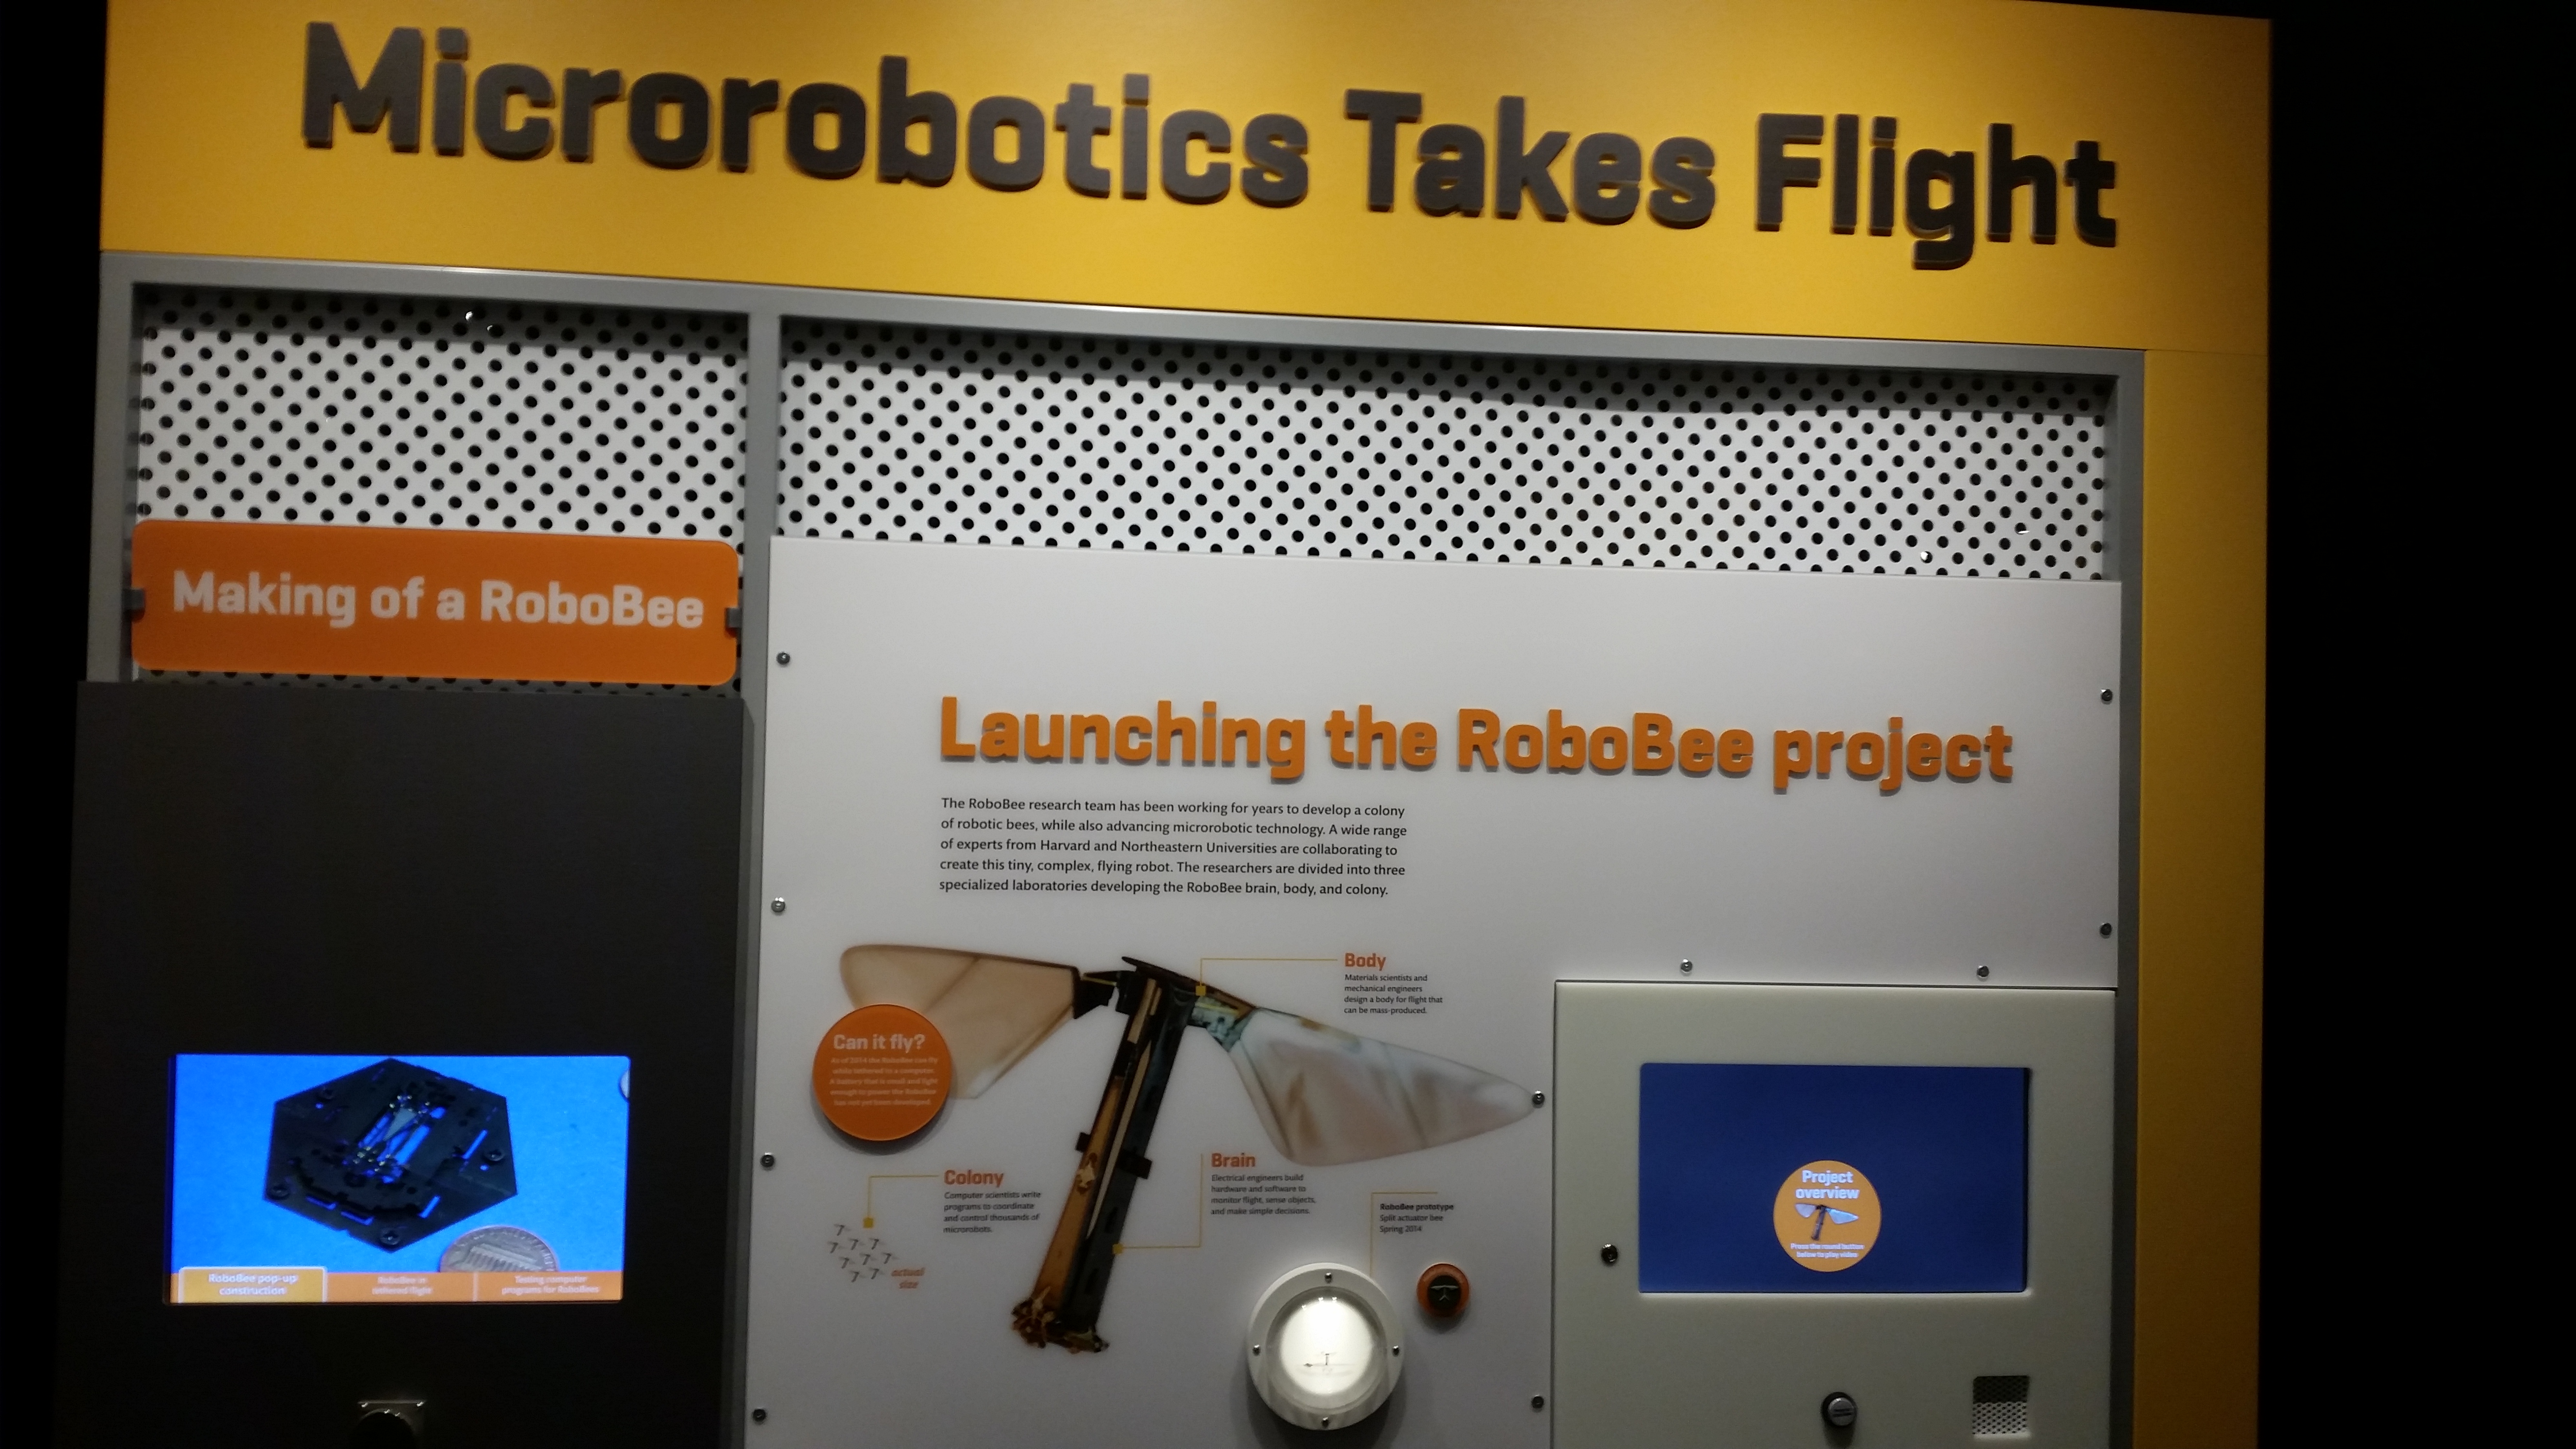
At Microbiotics Take Flight, we observed how robotic bees, initially developed to help explore and address some of the issues associated with Colony Collapse Disorder, an sickness of epidemic proportions that is devastating biological bee colonies across the globe.   The Microbiotic bees were developed by a multidisciplinary team of electrical engineers, computer scientists, and other scientific specialties.  The exhibit allowed a user to watch videos presentations on how the RoboBee was developed as well as manipulate scale replicas of the machines. 20141031_134946


The Conserve at home exhibit was perhaps the most practically useful on a personal level.  At this exhibit we were able to physcially quantify how much energy goes into using various devices that are used in the home.

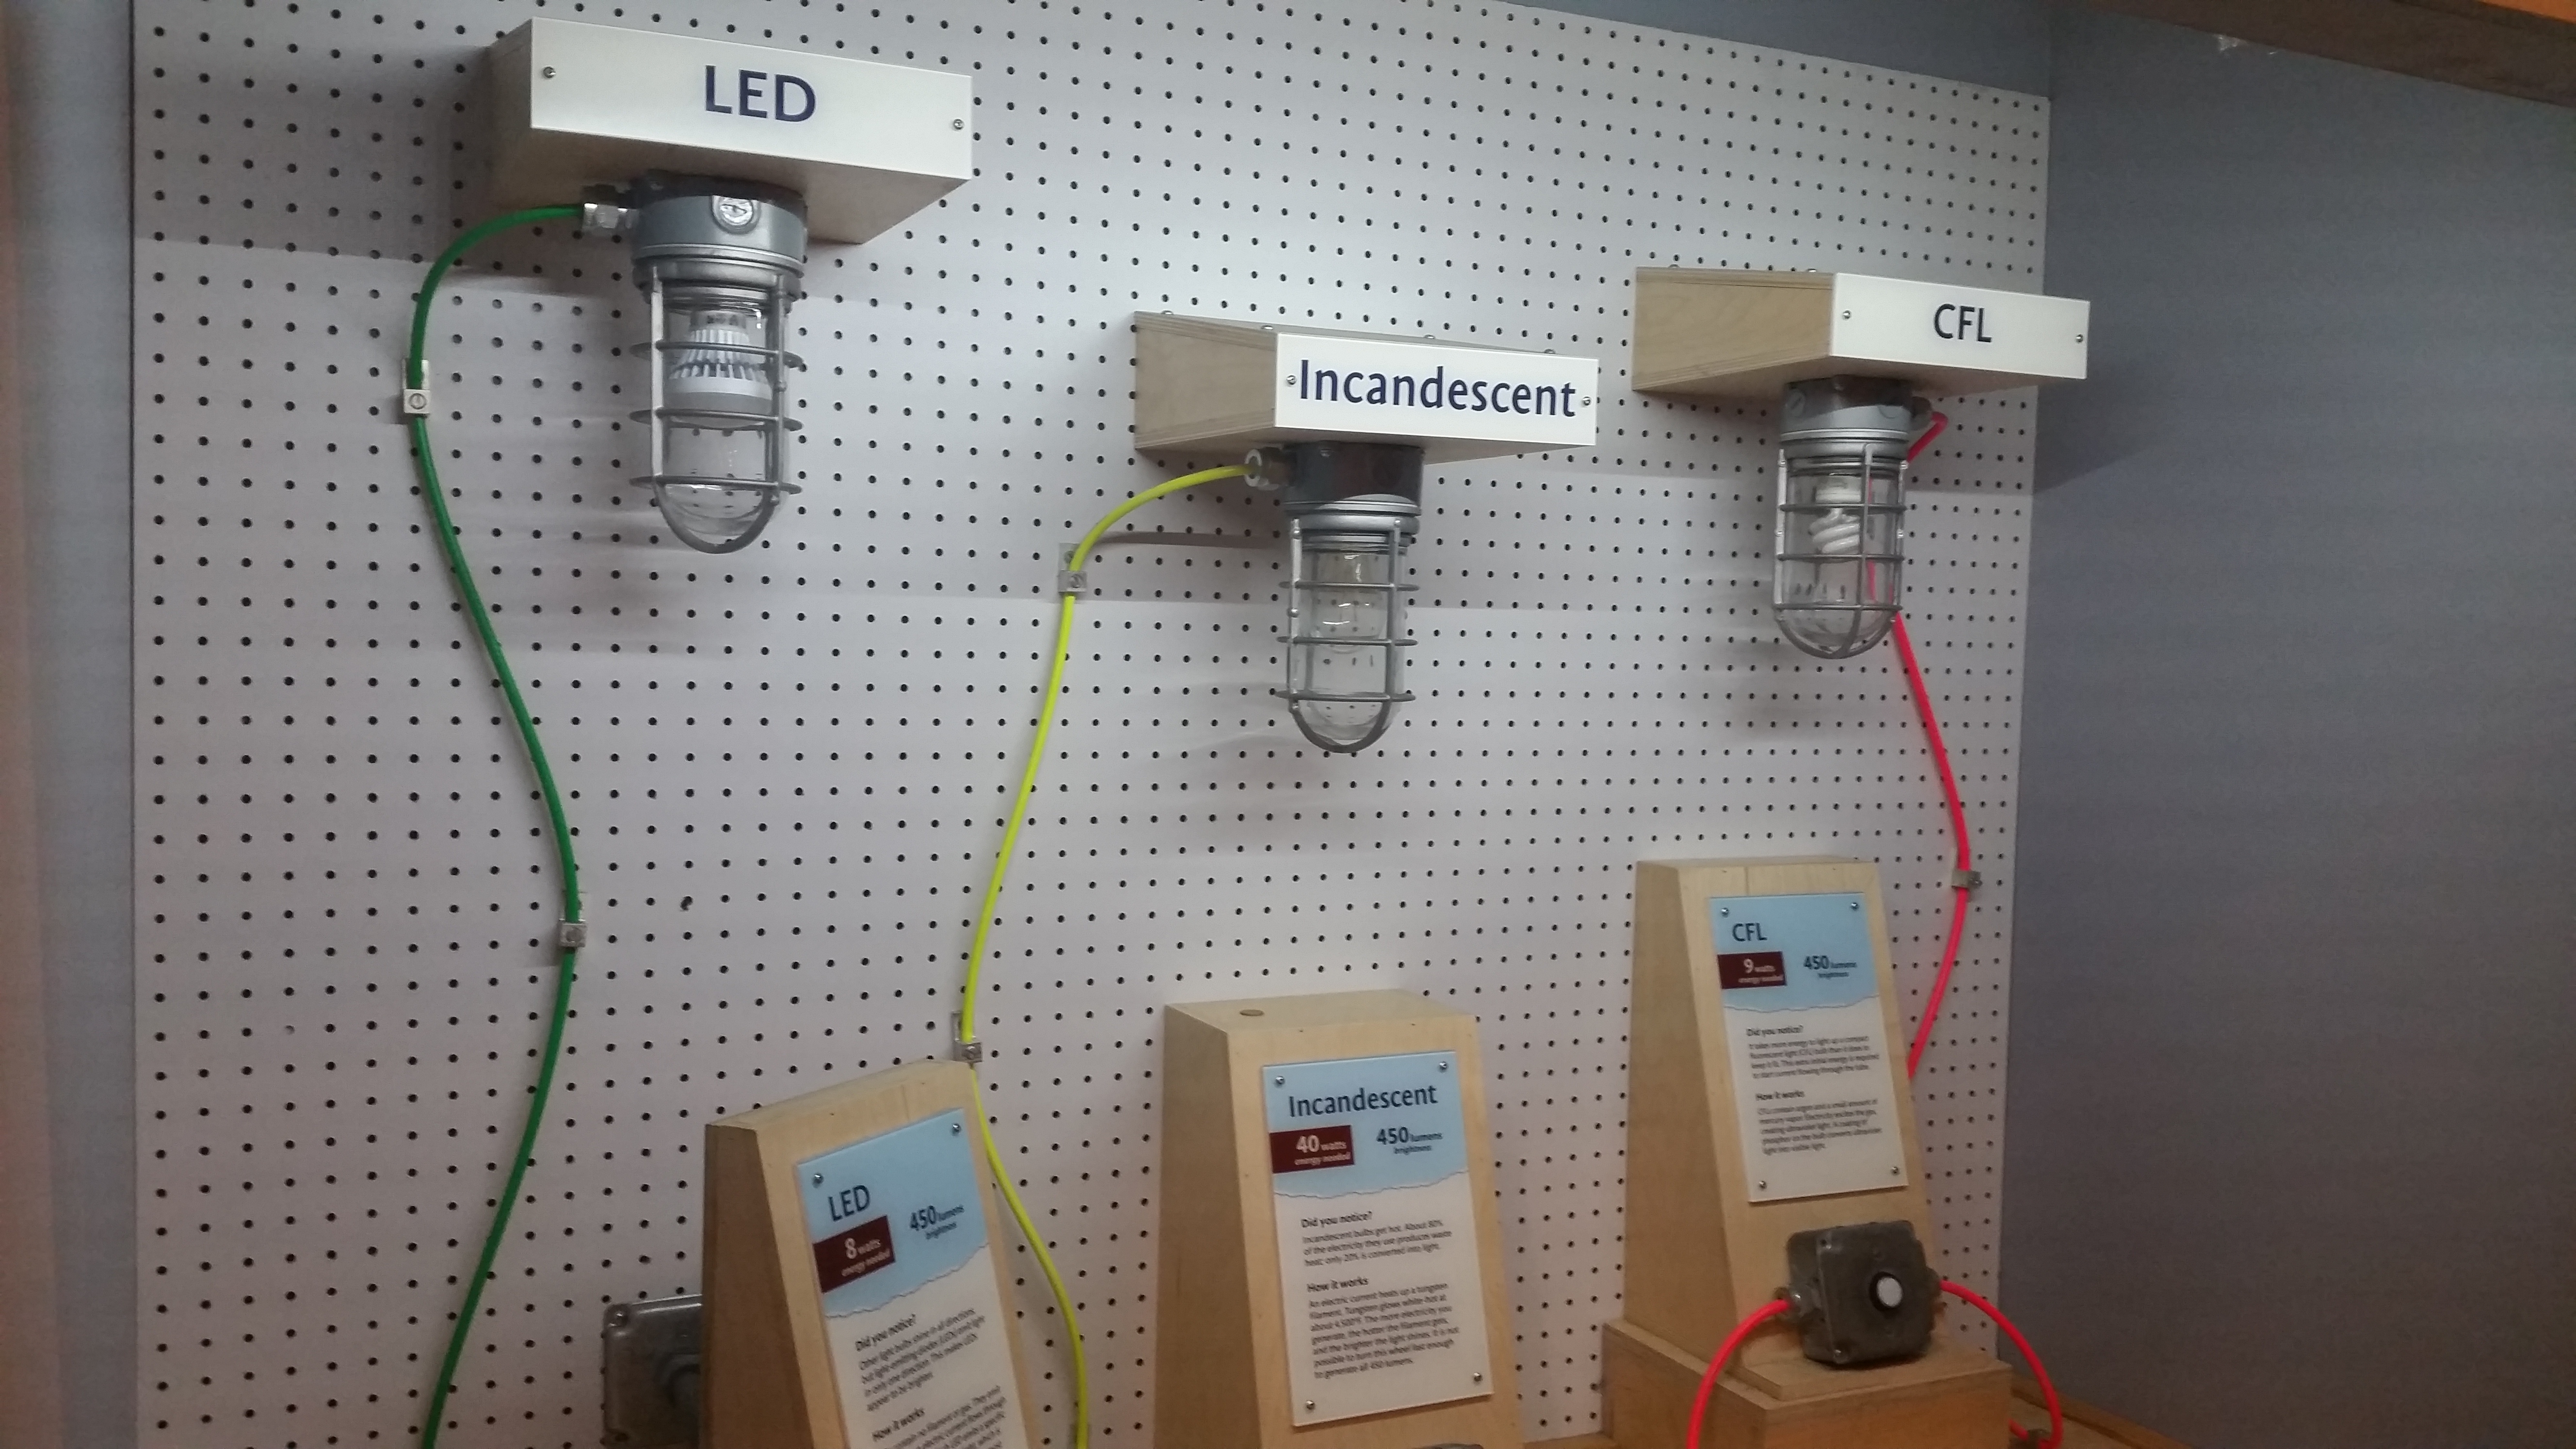
At the small exhibit on the energy usage of various lights, I observed the differences between CFL, LED and conventional  incandescent  light bulbs.

20141031_132126

The amount of light provided by a 40 watt incandescent bulb, can be provided by a CFL for 9 watts and and LED bulb for about 8 watts.  This energy savings is demonstrated by the hand crank generator at the exhibit that allows the user to rapidly spin a wheel to power each bulb.

The amount of hand cranking required to power the LED and CFL was significantly lower.  As one would expect, the savings are real.

Ultimately the museum of science didn’t have any big revelations for me as far as energy budgets and conversation are concerned, nor necessarily the advances being made on the forefront of bio mimicry.  It did however inspire me to be a little more innovative in my approach to projects I’m working on as well as future endeavors.

Ultimately, that’s a pretty good outcome for a museum devoted to science.


Solar energy lab

For this lab we measured the correlation or affect that the distance a light source has on the received power and also what affect different color filters have on the amount of received power. To test this, I used a photovoltaic cell (the receiver ) and a flashlight ( source ) to test this.

For various distances in pure light, here are the results I observed.


Distance from source Output Voltage
no light 0.38
0 cm 0.573
6 cm 0.54
12 cm 0.522
18 cm 0.511
24 cm 0.047


For various light filters, we used red, blue green and yellow set directly in front of the flashlight, these were my results.


Color Output Voltage
Red 0.58
Yellow 0.57
Blue 0.53
Green 0.52


All in all, I saw that as I would expect as the distance increases the power of the light received decreases.

And with the various colors, the closer the light source came towards the infrared spectrum, the more energy we observe as voltage from the photovoltaic cell.


Geothermal

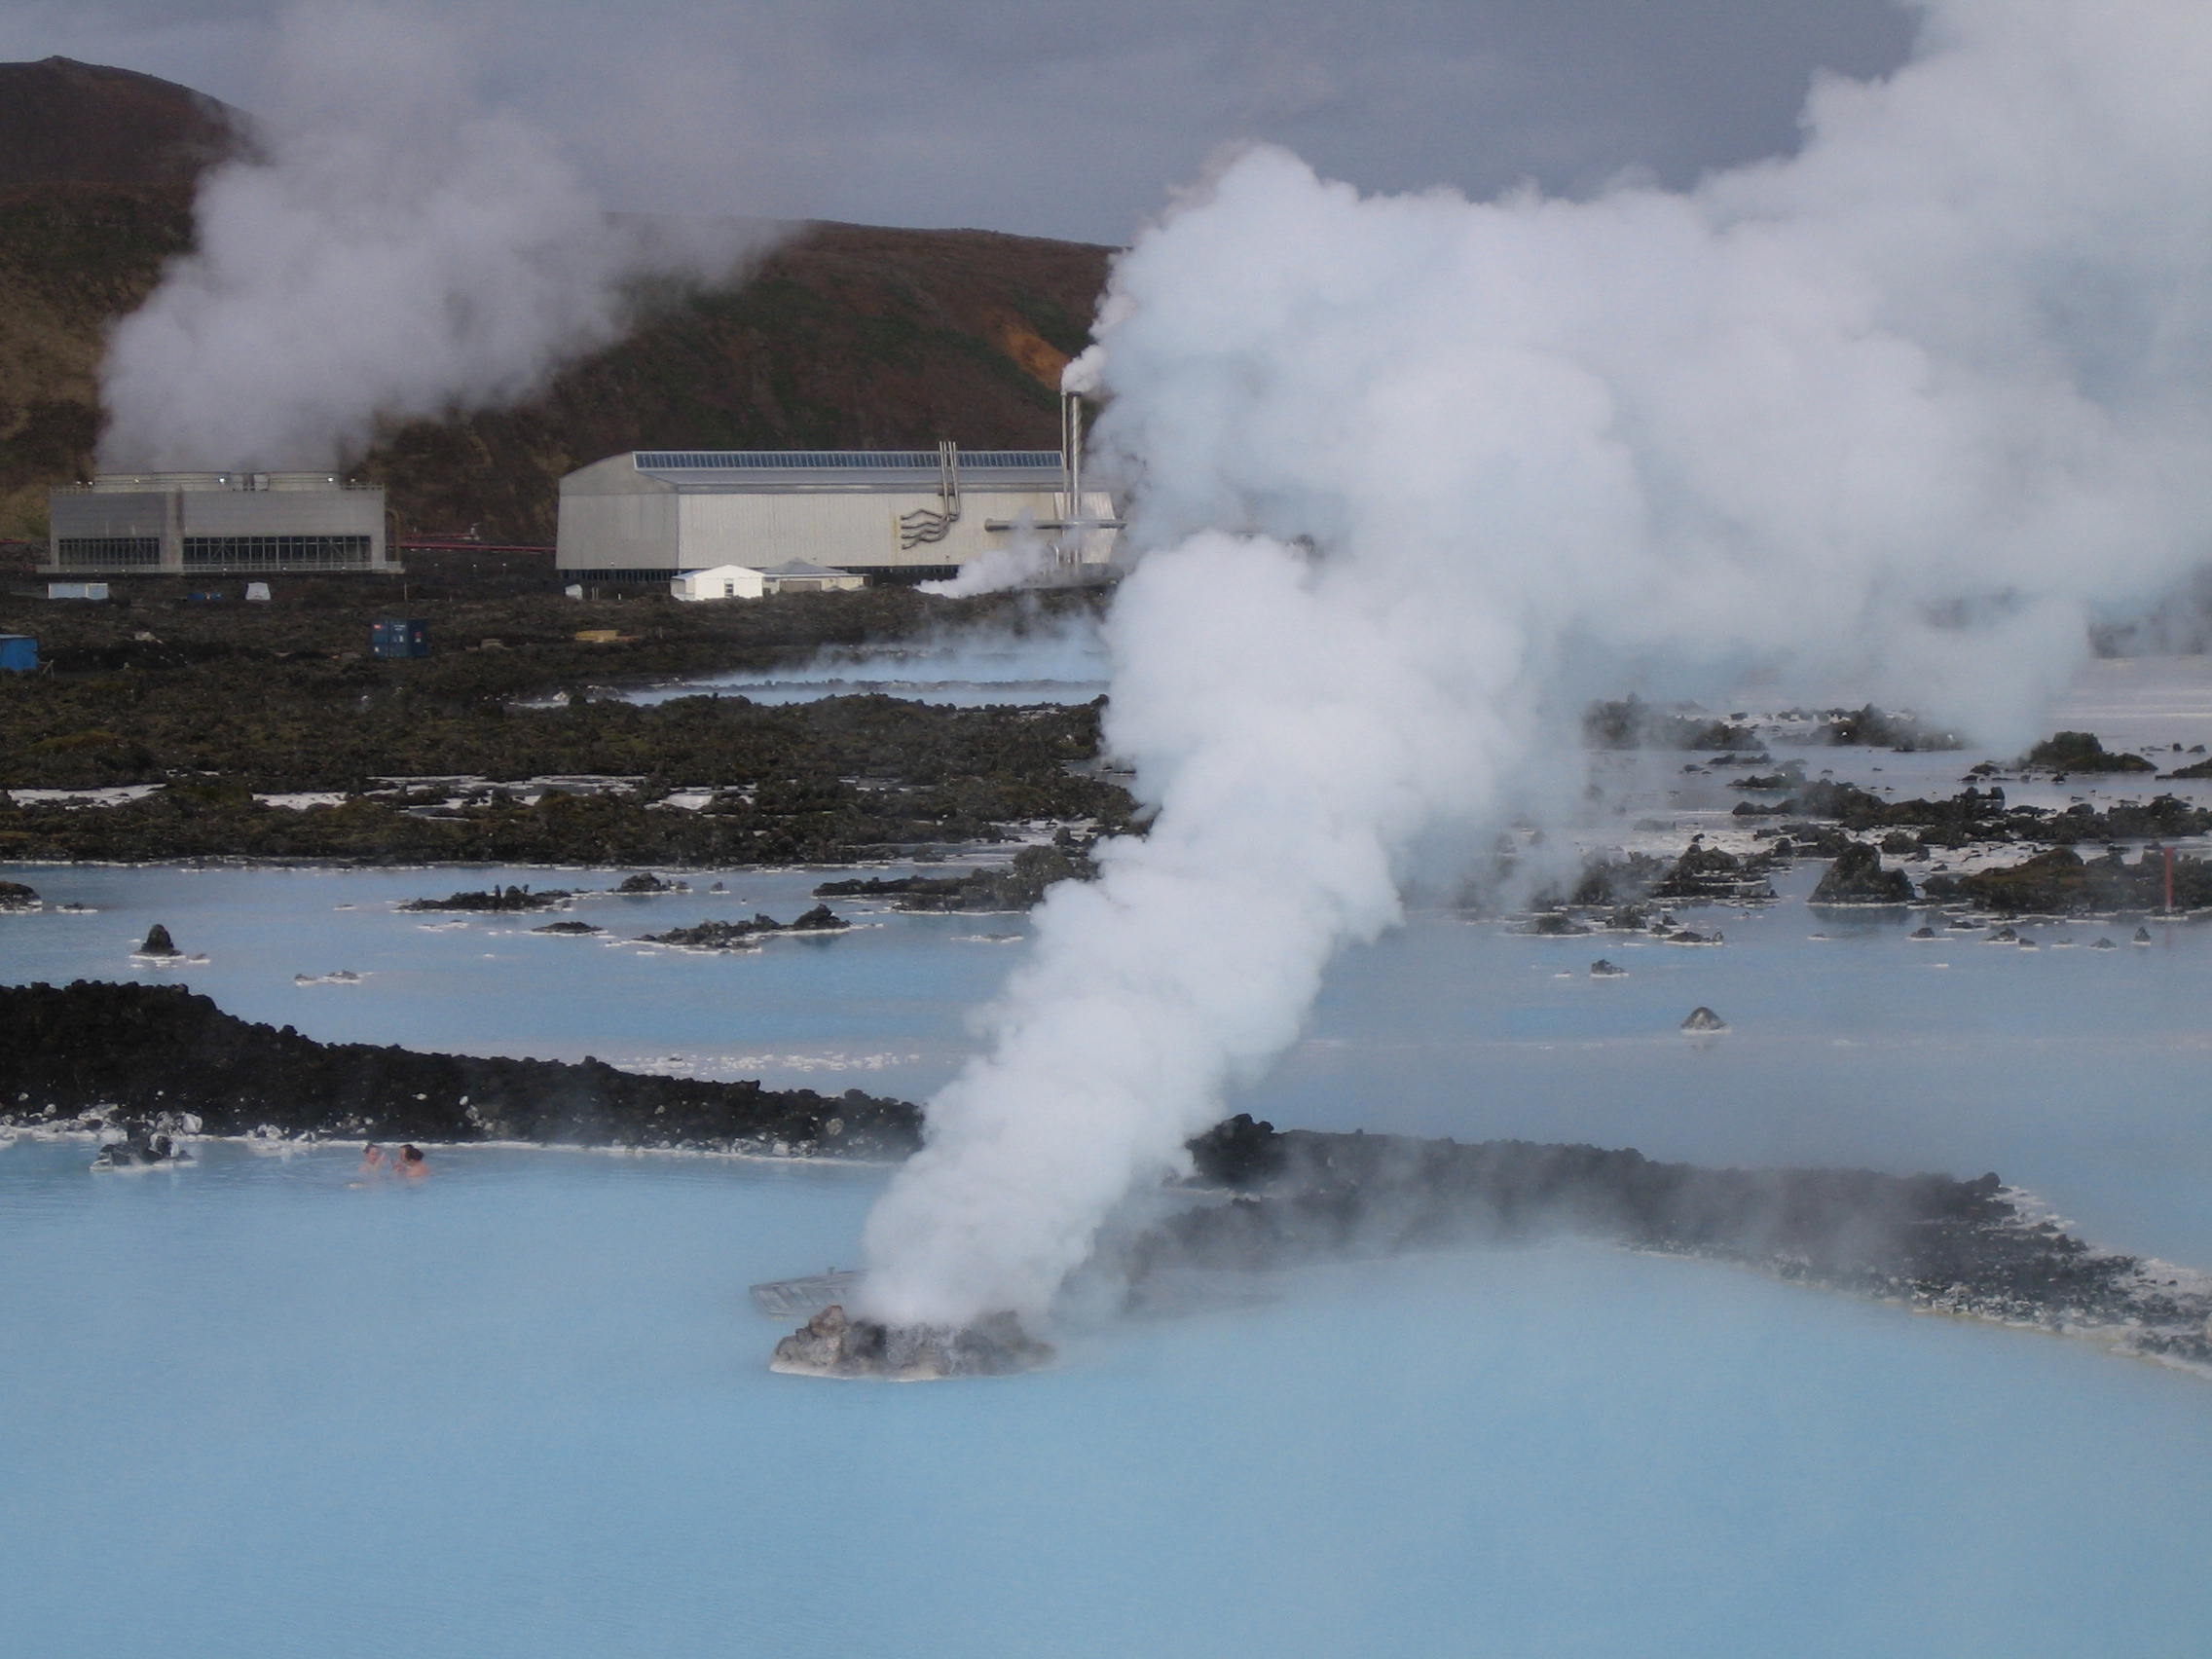
Iceland, is oft thought of as a curious island way station between the North American and European continents, but it has another, perhaps more significant distinction.  It is also the world leader in harnessing geothermal energy.

Thanks to its location above two separating tectonic plates, Iceland is one of the most volcanically active places in the world. And where there is volcanic activity, there is opportunity to harness heat for energy. [1]

One hundred years ago, organized use of geothermal energy in Iceland was just beginning.  In 1908, Stefan B. Jonsson began using hot water for space heating in his farm; soon after, other farmers began to independently create their own systems to heat their farms, and by 1930, at least 10 farmhouses in Southern Iceland were heated with geothermal energy.[1]

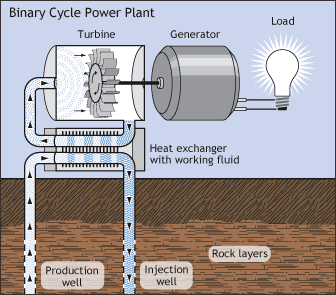
Conventional deep geothermal wells provide higher levels of energy in the form of hotter water, but also supply water with high levels of salinity and mineral content.  Modern equipment keeps the high-salinity water separate from the water used to transfer heat to homes and businesses.  Heat is transferred from the groundwater to the fresh water in three stages: Direct-contact heat exchangers heat water first, steam coming from exhaust turbines increases the temperature further and steam from high-pressure geothermally heated water provides the third stage of heat.

Well

Currently, well over 90% of homes in Iceland are heated by geothermal energy, the highest percentage in the world.  Most of the district heating in Iceland comes from three main geothermal power plants, producing over 800 MWh

B


The geothermal energy tapped from one of Iceland’s main power plants, Svartsengi, is available because the North American and European plates are moving away from each other beneath the island country. As a result, Iceland is growing at about the same rate that your fingernails grow—-2 centimeters every year on average. As the plates separate, magma oozes up from the Earth’s core and creates volcanoes, hot springs, and an ideal location for geothermal power plants.

According to Alexander Richter, Director of Sustainable Energy, Global Research and Communication at Glitnir Bank, Iceland is now the leading exporter of geothermal expertise to the rest of the world, according to the Trade Council of Iceland. The nation’s engineers, geologists and financiers work on projects anywhere there are incentives (as in Germany, which has a feed-in tariff on geothermal of 20 cents per kilowatt-hour) or easily-tapped reservoirs of underground heat (as in the Philippines). Iceland’s third-largest bank, Glitnir, helped finance the world’s biggest geothermal district heating project in the city of Xianyang, China, and it retains a staff of geologists to evaluate the potential of early stage drilling projects, such as one it financed in Nevada [3].

Geothermal also appears to be the mechanism for ushering Iceland’s economic future into fruition. Iceland is becoming an increasingly popular site to build data centers. It offers cool climates, political stability and low energy costs — all attractive features to data center operators.  Pardon the pun, but by all accounts Iceland is and will continue to be, a hot prospect.


Source:

[1] http://www.popularmechanics.com/science/energy/hydropower-geothermal/tour-one-of-icelands-incredible-geothermal-plants#slide-1

[2]  http://www.mannvit.com/GeothermalEnergy/DistrictHeating/DistrictHeatinginIceland/

[3] http://www.scientificamerican.com/article/iceland-geothermal-power/

MIT Nuclear Reactor


I’d walked by the unassuming building several times since moving to Boston, aging mid-20th century brick and what I took for an antiquated chimney led me to believe, had I put much thought to it,  that nothing relevant or important occurred behind it’s walls. I couldn’t have been more wrong.

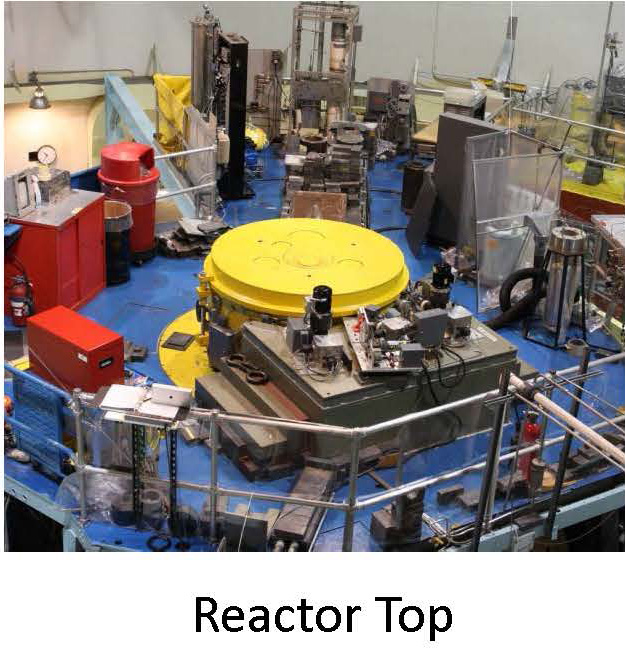
The MITR-II, the major experimental facility of the Nuclear Reactor Laboratory, is a heavy-water reflected, light-water cooled and moderated nuclear reactor that utilizes flat, plate-type, finned, aluminum-clad fuel elements. The average core power density is about 70 kW per liter.  In simpler terms this means that the reactor, used combination of deuterium and regular water to control the nuclear reaction.  Further, it used fuel pellets encased in aluminum to power the reactions that did occur.

reactortop


The MIT Research Reactor (MITR) is currently licensed to operate at 6 MW. As such, its power level is 500 times smaller than that of a typical commercial power plant that produces electricity. The MITR also operates at atmospheric pressure and at low temperature (50°C/122°F). The low power level means that the MITR has far less radioactivity in its core than does a power plant. The low pressure and low temperature mean that there is no driving force to push out what radioactivity there is in the unlikely event of an accident.

The NRL has one of the strongest materials and in-core loop programs in the country supporting research in the areas of advanced nuclear fuel and materials which are necessary for both existing and advanced power reactors.

  • Infrastructure to support the US initiative for designing and building the next generation of nuclear reactors as a means of reducing the country’s reliance on fossil fuels.
  • Advanced materials and fuel research.
  • Trace element analysis, isotope production, and irradiation services.
  • Neutron transmutation doping of silicon.
  • Neutron scattering.
  • A fission converter facility is available. It has been used for clinical trials of Boron Neutron Capture Therapy (BNCT).. This facility is able to deliver an estimated therapeutic dose in just a few minutes.[1]

When venturing further into the facility we noted that Reactor area was kept at a negative pressure relative to the outside world, thus if there was ever an incident, the contaminated air would stay inside the facility.  Further, all personnel are required to where dosimeters of various makes and sizes to ensure that no one receives more than they are supposed to in the course of their time near the reactor.

All in all, it was an interesting survey into the inner workings of a nuclear facility.


Source:

[1] http://web.mit.edu/nrl/www/research/research.htm

Fukushima Daiichi nuclear disaster

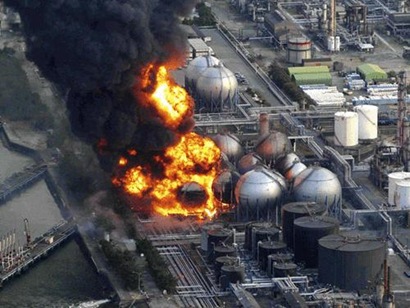
On March 11, 2011, a Magnitude 9.0 earthquake occurred 70 km from the coast of Japan.  The resulting Tsunami (or tidal wave ) was 40.5 meters in height and traveled up to 10 km inland from the coast.  The resulting level of devastation hadn’t been seen in Japan since the Second World War.

burning

The  Fukushima Daiichi Nuclear power plant was a BWR nuclear power plant ( Boiling Water Reactor – a type of reactor that utilizes boiling water to create electricity ) situated on the coast of the eponymous Fukushima District.[1].


When the Tsunami collided with the infrastructure of the plant the results were as devastating as they were predictable.  When 15 meter waves disabled the power supply and cooling systems of three reactors, all three cores largely melted within the first three days [2]. This occurred largely due to swamping of 12 of 13 back-up generators on site and also the heat exchangers for dumping reactor waste heat and decay heat to the sea. The three units lost the ability to maintain proper reactor cooling and water circulation functions. Electrical switchgear was also disabled. Thereafter, many weeks of focused work centered on restoring heat removal from the reactors and coping with overheated spent fuel ponds.

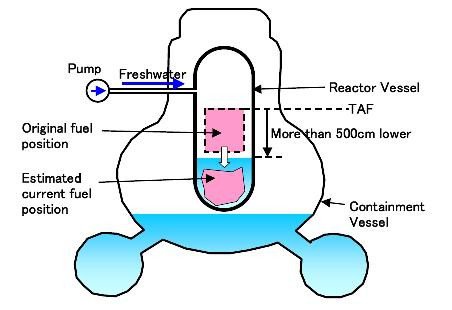
reactor vessel

Looking at a specifec case, recent analysis suggests that the fuel assemblies in unit 1 were almost in unit 1 were almost completely melted in the days following the March 11 earthquake and tsunami. The ‘corium’ (melted actinide fuel, contained fission products, clad etc.) then dropped to the bottom of the reactor pressure vessel (RPV). It is now suspected that during the initial accident, the fuel rods of Reactor No. 1 could have been fully exposed for up to 17 hours, and the earthquake may have caused some structural damage that led to pipe leakage and other problems, in addition to the severe troubles caused by the extended station blackout following the tsunami (which remains the principal cause of the problems) in the days following the March 11 earthquake and tsunami. The ‘Corium’ (melted actinide fuel, contained fission products, clad etc.) then dropped to the bottom of the reactor pressure vessel (RPV). It is now suspected that during the initial accident, the fuel rods of Reactor No. 1 could have been fully exposed for up to 17 hours, and the earthquake may have caused some structural damage that led to pipe leakage and other problems, in addition to the severe troubles caused by the extended station blackout following the tsunami (which remains the principal cause of the problems) [3].

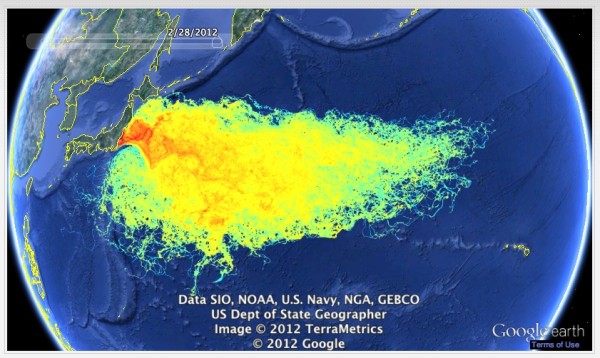
Further, the resulting contaminated water leaked into the sea in a plume that spread far beyond it’s shores, raising concerns on the saftey of consuming food drawn from the Pacific Ocean.

radioactive-seawater-map71-600x358

Looking forward, Japan’s ruling cabinet approved a new national energy strategy earlier this year that designates nuclear power as an important energy source and calls for restarting idled nuclear plants that meet new safety standards. The new strategy, first proposed by the government of Prime Minister, scraps a promise made by a previous government after the 2011 Fukushima nuclear disaster to phase out atomic energy. Under the new plan, Japan would begin to restart at least some of its 48 operable commercial reactors, which were stopped after the Fukushima accident spread nuclear radiation across northern Japan.[4]

However, it also calls for a reduction in nuclear power’s share of electricity production, an increase in Japan’s use of renewables, continued use of natural gas as a medium term bridge fuel, improvements in energy efficiency, and increased attention to research and development of both renewable energy and potential future energy sources such as methane hydrates.[5]

As lacking as Japan is in energy sources to power it’s economy, the resulting decision isn’t that surprising.  Just the same, for a country that has for the 3rd time been on the receiving end of a devastating nuclear incident, the urgency to develop a safer, reliable, renewable fuel to power the world of tomorrow couldn’t be any more urgent.


Source:

[1]  http://en.wikipedia.org/wiki/Fukushima_Daiichi_Nuclear_Power_Plant

[2] http://www.world-nuclear.org/info/Safety-and-Security/Safety-of-Plants/Fukushima-Accident/

[3] http://bravenewclimate.com/2011/05/18/fukushima-open-thread-6/

[4] http://www.nytimes.com/2014/04/12/world/asia/japan-new-energy-strategy-approved.html

[5] http://forumonenergy.com/2014/06/10/an-analysis-of-japans-4th-strategic-energy-plan/

Stirling Engines and Peltier Devices

When it comes to the world of novel power machines and devices, Peltier coolers and Stirling engines are at the top of the heap.


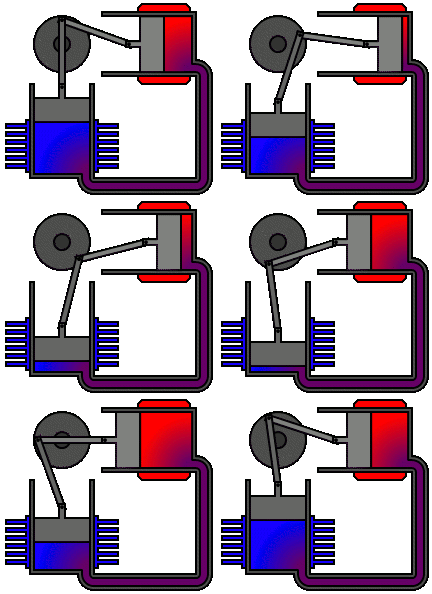
The Stirling engine, a novel heat engine developed by Robert Sterling in 1816, the key principle of a Stirling engine is that a fixed amount of a gas is sealed inside the engine. The Stirling cycle involves a series of events that change the pressure of the gas inside the engine, causing it to do work.[1]

Heat applied,

Alpha_Stirling

  • If you have a fixed amount of gas in a fixed volume of space and you raise the temperature of that gas, the pressure will increase.
  • If you have a fixed amount of gas and you compress it (decrease the volume of its space), the temperature of that gas will increase.

One cylinder is heated by an external heat source (such as fire), and the other is cooled by an external cooling source (such as ice). The gas chambers of the two cylinders are connected, and the pistons are connected to each other mechanically by a linkage that determines how they will move in relation to one another.

A modern conceptualization of the Stirling engine is helping to bring lighting to under developed communities.  Dean Kamen, an entrepreneur in Bangladesh, developed a Stirling engine that is so far powering three remote villages. What particularly suits the Stirling for the developing world is that it can burn any liquid or gas fuel, and unlike other engines, it can tolerate fuel with impurities. Most generators can’t do much with carbon-dioxide-infused methane released by decomposing cow manure, but the Stirling is happy with it[2].


Thermoelectric cooling uses the Peltier effect to create a heat flux between the junction of two different types of materials. A Peltier cooler, heater, or thermoelectric heat pump is a solid-state active heat pump which transfers heat from one side of the device to the other, with consumption of electrical energy, depending on the direction of the current. Such an instrument is also called a Peltier device, Peltier heat pump, solid state refrigerator, or thermoelectric cooler (TEC).

2


Applying current across the junction, creates a hot side and a cold side.  This feature can then be exploited to cool or heat an object and only electricity is required.  Many cars today that have console drink coolers utilize this technology. [3]

Whether providing a modern convenience, such as the beverage cooler, or the more fundamental gift of providing electricity to help lift marginalized people out of poverty. Technology mustn’t necessarily be new to have a new affect on the world.

Sources:

[1] http://auto.howstuffworks.com/stirling-engine1.htm

[2] http://spectrum.ieee.org/energy/renewables/empire-off-the-grid/gridsb01

[3] http://en.wikipedia.org/wiki/Thermoelectric_cooling

Mr. Vales Presentation


“Nothing in life is to be feared, it is only to be understood. Now is the time to understand more, so that we may fear less.”  That’s what Madame Curie, said, and while true, a fitting caveat may be, that with shift from ignorance and fear to an understanding peace, a price must be paid.  And Madam Curie certainly paid that price.

Mr Vales presentation on the physics and history of nuclear research in America was illuminating.  Initially, he touched on the subject of radioactive decay, when unstable isotopes of heavy elements decay or disintegrate into other elements.

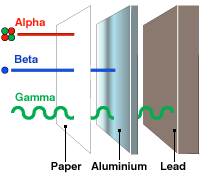
There are three main types of radioactive decay: alpha, beta and gamma.

During Alpha decay an atom spits out two protons and two neutrons from its nucleus. This little bundle is called an “alpha particle.” Alpha particles can be stopped by paper.

  • Alpha decay usually happens in larger, heavier atoms.
  • The symbol looks like Helium because Helium-4 has the same number of protons and neutrons as an alpha particle (no electrons, though).

In beta decay a neutron sends its electron packing, literally ejecting it from the nucleus at high speed. The result? That neutron turns into a proton! Beta radiation can be stopped by wood.

Gamma rays are electromagnetic radiation similar to light. Gamma decay does not change the mass or charge of the atom from which it originates. Gamma is often emitted along with alpha or beta particle ejection. As this is a very high energy decay product, Gamma rays can only be stopped by very dense substances, such as lead.[1]

alpha beta gamma diagram


Just after the turn of the century when the nature of radioactive elements were being discovered. Madam Curie was instrumental in many of these revelations.

Born in Warsaw, Poland at the end of the 19th century, Curie grew up a bright girl with a curious mind.  A top student in her secondary school, Curie could not attend the men-only University of Warsaw. She instead continued her education in Warsaw’s “floating university,” a set of underground, informal classes held in secret.

Later, Marie and husband Pierre Curie were dedicated scientists and completely devoted to one another. At first, they worked on separate projects. She was fascinated with the work of Henri Becquerel, a French physicist who discovered that uranium casts off rays, weaker rays than the X-rays found by Wilhelm Roentgen.[2]

Curie took french physicist Henri Becquerel’s work a few steps further, conducting her own experiments on uranium rays. She discovered that the rays remained constant, no matter the condition or form of the uranium. The rays, she theorized, came from the element’s atomic structure. This revolutionary idea created the field of atomic physics and Curie herself coined the word radioactivity to describe the phenomena. Marie and Pierre had a daughter, Irene, in 1897, but their work didn’t slow down.[2]

Her incisive research came at a cost however. All of her years of working with radioactive materials took a toll on Curie’s health. She was known to carry test tubes of radium around in the pocket of her lab coat. In 1934, Curie went to the Sancellemoz Sanatorium in Passy, France, to try to rest and regain her strength. She died there on July 4, 1934, of aplastic anemia, which can be caused by prolonged exposure to radiation.[3]

Curie wasn’t the only victim of the new found radioactive substances. Young women tasked with applying radium to the dials of watches died in significant numbers due to ingesting Radium in the process of their work.  From cookware to watches many articles from that era carried dangerous emitting substances that affected uncounted numbers of people.  Thankfully, our knowledge of the nuclear world has increased significantly, and our lives are greatly improved for it.


[1] http://edtech2.boisestate.edu/lindabennett1/502/Nuclear%20Chemistry/types%20of%20decay.html

[2] http://www.biography.com/people/marie-curie-9263538#synopsis

[3] http://www.nobelprize.org/nobel_prizes/physics/laureates/1903/marie-curie-facts.html


Lego Mindstorm Pulley Experiment

Lego Mindstorm Pulley Lab

For this lab, I set out to explore Newton’s 2nd law of motion (Force = Mass * Acceleration ) and the Law of Conservation of Energy ( Energy = Mass * Acceleration * Height ).    Using a Lego Mindstorm Robot, a set of pulleys and weights, I was able to test and observe these various laws in action.

Part 1.

For the first experiment, I set up the pulley apparatus and connected it to the Mindstorm drive motor which I set to apply a constant power regardless of the load (power level 50 in this case ).

Mass (kg) Acceleration (m/s^2) Power
0.2 17.012821 50
0.16 22.135246 50
0.14 27.969872 50
0.12 42.530809 50

By the data above, it’s clear that as the mass decreases, the acceleration of the object increases as it’s masses increases; according to Newton’s 2nd Law that is what I should expect. All to the good.

Part 2.

For the second part, we tested the relationship between power and acceleration.  To do this, I kept the mass constant and changed the power level of the Mindstorm.

Power Acceleration (m/s^2) Mass ( kg )
70 77.533968 0.2
60 45.572917 0.2
50 24.731086 0.2
40 7.432376 0.2


As I expected, as the power level ( and by extension the force applied ) increased, the acceleration increased proportionally.  This too is in accord with Mr. Newton’s findings in regards to his 2nd Law of Motion.


Part 3.


For the final portion of the lab, I explored the Law of Conservation of Energy (Potential Energy = Mass * Acceleration * Height ).  Using a height of 0.2 meters, I observed the following:


Power Level Acceleration Mass Time Potential Energy (Joules) Power Used (Watts)
50 17.012821 0.2 2.173 392 180.3957662
50 22.135246 0.16 1.991 313 157.2074335
50 27.969872 0.14 1.661 274 164.9608669
50 42.530809 0.12 1.132 235 207.5971731


Further, Watts ( a unit of power ) cab be defined as an amount of energy per unit time.  Therefore, by dividing the potential energy by time, I get the wattage or power used to lift the object.  In simpler terms, all the weights have the same amount of work performed on them; as Work = Force * Distance, with a constant force ( 50 ) and a constant distance ( 20 cm ).  Further, as power can be defined as Work / Time, we can see why as the mass decreases from 0.2 to 0.16 there is a significant drop in the amount of power used.  However, as the mass of the weights used continues to drop, the time required to complete the movement decreases, thus the power required to move the weight (Work / Time ) begins to increase accordingly.

Solar Power

Solar energy, the radiant energy produced by the sun, is steadily becoming the avenue of choice in energy production across the globe; ballooning fuel costs as well as growing concern over the dangers of global warming have made harvesting solar energy an attractive option for many countries around the world.

In Germany, solar projects,  consists mostly of photovoltaics (PV), cells that convert sunlight directly to electricity, and — to a lesser extent — solar heating, the direct conversion of sunlight into heat.  The country has been the world’s top PV installer for several years and still leads in terms of the overall installed capacity; that amounts to 37.8 gigawatts by August 2014, ahead of China, Italy, Japan, or the United States.  Altogether, this abundance allows the PV’s to meet %8 of Germany’s electrical needs.

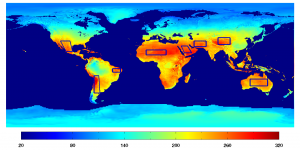
The graphic below depicts the total soar irradiance that falls upon the globe; when that 8% is compared with the amount of solar energy available to Germans, the achievement appears even more impressive.

solar_power2

Annual Solar Radiance across the globe ( watts/ square meter )


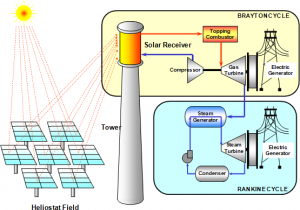
In Saharn Africa, the TuNur, project is providing significant promise.  Using thousands of mirrors to track the Tunisian sun to use its heat to generate electricity, the TuNur Concentrating Solar-thermal Power (CSP) plants will ultimately produce 2 Gigawatts of electricity, roughly double the average nuclear power plant. CSP, is solar technology wherein instead of directly converting the suns rays to electricity. It is instead used to superheat oil reservoirs that are then used to spin a steam powered turbine which is then used to generate electricity.

47

Concentrated Solar Power System


Project developer Nur Energie and its Tunisian partners, led by Top Oilfield Services, plan to construct the project in several phases.[4]  On average Saharan Africa receives over 2000 kWh of electricity; by some estimates, with numbers that high. By covering just 3% of the Sahara with solar panels.  All the worlds current energy needs could be met.

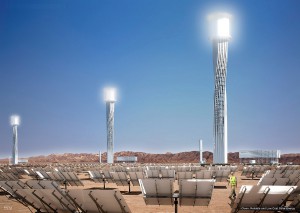
Closer to home, the Ivanpah Solar Electric Generating System is a solar thermal power plant in the California Mojave Desert.  It uses 173,500 heliostats to focus solar energy on to boilers mounted atop 3 towers.  The superheated steam this heat transfer creates is used to spin turbines to generate the 377 MW the plant can produce on a good day.  That is enough to power 144,000 homes.[5]

While, solar power can provide a lot of clean power, with minimal maintenance. High capital start up costs (the TuNur plant had a 400 M Euro price tag ), as well variable weather over most of the world make large scale projects less than feasible.  However, as Germany has shown, small scale photovoltaic can produce substantial energy output in relatively sunless climates.  As the cost to produce each kilowatt of solar electricity falls (4.5 cent/kWh ) and their efficiency continues to improve [6], solar power may prove to be the saving technology our planet so desperately needs.


The-Ivanpah-Solar-Facility-3

The Ivanpah Solar Facility


Sources

[1] http://en.wikipedia.org/wiki/Solar_power_in_Germany

[2] http://www.euractiv.com/energy/steps-bring-saharan-solar-europe/article-184274

[3] http://www.desertec.org/press/press-releases/120124-01-desertec-foundation-tunisian-sun-will-light-european-homes-by-2016/

[4] http://www.desertec.org/press/press-releases/120124-01-desertec-foundation-tunisian-sun-will-light-european-homes-by-2016/

[5] http://www.brightsourceenergy.com/ivanpah-solar-project#.VD8CzWfRiSo

[6] http://pureenergies.com/us/how-solar-works/solar-panel-efficiency/